
Abstract
Our previous transcriptome study of cultured fibroblasts identified 178 genes that were differentially expressed by 8 idiopathic pulmonary fibrosis (IPF) fibroblasts compared with 4 controls. Here, we performed genome-wide DNA methylation analysis to evaluate the relationship of CpG methylation to differential gene expression. Among 485,577 loci, 5850 loci on 2282 genes showed significant differences between the 2 groups (delta-beta >10.21 and p-value <0.05). Among these, beta values of 80 CpGs (30 hypermethylated and 50 hypomethylated) were significantly correlated with mRNA expression of 34 genes (19.1%) of the 178 differentially expressed genes between the 2 groups (13 downregulated and 21 upregulated). Gene ontology enrichment of these genes included cell adhesion, molecule binding, chemical homeostasis, surfactant homeostasis, and receptor binding. One-third of them are involved in the known process of fibrosis; the others are novel genes with respect to pulmonary fibrosis. We identified relationships between the altered DNA methylation levels and about one-fifth of the corresponding changes in gene expression by lung tissue fibroblasts. Findings from this study provide new information on novel genes responsible for the pathogenesis of IPF under the control of CpG methylation changes in IPF lungs.
Background
Idiopathic pulmonary fibrosis (IPF) is characterized by alveolar epithelial cell hyperplasia and myofibroblast proliferation, with interstitial deposition of extracellular matrix (American Thoracic Society, 2000; Gross and Hunninghake, 2001). The course of disease progression is highly variable, ranging from long-term stability to rapid progression with high mortality (American Thoracic Society, 2000; Gross and Hunninghake, 2001; Kim et al., 2006). A variety of factors, combined with a permissive genetic background, are thought to play roles in the development and progression of pulmonary fibrosis (Momen et al., 2003; Wynn, 2011). The heterogeneous manifestations may be due to aberrant gene expression by the inflammatory and constitutional cells of the IPF lung, such as fibroblasts, in response to the environment (Raghu et al., 1988; Marchand-Adam et al., 2006). Some studies on global gene expression by fibroblasts have identified novel candidate genes including FBXO32, CXCL14, BDKRB1, NMNAT1, RARA, CDKN2D, IFITM1–3, and ISG15 (Emblom-Callahan et al., 2010; Lindahl et al., 2013). Additionally, we previously found differential expression of 178 genes between IPF and control fibroblasts (Lee et al., 2017). The gene expression may be associated with exposure to environmental triggers, such as cigarette smoke, metal dust, occupational dust, chemical fumes, and microbial agents, as well as gastroesophageal reflux (Tobin et al., 1998; Stewart et al., 1999; Kropski et al., 2012; Lee et al., 2015). These triggers are capable of inducing innate and adaptive immune responses via genetic or epigenetic mechanisms (Hoebe et al., 2004). Rabinovich et al. (2012) found that 625 CpG islands were differentially methylated between IPF and control lung tissues. In addition, a comparative analysis of genome-wide DNA methylation and gene expression demonstrated that 870 of 14,000 genes were differentially methylated (Sanders et al., 2012). These data provide more integrated information to explain the complex molecular mechanisms behind the development and course of IPF.
Similar target tissue composition is mandatory because transcriptomes and epigenetic markers are cell-type specific. In fact, the characteristic pathology of typical interstitial pneumonia comprises mixed features, including normal lung tissue, alveolar inflammation, interstitial fibrosis, and honeycomb changes (Kim et al., 2006). Accordingly, a comparison of diseased with normal lung-derived fibroblasts may be ideal for methylation and transcriptome studies. To investigate the relationship of CpG DNA methylation to gene expression by IPF fibroblasts, we performed global methylation analysis of cultured fibroblasts obtained from lung tissues of 8 IPF subjects and 4 subjects with normal lungs and analyzed the relationship of CpG methylation to the 178 differentially expressed genes (DEGs) by the same fibroblasts in IPF and control lungs (Lee et al., 2017). Partial results of this study have been reported elsewhere in the form of an abstract (Lee et al., 2017).
Materials and Methods
Extraction of DNA from cultured fibroblasts and methylation microarrays
Lung tissue fibroblasts were obtained by surgical biopsy in patients with IPF and from normal-looking lungs with localized lung cancer and then cultured as described in our previous study (Lee et al., 2017). Fifth-passage fibroblasts (2.5 × 10⁶) were seeded in 1 mL tissue culture media, which consists of Dulbecco's modified Eagle's medium (Lonza Walkersville, Inc., Walkersville, MD), 10% fetal bovine serum (Thermo Fisher Scientific, Inc., Rockford, IL), 2 mM glutamine, and 1% penicillin–streptomycin–amphotericin (Lonza Walkersville, Inc.) in 10-cm2 dishes. After reaching 90% confluence, the fibroblasts were washed twice with Dulbecco's phosphate-buffered saline (Thermo Fisher Scientific, Inc., Waltham, MA), and the cell pellets were used for DNA preparation. Genomic DNA was purified using a QIAamp DNA Mini Kit (Qiagen, Hilden, Germany). Thermo Scientific NanoDrop 1000 spectrophotometer (Wilmington, DW) was applied to measure 260/280 nm absorbance for each sample, and the ratio (>1.8) was accepted as DNA samples suitable for the study. The quality and quantity of the extracted DNA were examined using the PicoGreen® double-stranded DNA reagent (Invitrogen, Carlsbad, CA). Fluorescence was determined using a Victor3 fluorometer (PerkinElmer, Boston, MA). Bisulfite conversion of 500 ng DNA was performed according to the manufacturer's recommendations using the EZ DNA Methylation Kit (Zymo Research, Irvine, CA), and DNA methylation analysis was performed using the HumanMethylation 450 BeadChip (Illumina, Inc., San Diego, CA).
The DNA methylation data were normalized using the “Background Subtraction” and “Normalization to Internal Controls” methods offered by the GenomeStudio software. The methylation score for each CpG site, represented by a beta value (β = intensity of the methylated allele/[intensity of the unmethylated allele + intensity of the methylated allele]), was calculated for each of the 450 K CpG sites. M-values were used for statistical inference and were calculated as the log2 ratio of the intensity of the methylated probe to that of the unmethylated probe, as described by Du et al. (2010). The delta-beta value was the difference in beta values between the IPF and the control groups for each CpG site; it was calculated by subtracting the average beta value of the control group from that of the IPF group. Delta-beta values >10.21 with p-values <0.05 by Student's t-tests were considered statistically significant. Heat maps of mRNA expression levels and beta values were evaluated using the GenomeStudio software. Gene functional annotation was performed by the DAVID (Database for Annotation, Visualization, and Integrated Discovery) bioinformatics resource v 6.8 (Huang et al., 2007). Genes were classified by biological process, cellular component, and molecular function via the GO (Gene Ontology) and KEGG (Kyoto Encyclopedia of Genes and Genomes) databases.
Transcriptome microarray
For the transcriptome microarray data, we used the Gene Expression Omnibus (GEO) database under accession number GSE71351, which was our previous submission, and analyzed as per the method described previously (Lee et al., 2017). Briefly, total RNA was extracted from the fibroblasts and converted to cDNA, which was amplified and purified using an Illumina® Total Prep™ RNA Amplification Kit (Ambion, Carlsbad, CA). A transcriptome assay was performed using a HumanHT-12 (BeadChip Illumina, San Diego, CA) containing sequences representing ∼47,315 probes, which covered 27,455 curated and putative genes. The quality and quantity of the extracted RNA were examined by a RNA quantification reagent (Ribogreen®; Invitrogen). Genes showing detection call p-values <0.01 were discarded to reduce the number of false positives, and the remaining 15,020 genes were analyzed. Fold change of gene expression was calculated as follows: a mean of expression levels of IPF − fibroblasts divided by that of control fibroblasts if the levels were higher in the IPF than in the controls. In cases of countertrend, the fold change was determined by dividing the mean value of the control group by that of the IPF group and presented as minus value. The microarray data were analyzed using the ScoreGenes software package. The general approach to analysis has been previously described (Dave and Kaminski, 2005). Genes were defined as being substantially changed if they had a p-value of <0.05 by t-test, a threshold number of misclassifications score of 0, and absolute fold change of >2, as previously described (Radom-Aizik et al., 2007).
Pyrosequencing analysis
We used the bisulfite pyrosequencing method for methylation analyses of the S100A4 gene. Each primer was designed using the Pyrosequencing Assay Design Software v2.0 (Qiagen). The primer sequences used were as follows: three CpG sites on promoter of S100A4: forward primer 5′-GAGTTATGTATATTGGGTGGTGTT-3′; biotinylated-reverse primer 5′-CCCAACCCTAAAACCAAACCTCCTATT-3′; sequencing primer 5′-TTTTATTTAGTTTTTTGTTAGTA-3′. PCR was carried out in a volume of 20 μL with 20 ng or more converted gDNA, PCR premixture (Enzynomics, Korea), 1 μL of 10 pmol/μL Primer-S, and 1 μL of 10 pmol/μL biotinylated-Primer-As. The amplification was carried out according to the general guidelines suggested by pyrosequencing: denaturation at 95°C for 10 min, followed by 45 cycles at 95°C for 30 s, at 60°C for 30 s, at 72°C for 30 s, and a final extension at 72°C for 5 min. The PCR (2 μL) was confirmed by electrophoresis in a 2% agarose gel and visualized using ethidium bromide staining. ssDNA template was prepared from 16 to 18 μL biotinylated PCR product using Streptavidin Sepharose® HP beads (Amersham Biosciences, Sweden) following the PSQ 96 sample preparation guide using multichannel pipettes. Fifteen picomoles of the respective sequencing primer were added for analysis. Sequencing was performed on a PyroMark ID system with the Pyro Gold Reagents kit (Qiagen) according to the manufacturer's instruction without further optimization. The methylation percentage was calculated by the average of the degree of methylation at three CpG sites formulated in pyrosequencing.
Statistical analysis
All methylation array data have been deposited in the National Center for Biotechnology Information GEO database under accession number GSE107226. The data were analyzed using SPSS v. 20.0. Differences in beta values between the IPF and the control groups were calculated using Student's t-tests, as described in the above section on methylation microarrays. The correlation between the intensities of the 178 DEGs in our previous publication (Lee et al., 2017) and beta values of CpG sites on the genes considered here was evaluated using Spearman's correlation analysis. p-Values <0.05 were considered statistically significant.
Results
Differences in global methylation pattern between IPF and control fibroblasts
Genome-wide aberrant DNA methylation of fibroblasts from eight IPF patients was compared with that of fibroblasts from four control patients. Clinical characteristics of the two groups were summarized in our previous publication (Lee et al., 2017) (Supplementary Table S1). Although there were no CpG loci passed the false-discovery rate (FDR) of <0.05, the beta values of all 485,577 loci on 20,621 genes were compared between IPF and control fibroblasts using Student's t-tests; 42,019 loci showed significant differences in methylation levels (p < 0.05). Among them, 5850 loci (1.2% of the total CpG) showed differences in delta-beta values >10.21 between the 2 groups (Fig. 1). The heat map showing hierarchical clustering of the 5850 differentially methylated loci (1.2% of the global CpG sites) on 2282 genes (11.06% of the total genes) showed a significantly different pattern of CpG methylation between the 2 groups (Fig. 2A). Among these, 4251 loci on 1731 genes were hypomethylated and 1599 loci on 725 genes were hypermethylated in the IPF relative to the control group (Fig. 2A).

Flowchart for analysis of differentially expressed genes and differentially methylated CpG loci in IPF and control fibroblasts. The expression value of each gene was determined by calculating differences by perfect match intensity minus mismatch intensity of the probe pairs in use, and genes showing detection call p-values <0.01 were discarded to reduce the number of false positives, and the remaining 15,020 genes were analyzed. IPF, idiopathic pulmonary fibrosis.

Heat map of 5850 differentially methylated CpG loci and their distribution in gene regions.
Gene bodies were the preferential sites of hypomethylated and hypermethylated CpGs, followed by intergenic regions, promoters, and 3′UTR regions (Fig. 2B, C). On the promoters, both hypomethylated and hypermethylated CpGs were most preferentially located on the TSS1500, followed by 5′UTR, TSS200, and the first exon (Fig. 2B, C). In and around CpG islands, both hypomethylated and hypermethylated CpGs were most preferentially located on shore regions (within the 2 kbp flanking the CpG islands), followed by CpG islands and shelf regions (within the 2 kbp flanking the shores) (Fig. 2B, C).
Correlation between DNA methylation and mRNA expression levels
Promoter regions were divided into two mutually exclusive bins of 1- to 200-bp (TSS200) and 200- to 1500-bp blocks (TSS1500) upstream of the transcription start site. Here, 1950 CpG loci on the regions distal from 3′UTR to TSS1500 were regarded as intergenic CpG and excluded from the analysis. To find the genes whose expression may be affected by CpG methylation, we compared 2282 genes having DM 3900 CpG loci in common with the 178 DEGs and found 39 overlapping genes. Among 92 CpG on the 39 genes, beta values of 80 CpGs on 34 genes were significantly correlated with mRNA expression levels in 12 fibroblasts (p < 0.05) (Supplementary Table S2). The 80 loci constituted 2.05% of 3900 DM CpG loci, and the 34 genes constituted 1.2% of 2822 genes having DM CpGs and 19.1% of the 178 DEGs between the IPF and the control groups (Fig. 1).
The 80 loci on 34 genes comprised 20 hypermethylated CpG sites on 6 downregulated genes, 16 hypomethylated CpG sites on 7 downregulated genes, 34 hypomethylated CpG sites on 16 upregulated genes, and 10 hypermethylated CpG sites on 5 upregulated genes (Table 1 and Supplementary Table S2). The numbers of CpG sites on each of the 34 genes ranged from 13 CpG loci on PRDM8 to 1 CpG locus on each of 20 genes. TMTC1 and CADM1 had both hypomethylated and hypermethylated loci on each gene (Supplementary Table S2). The 80 CpG methylation loci were located most frequently on the gene body (50%), followed by the proximal promoter region (TSS1500/TSS200/5′UTR/first exon, 45%) and 3′UTR (5%). In and around the CpG islands, shores were the most preferential region (25%), followed by CpG islands (12.5%) and shelves (8.75%) (Table 1 and Supplementary Table S2). 91.67% of 36 differentially methylated CpGs (DMCs) on gene promoter had negative correlations between gene expression and CpG methylation levels, whereas 47.5% of 40 CpGs on gene body had negative correlations. These data suggest that gene expression may be more downregulated by the methylations of CpGs on promoter compared with those of gene body (Supplementary Table S3).
Genes Showing a Significant Correlation Between Transcriptome and Methylation Levels in All Study Subjects (n = 12) and Distribution of Methylation Loci
Hypomethylation and hypermethylation loci were concomitantly observed in the same gene.
Ontology and pathway analysis of differentially methylated genes between IPF fibroblasts and controls
GO enrichment analysis was conducted for the 34 DEGs. The observed gene numbers were significantly higher than those expected by chance in nine ontology categories: cellular response to osmotic stress, sprouting angiogenesis, transcription factor complex, Wnt signaling pathway, and apoptotic process (Fig. 3, p < 0.05; Supplementary Table S4). Pathway enrichment analysis identified significant enrichment in the “long-term depression,” “arrhythmogenic right ventricular cardiomyopathy (ARVC),” and “pathway in cancer” pathways (Supplementary Table S4).
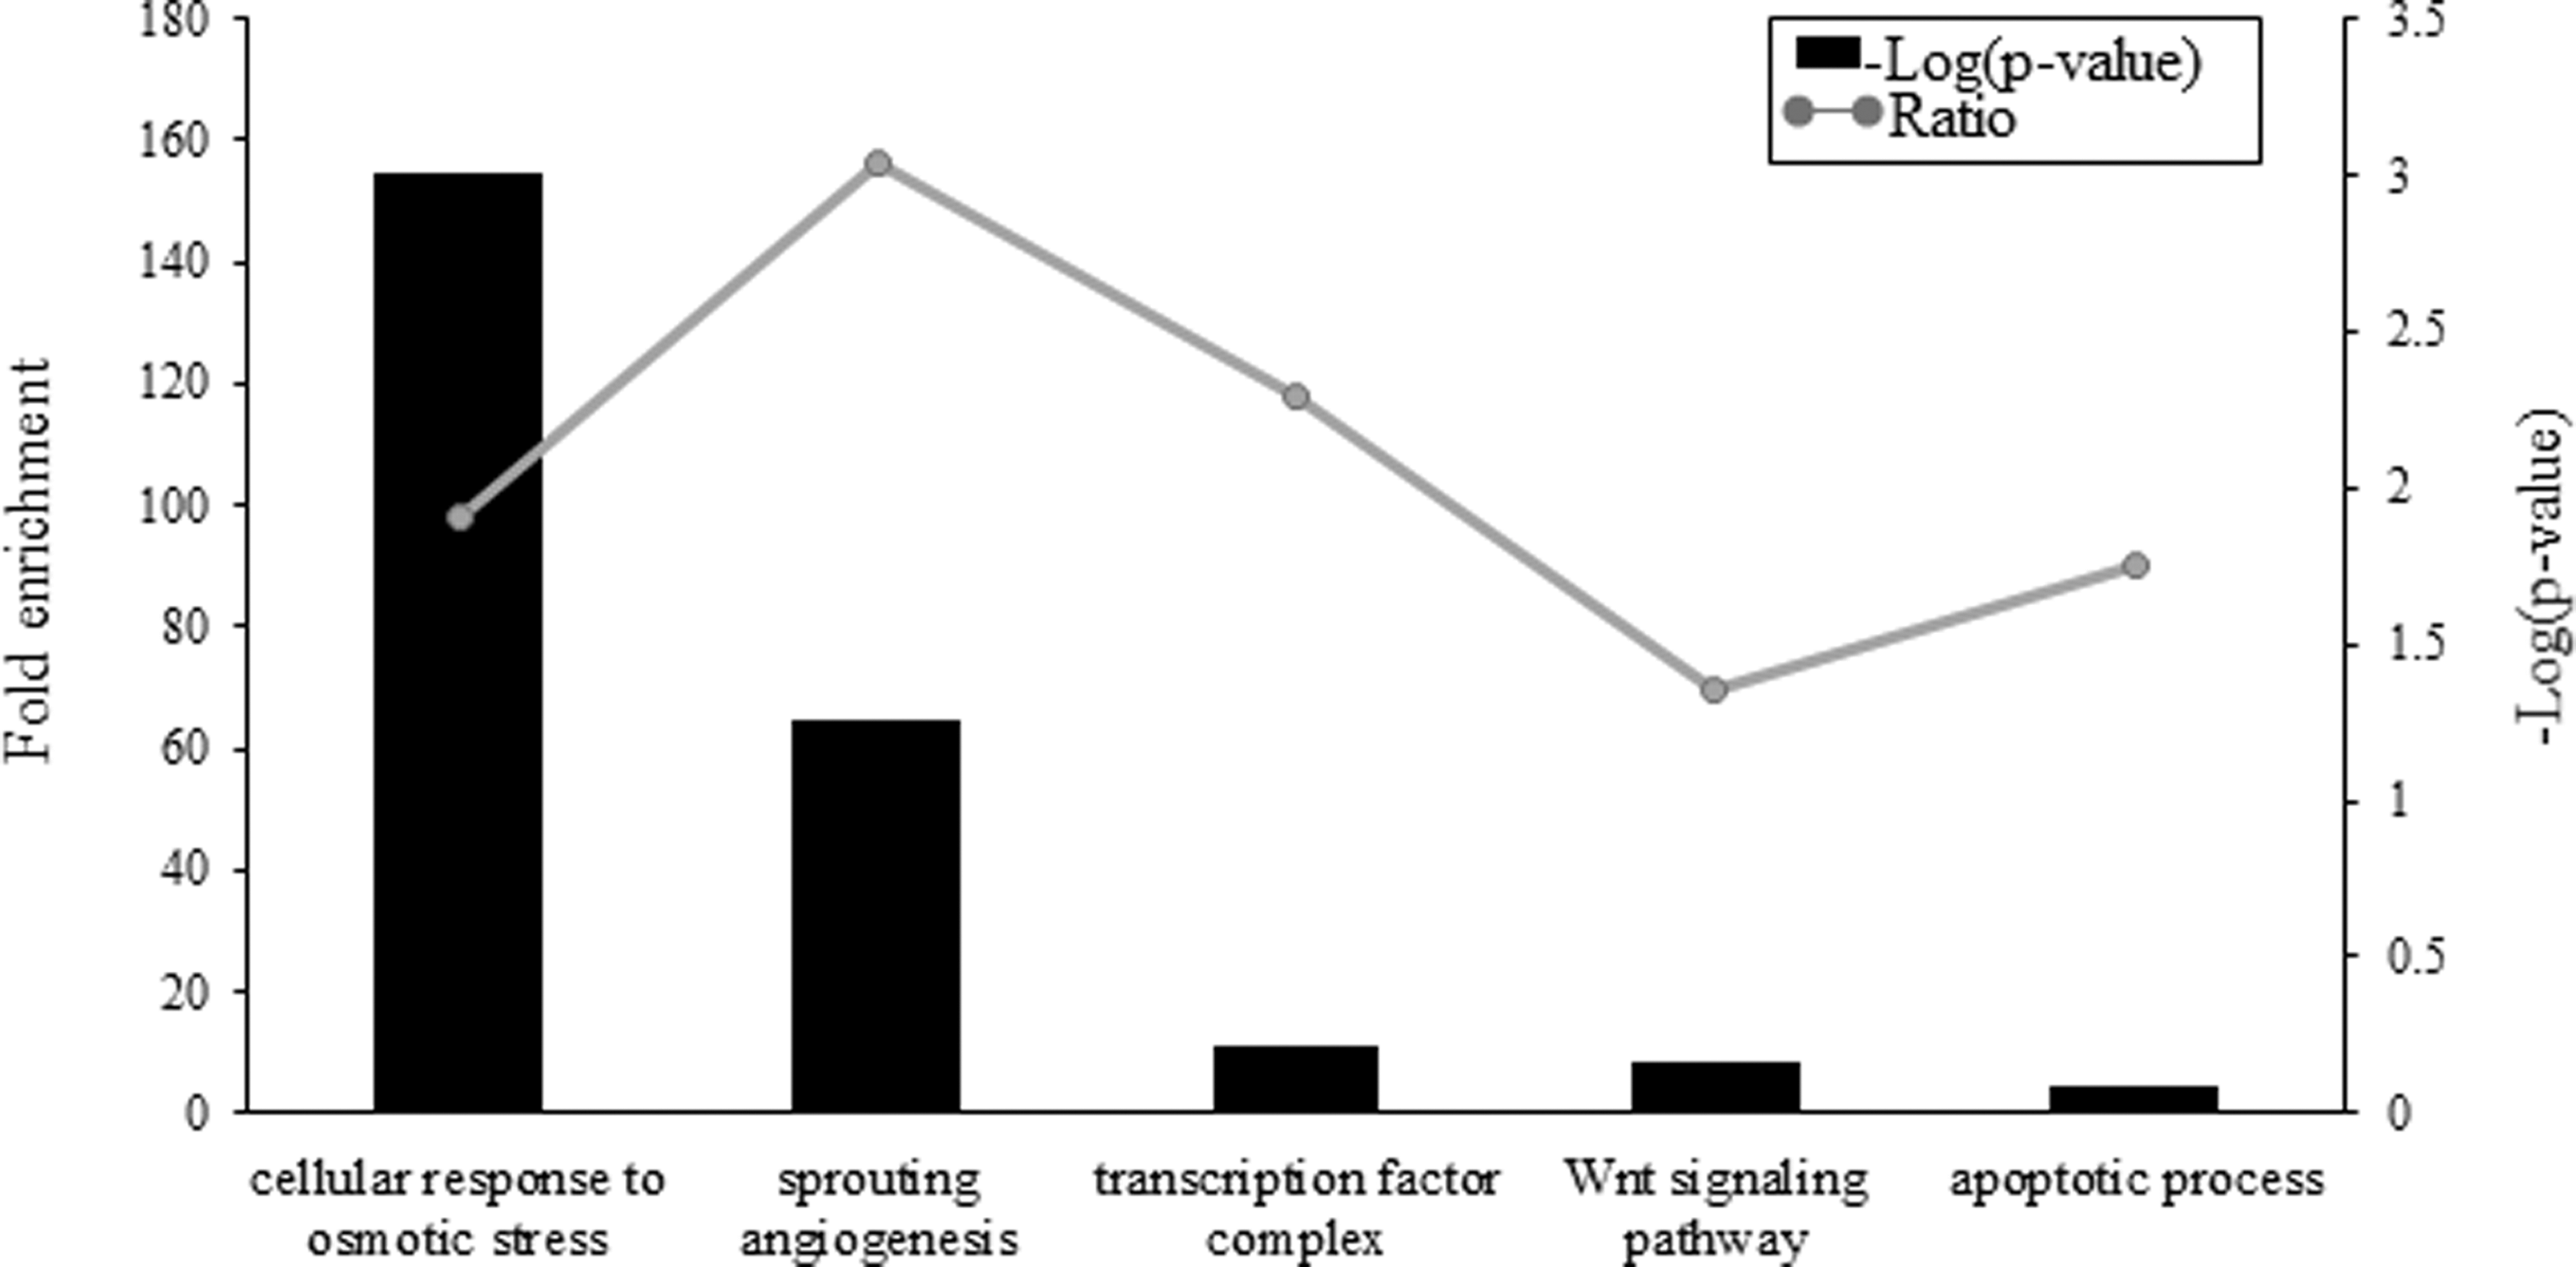
Ontology and pathway analysis of 34 differentially expressed genes with differentially methylated CpG loci between IPF fibroblasts and controls.
Correlation between methylation and transcriptome levels of S100A4
Among the 34 genes having the significant correlation between the levels of methylation and those of gene expression on the chip studies, S100A4 was selected as a candidate gene for function validation. DNA CpG methylation levels was measured on three CpG sites (cg13091627, cg18273417, and cg24691453) of the promoter using pyrosequencing of DNAs obtained from the 10 control fibroblasts and the 14 IPF fibroblasts. Pyrosequencing data of 3 CpG sites (cg13091627, cg18273417, and cg24691453) of DNA from 10 controls and 14 IPF fibroblasts were presented in Supplementary Figure S1. As demonstrated in Figure 4, the levels of CpG methylation was significantly lower in IPF compared with those of normal controls (cg13091627: 53.94% ± 25.4% vs. 87.3% ± 20.3%, p = 0.0008; cg18273417: 45.9% ± 23.5% vs. 87.7% ± 21.6%, p = 0.0005; cg24691453: 27.5% ± 19.3% vs. 68.4% ± 18.8%, p = 0.0003) (Fig. 4). In addition, each the CpG methylation levels was significantly correlated with S100A4 gene expression levels of the transcriptome study in each of three CpG loci (cg13091627: r = −0.825, p = 0.001; cg18273417: r = −0.755, p = 0.005; cg24691453: r = −0.783, p = 0.003) (Fig. 5).
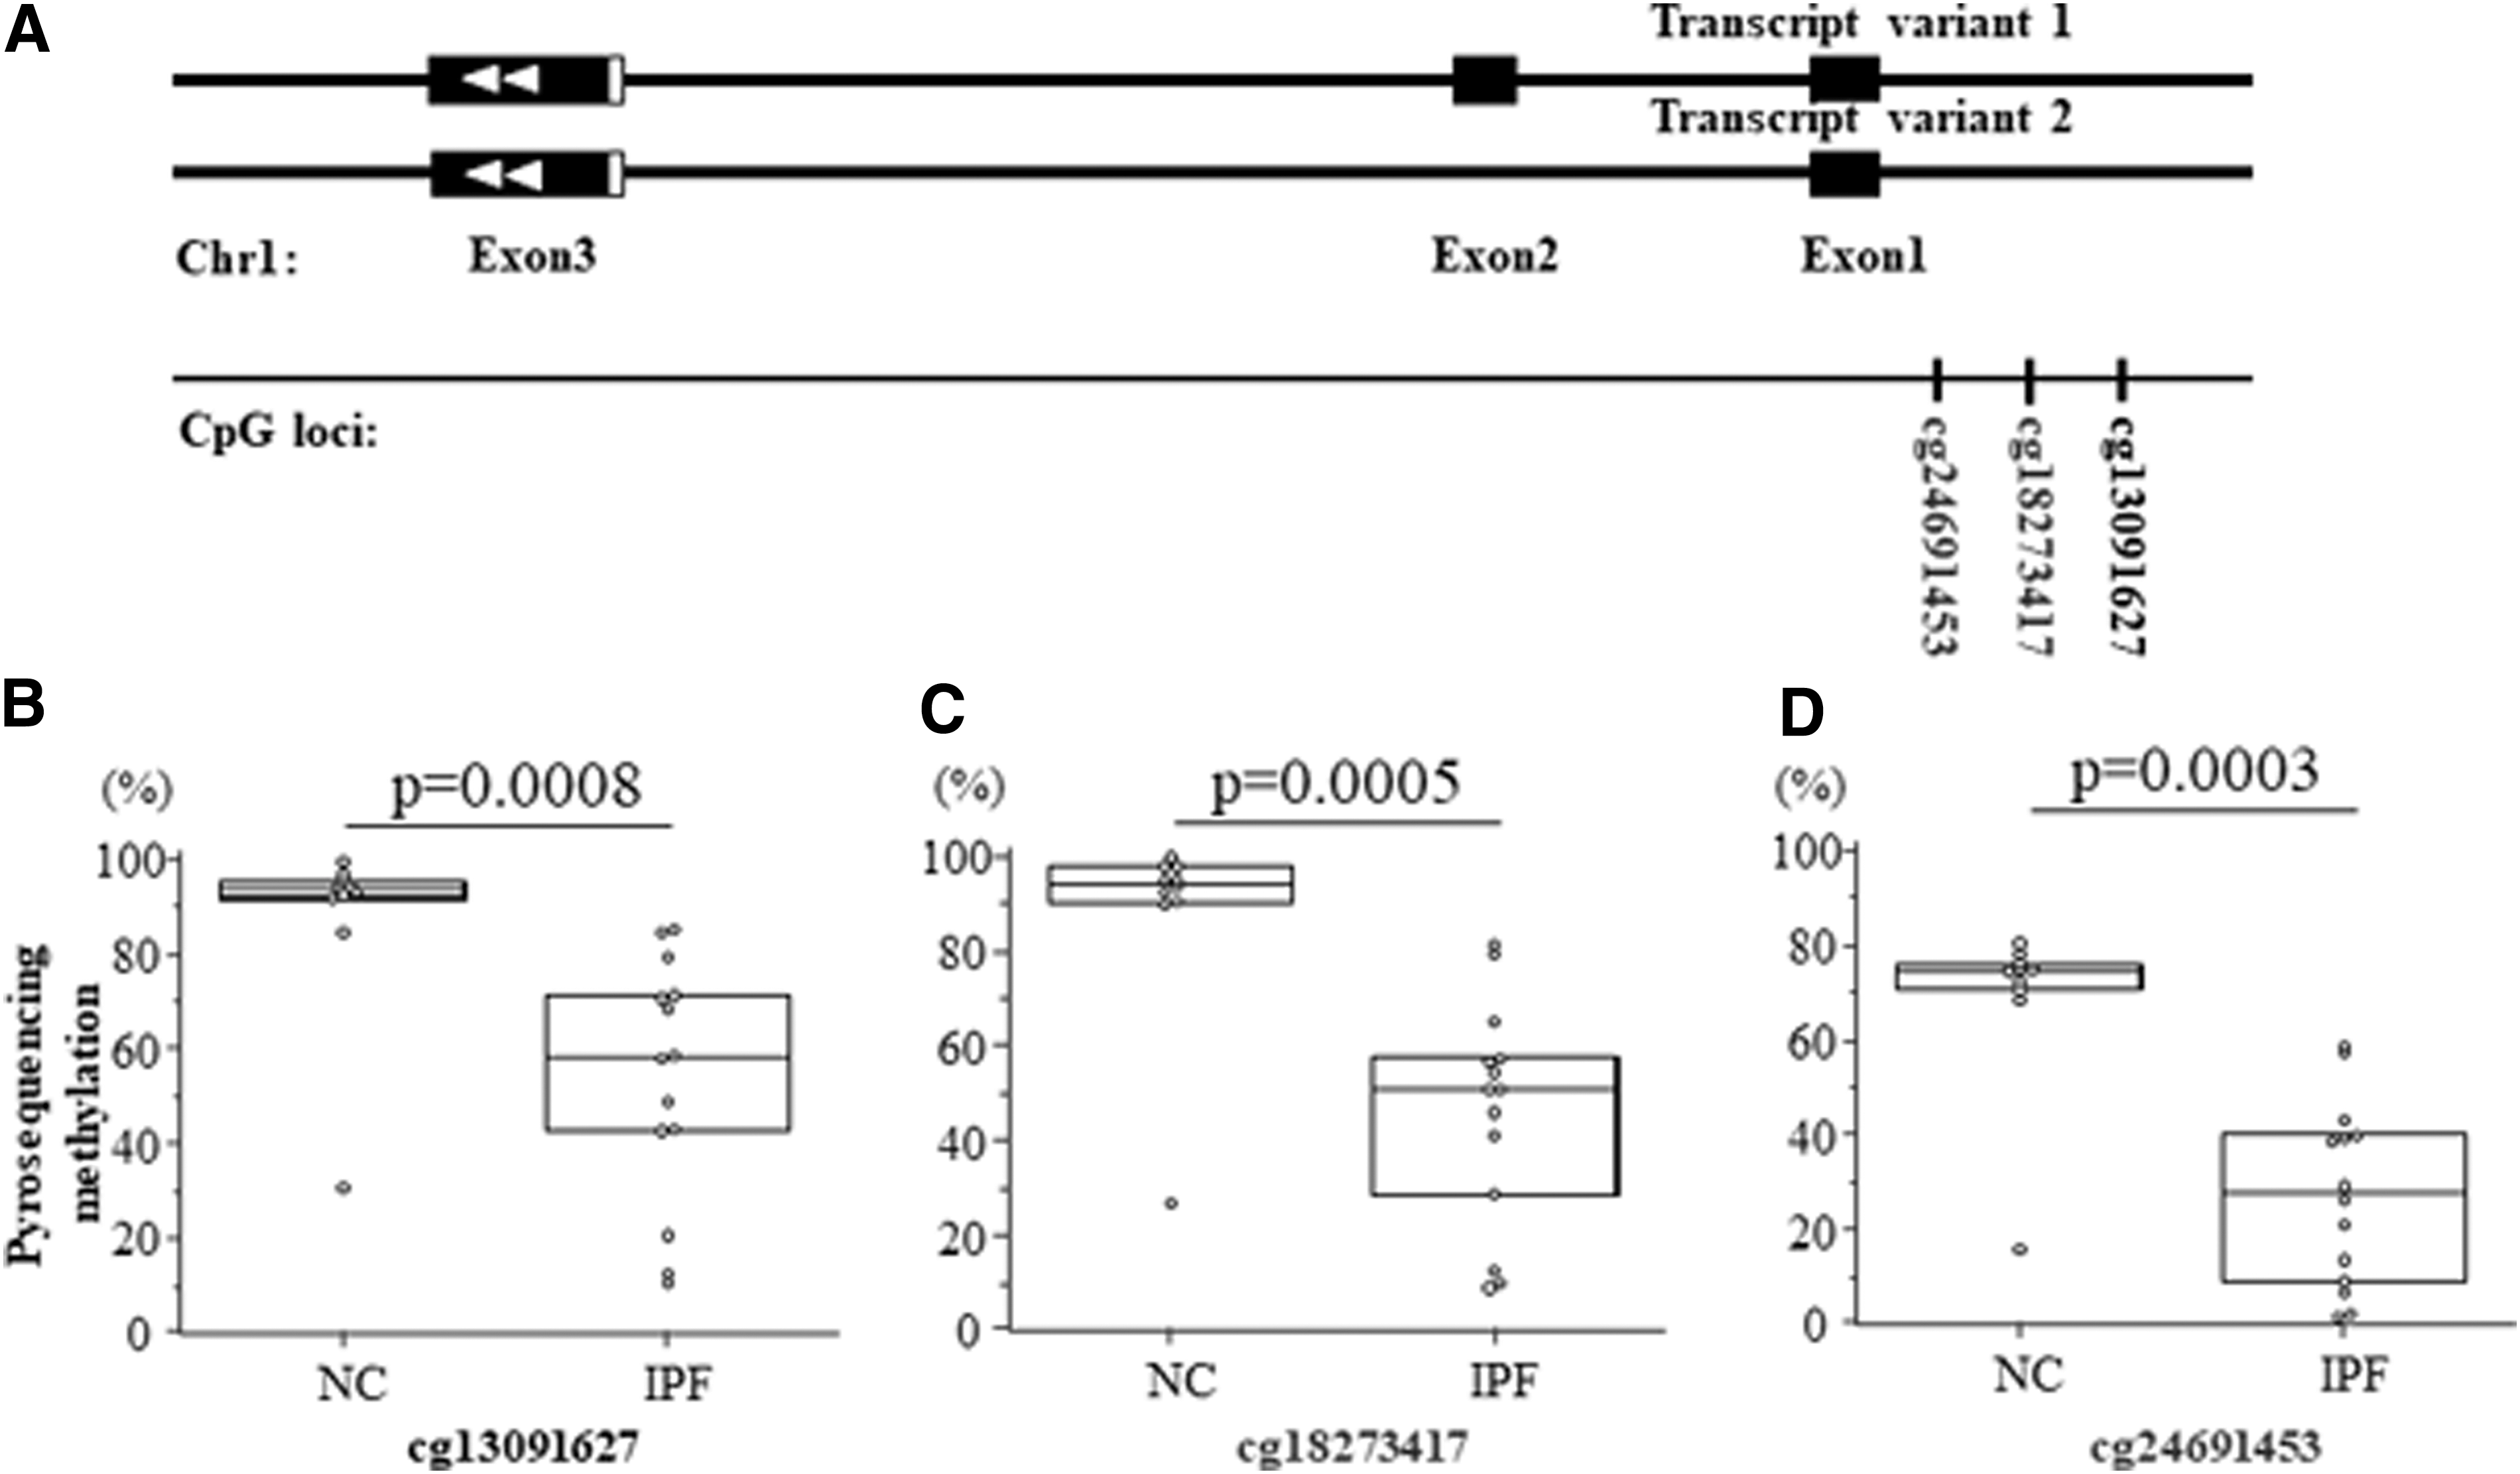
Comparison of methylation levels on three CpG sites of S100A4 between IPF (n = 14) and control fibroblasts (n = 10).
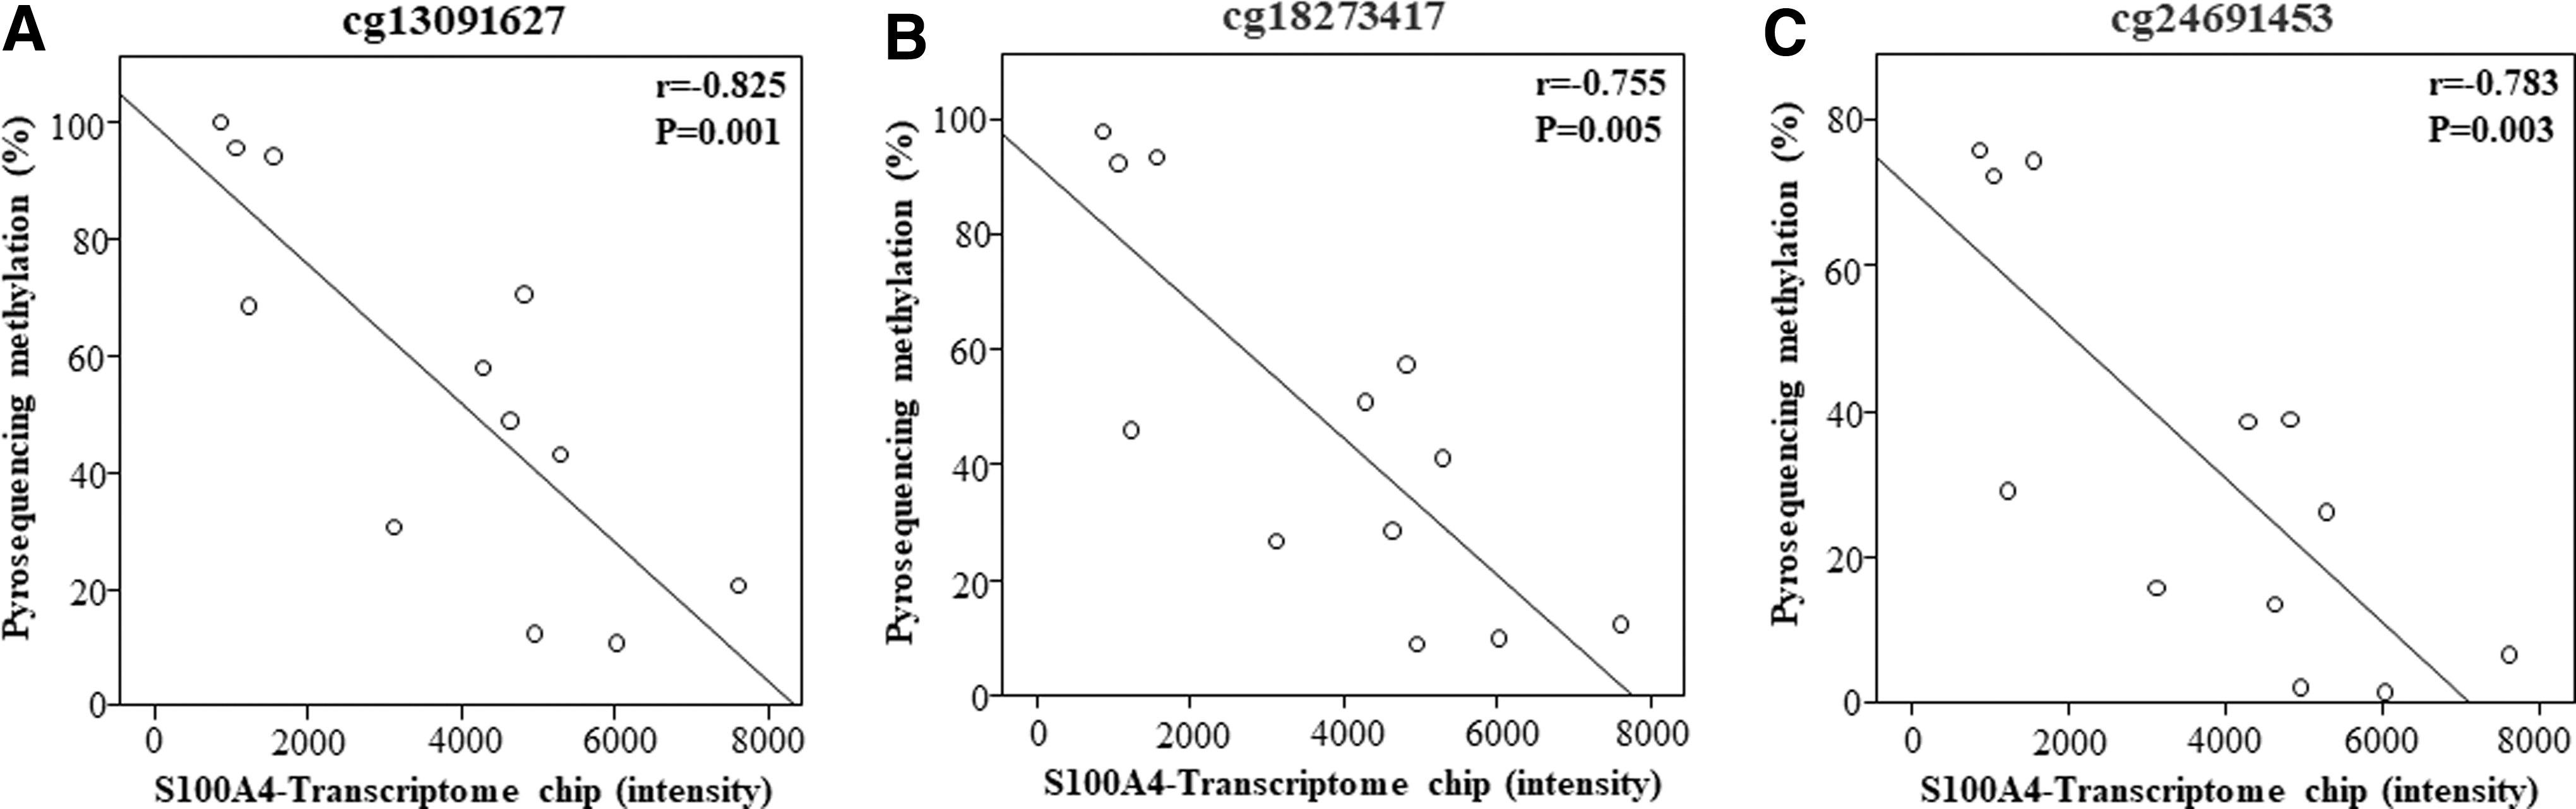
Correlation between CpG methylation levels of three CpG loci
Discussion
IPF is a chronic devastating disease, in which transforming growth factor-beta–induced disturbances of the homeostatic microenvironment are critical to promote cell activation, migration, invasion, or hyperplastic changes (Fernandez and Eickelberg, 2012). Environmental triggers such as cigarette smoke, metal dust, occupational dust, chemical fumes, and microbial agents may effects the gene expression, which are associated with the development of IPF. These triggers are capable of inducing innate and adaptive immune responses via genetic or epigenetic mechanisms (Hoebe et al., 2004). Similar target tissue composition is mandatory because transcriptomes and epigenetic markers are cell-type specific. In fact, the characteristic pathology of typical interstitial pneumonia comprises mixed features, including normal lung tissue, alveolar inflammation, honeycomb changes, and interstitial fibrosis (Kim et al., 2006). Among the various cell types present in the lung tissue, fibroblasts are major effector cell responsible for fibroproliferation (Huang et al., 2008), and the biological properties of IPF fibroblasts differ from those of normal lung fibroblasts (Marchand-Adam et al., 2006; King et al., 2011). Accordingly, we selectively separated the homogeneous fibroblast cells from diseased lungs. However, epigenetic mechanisms are affected by different culture passages of fibroblast because that can have different methylation phenotypes (Shmookler Reis and Goldstein, 1982; Koch et al., 2011; Huang et al., 2014). Therefore, in the current study, all samples were generated from cells at the fifth-passage fibroblasts.
In the present study, 5850 of 485,577 CpG loci (1.2%) showed significant changes in CpG methylation in 2282 genes (12.06% of the total genes studied) in IPF fibroblasts compared with controls. When compared with the 178 DEGs, 34 genes (containing 80 CpG sites) were overlapping. Thus, to the best of our knowledge, these data quantitatively indicate for the first time that about 19.1% (34 genes/178 DEGs) may be affected by a relatively small proportion of DM CpG loci (80 CpG sites/5850 CpG sites: 1.36%) in fibroblasts derived from IPF lung tissues. A few studies have examined the relationship between gene expression and CpG methylation levels using lung tissues. In a study of 12 IPF and 7 control lung tissues considering 270,000 CpG sites, 373 genes were differentially expressed and 870 genes were differentially methylated. Among them, 35 DEGs (9.4%) were correlated with 4% of 870 differentially methylated genes (DMGs) (Sanders et al., 2012). This result is in a good agreement with ours, although the samples differed between the studies. Recently, in a study using a large number of lung tissues (94 IPF fibroblasts and 67 controls), 738 DEGs showed good correlations with levels of CpG methylation (Sanders et al., 2012; Yang et al., 2014). This number is much higher than ours, which may reflect the differing numbers of CpG sites on the methylation chips used in the two studies (485,577 vs. 4,600,000 CpG sites in our study vs. the earlier one).
Among the 34 DMGs in the present study, FGF7, S100A4, TFPI, LEF1, and TRPV4 are associated with the risk of IPF (Fujii et al., 2000; Lawson et al., 2005; Marchand-Adam et al., 2005; Konigshoff et al., 2008; Rahaman et al., 2014), and CREG1, FBN2, and CADM1 are involved in the process of fibrosis (Bian et al., 2009; Szauter et al., 2010; Cao et al., 2017). The roles of the other 26 genes have not been recognized in relation with the mechanism of pulmonary fibrosis (Supplementary Table S5). Thus, about three-fourths of the DMGs have not been revealed in relation with IPF up to date. Ontology analysis of the 34 DMGs demonstrated the involvement of 24 genes in Wnt signaling pathway, epithelial-to-mesenchymal transition, adherens junction organization, apoptotic process, sprouting angiogenesis, cellular response to osmotic stress, embryonic limb morphogenesis, neural crest cell migration, actin cytoskeleton reorganization, transcription factor complex, neuron projection, protein kinase C binding, and actin binding.
In the present study, we compared the 178 DEGs between IPF and normal controls with 2282 genes having DMC. Among the 178 DEGs, 39 genes were present in the 2282 genes having DMC. Thus, 139 DMGs may not be regulated by CpGs but may be regulated by the other mechanisms such as single nucleotide polymorphisms (SNPs), miRNA, or chromatin remodeling. According to the SNPs database dbSNP, 95 genes of the 139 DEGs have common SNPs (>5%). Additionally, when compared with the 16 ontology categories of the 178 DEGs in our study (Lee et al., 2017), the genes (PTGS2 and RGCC) in the fibroblast growth factor production category are not included among the 34 DMGs. This indicates that the process of fibroblast growth factor production and regulation may be independent of CpG methylation regulation, whereas the other processes, such as positive regulation of cell migration, movement receptor binding, and cell adhesion molecule binding, may be regulated by CpG methylation. However, network analysis reveals that, in the present study, FGF7 and PTHLH interacted with FGFR1, 2, and 3, which serve as receptors for fibroblast growth and proliferation (Supplementary Fig. S2).
According to the SNPs database dbSNP, 559 of 5850 CpG loci (9.56%) on the HumanMethylation 450 array are annotated for the known SNPs. Among the 80 DM CpG loci between IPF and control fibroblasts, 13 (16.25%) were annotated for SNPs (Supplementary Table S2). Thus, the CpG sequence can be changed to GG, GC, or CC, which are not sites of DNA methylation. However, the correlation analysis of beta values for methylation of 80 CpGs with gene expression intensities of 34 genes on the transcriptome revealed no difference in the correlation between the SNP-annotated and SNP-unannotated CpGs. This suggests that the SNPs on CpG sites may reflect a bias in the gene expression of DMGs.
In the present study, we used the HumanMethylation 450 BeadChip (Methylation450 BeadChip) to quantitatively analyze 485,577 CpG sites in 8 IPF samples and 4 comparable normal tissues. HumanMethylation 450 array was designed to analyze CpG sites that are near gene promoters (14.87% of probes) and gene body (3.99% of probes), which are located within CpG islands. In the present study, 5850 sites among 485,577 CpG sites (1.2%) were differentially methylated. This rate is comparable to the result of Huang et al. (2014) using fibroblasts from six patients with IPF and three controls. In their study, 787 of 27,568 CpG sites were differentially methylated (2.8% of all CpG sites). Among the 787 sites, 9 CpGs (1.14%) were overlapped with the 5850 CpGs of the ours study as shown in the following figure. This disagreement may be due to the small numbers of fibroblasts used in each of the two studies in addition to the phenotypic changes of fibroblasts during the culture passage, racial difference, and disease severity. Another study using a different method to measure methyl-binding protein-bound CpGs (237,000 total methyl CpGs), 625 CpG islands of 27,639CpG islands were DM (2.2%) (Rabinovich et al., 2012). Thus, 1–3% of DNA CpG sites may be methylated in association with the risk of IPF via regulation of gene expression. Among the 80 loci on 34 genes, about 60% (21 genes) were upregulated, and the others were downregulated. In the upregulated genes, 34 hypomethylated CpG sites on 16 genes may contribute to increased gene expression, and expression of 5 genes may be increased by 10 hypermethylated CpG sites. Hypomethylation is a well-known mechanism for increased gene expression. Notably, not all the differences in gene expression were directionally opposite to the differences in methylation, suggesting that further studies are needed to determine how differences in individual gene expression may be affected by hypermethylation or hypomethylation.
Our study has several limitations. Because parenchymal lung fibroblasts are typically obtained from surgical lung biopsy, which is an invasive procedure, this study was based on a relatively small number of samples. The variability among samples may obscure important methylation differences. There is significant variability in DNA methylation among individual IPF cell lines, suggesting that differences in DNA methylation may contribute to fibroblast heterogeneity among patients with IPF. In addition, it is well known that microenvironment alters epigenetic and gene expression profiles, especially in tumors and experimental cell lines (Hamm et al., 2010; Dawson et al., 2012; Ciccarone et al., 2018). Accordingly, DNA methylation may vary in the culture fibroblasts of the present study from the freshly isolated ones.
In the present study, the variability of DNA methylation at 5850 CpG sites ranged from 0.1 to 0.85; this variability was comparable between the IPF and control fibroblasts (0.02–0.97 vs. 0.01–0.98, respectively). Furthermore, differences in DNA methylation between fibroblasts are known to be stable throughout multiple cell passages (Huang et al., 2014). Another limitation is that the initial statistical analysis might benefit from a more stringent FDR. We applied a less stringent “delta-beta cutoff with a nonstringent p-value cutoff” approach, a statistical paradigm that has been validated in DNA methylation microarray studies (Cheong et al., 2011; Li et al., 2017). Another limitation is differences in the gender ratio between the groups; the IPF fibroblasts in our study came equally from males and females, whereas our normal control fibroblasts were mostly from female subjects. One of the 38 DM genes (Dachshund homolog 2, DACH2) is located on the X chromosomes. Thus, the difference in gender might be a minimal confounding factor in the present study.
Conclusion
In the present study, we evaluated the relationship of CpG methylation to the 178 DEGs using 8 IPF fibroblasts and 4 controls. Among 485,577 loci, 5850 loci on 2282 genes showed significant difference between the 2 groups. Among these, beta values of 80 CpGs showed significant correlations with the mRNA expression of 34 genes. One-third of the 34 genes have been recognized as being involved in the process of fibrosis. GO enrichment included cell adhesion, molecule binding, chemical homeostasis, surfactant homeostasis, and receptor binding categories. They provide insight into epigenetic changes in IPF lungs and identify novel genes responsible for the pathogenesis of IPF.
Declaration
Consent for publication
All authors have read and approved the submission of article.
Footnotes
Acknowledgments
This study was supported by a grant from the National Research Foundation of Korea (NRF) funded by the Ministry of Education (2017R1D1A1B0429365) and a research grant from Soonchunhyang University to J.-S.P. The samples were generously provided by a Biobank in Soonchunhyang University, Bucheon Hospital. J.-U.L. was supported by the Basic Science Research Program of NRF (2018R1A6A3A01011004).
Disclosure Statement
No competing financial interests exist.
Supplementary Material
Supplementary Figure S1
Supplementary Figure S2
Supplementary Table S1
Supplementary Table S2
Supplementary Table S3
Supplementary Table S4
Supplementary Table S5
References
Supplementary Material
Please find the following supplemental material available below.
For Open Access articles published under a Creative Commons License, all supplemental material carries the same license as the article it is associated with.
For non-Open Access articles published, all supplemental material carries a non-exclusive license, and permission requests for re-use of supplemental material or any part of supplemental material shall be sent directly to the copyright owner as specified in the copyright notice associated with the article.