
Abstract
Integrated analysis of accumulated data is an effective way to obtain reliable potential diagnostic molecular in gastric cancer (GC). The study aimed to identify potential lncRNAs associated with the pathogenesis and prognosis in GC. Raw noncoding RNA microarray data (GSE53137, GSE95667, and GSE111762) was downloaded from Gene Expression Omnibus (GEO) database. Differentially expressed genes between GC and adjacent normal gastric tissue samples were screened by an integrated analysis of multiple gene expression profile after gene reannotation and batch normalization. Differentially expressed genes were further confirmed by the cancer genome atlas (TCGA) database. Competing endogenous RNA (ceRNA) network, survival analysis, and gene set enrichment analysis (GSEA) were extensively applied to identify hub lncRNAs and discover potential biomarkers related to diagnosis and prognosis of GC. qPCR was applied to confirm hub lncRNA expression levels in GC tissues. In total, 17 integrated differential lncRNAs were obtained after intersections of differential genes between GEO and TCGA database. Four lncRNAs (HMGA1P4, UBE2Q1-AS1, MAGI2-AS3, MIR22HG) concentrated in ceRNA network were validated by qPCR in GC tissues, which were consistent with informatics results. The clinicopathological association revealed that four lncRNAs might be effective in GC progression. Further study revealed that GC patients with lower MAGI2-AS3 expression was evidently longer than those with higher MAGI2-AS3 expression (p = 0.015). Multivariate analysis revealed MAGI2-AS3 was independently associated with overall survival in GC. GSEA showed GC samples were differentially enriched in pyrimidine metabolism, RNA degradation, cell cycle, oxidative phosphorylation etc., and most significantly enriched in ribosome pathway in MAGI2-AS3 low expression phenotype. Four lncRNAs, including HMGA1P4, UBE2Q1-AS1, MAGI2-AS3, and MIR22HG may contribute to GC development, and MAGI2-AS3 might be associated with the prognosis of GC.
Introduction
Gastric cancer (GC), one of the prevalent digestive cancers, is the second leading cause of cancer mortality worldwide until 2018 (Bray et al., 2018). Owing to lack of specific symptoms in the early stage, most patients with GC are at advanced stage when diagnosed, which has a significant impact on the 5-year survival rate of patients. With the advances in medicine and life science, the improvements in diagnosis and treatment are beginning to save the lives of many GC patients, but they do not yet meet the needs for earlier diagnosis and longer survival time. Therefore, it is essential to understand the mechanisms of GC progression for tumorigenesis prevention, pharmacy guidance, and prognosis indication or survival rate improvement.
lncRNAs, one member of noncoding RNAs family, are longer than 200 nts in length and have limited protein-coding ability (Ponting et al., 2009; de Oliveira et al., 2019). Growing evidence showed that aberrantly expressed lncRNAs are implicated in GC tumorigenesis and progression, and these lncRNAs include ELIT-1 (Sakai et al., 2019), MACC1-AS1 (He et al., 2019), FOXD2-AS1 (Xu et al., 2018), etc. Due to the length and unusual base-pairing strategies, lncRNAs exhibit specific regulatory roles in cancer. The well-studied functions of lncRNAs include sequence-specific recruitment of proteins, competing endogenous RNA (ceRNA) regulation and molecular scaffolding of protein complexes. ceRNA hypothesis, which describes lncRNAs acting as endogenous molecular sponges to modulate mRNAs expression by competitively binding miRNAs through shared miRNA response elements, was first introduced by Salmena et al. (2011). ceRNA network shows a powerful way to functionalize lncRNAs and provides an opportunity to reveal lncRNAs' functions in cancer. The literature has demonstrated that dysregulated expressions of lncRNAs were involved in tumorigenesis and progress through affecting ceRNA network. For example, HOTAIR can function as ceRNA to regulate HER2 expression by sponging miR-331-3p (Liu et al., 2014), and GCRL1-mediated gastric malignancy through miRNA-885-3p and CDK4 in GC (Lin et al., 2018). There is growing amount of relevant evidence to highlight the importance of studying the ceRNA network and it offers a strong rationale for lncRNAs' functions study in GC.
Although these lncRNAs were detected and demonstrated important biological effects in GC, the number and roles of lncRNAs in GC may only be a tip of the iceberg. The present study aimed to identify novel lncRNAs and elucidate the potential functions of lncRNAs associated with GC. In our previous study, lncRNA expression data of GC and normal tissues acquired from public repositories was used to obtain differentially expressed lncRNAs after gene reannotation and batch normalization, and selected three lncRNAs from ceRNA network (Zhang et al., 2019). However, we found that discrepancy still exist even after batch normalization. Thus, we hypothesized that the gene heterogeneity might be reduced if different datasets are performed on the same platform. For this reason, the datasets belonging to GPL15134 (a platform that specifically applied to identify lncRNAs) were downloaded for analysis in this study. Then, the hub lncRNAs were selected from ceRNA network and further sent for investigation of their distributions in different GC clinical features and their correlations with overall survival using RNA sequencing profile from the cancer genome atlas (TCGA). Finally, to confirm the reliability and validity of the results by bioinformatics analysis, four key lncRNA expression levels were checked in 18 diagnosed tumor tissues and adjacent normal tissues using qPCR method. Overall, the present study showed the GC-specific lncRNA expression patterns and a ceRNA network in GC. Clinical features related to GC-specific lncRNAs also suggested these lncRNAs are worthwhile for further study, especially MAGI2-AS3 might be associated with the prognosis of GC.
Materials and Methods
Microarray datasets
All microarray datasets in this study were required from Gene Expression Omnibus (GEO). Studies from GEO database were considered eligible according to the following criteria: (1) Studies with GC tissue samples. (2) Studies with information of technology and platform utilized for studies. (3) Studies belonged to platform GPL15134. According to these criteria, three datasets of GC were downloaded from the GEO repository. The details of each microarray study [GSE53137, GSE95667, and GSE111762], including sample descriptions, are provided in Table 1. The gastric cancer RNA expression profiles and corresponding patient clinical information were downloaded from data portal of TCGA project. The detailed information of GC patients in TCGA is shown in Table 2. Our workflow for bioinformatics analysis of publicly available datasets from both GEO and TCGA databases is illustrated in Figure 1.
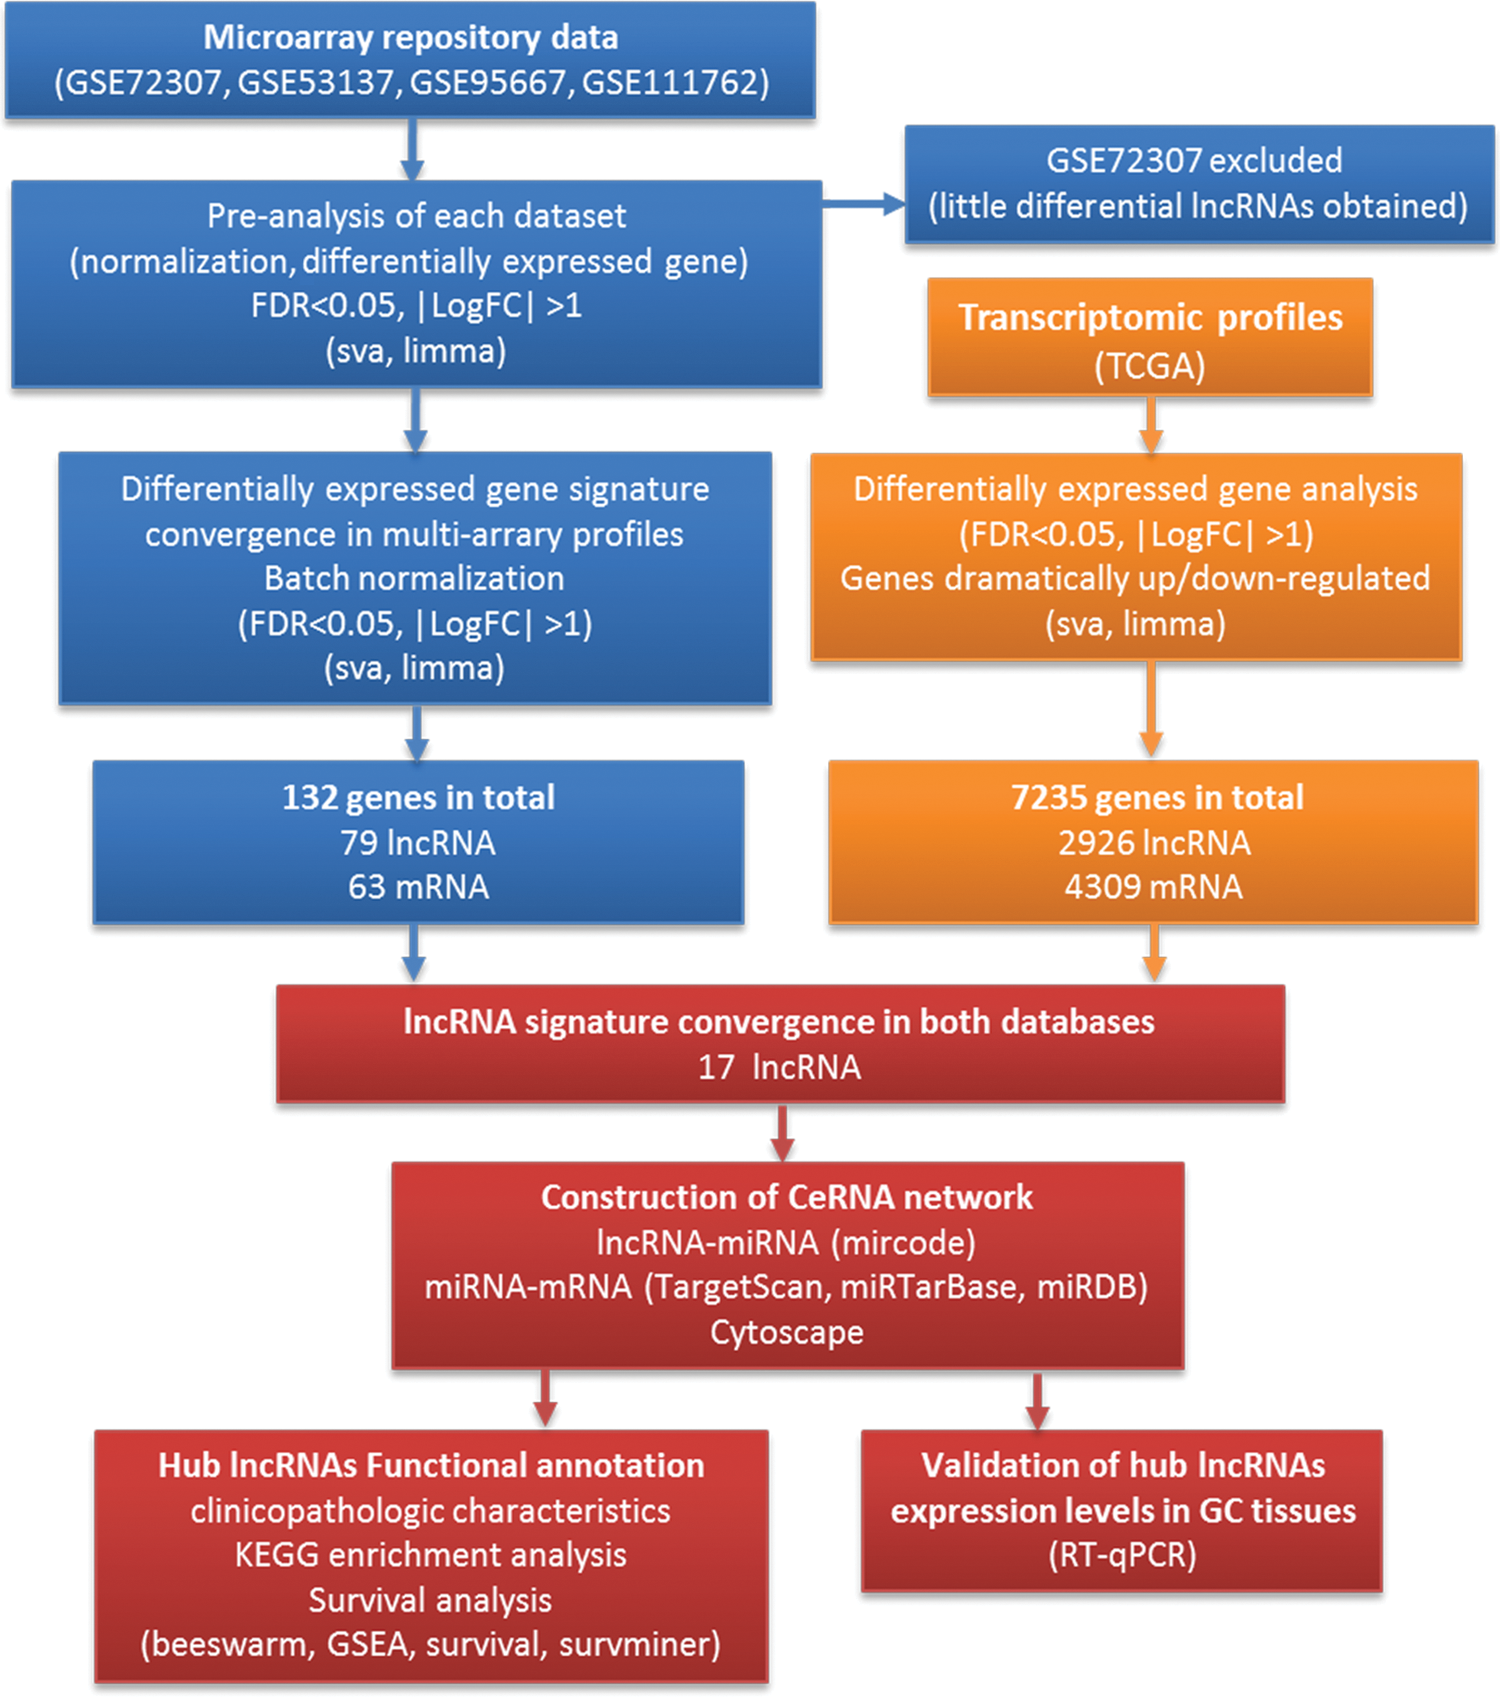
Flowchart of this study. Color images are available online.
Details of Gastric Cancer Studies in Gene Expression Omnibus Database
This dataset was used in our previous study (Zhang et al., 2019).
The Clinical Information of Gastric Cancer Patients in the Cancer Genome Atlas Database
Integration of microarray data and differential expression analysis
Study indicated that reanalysis of microarray probes could facilitate the discovery of new transcripts' expression data (de Groot et al., 2014). To obtain both lncRNA and mRNA expression profiles, first we performed a probe reannotation pipeline described in our previous study (Zhang et al., 2019). Then, GEO datasets were often based on different platforms, and samples were processed on different days, by different groups even by different people, we integrated all samples from the three datasets to improve the number of samples (19 tumor samples and 16 normal samples). Batch normalization was applied to generate less reliable results by using sva and limma R package. Next, we performed gene differential analysis (|LogFC| > 1, adjusted p-value <0.05) by comparing tumor tissues with normal tissues using limma R package. The integrated dysregulated gene lists were saved for subsequent analysis.
Construction of ceRNA network
LncRNA-miRNA interaction pairs were predicted using the miRcode database miRNA-mRNA interactions were obtained from three reliable online miRNA-target databases: miRDB, TargetScan 7.2, and miRTarBase. The genes existing in at least two databases were considered as miRNA targets. Comparing predicted miRNA target genes with the dysregulated mRNAs in GEO GC samples, only the remaining overlapping mRNAs and their interaction pairs were used for ceRNA network construct. Visualization of the ceRNA network was performed by Cytoscape software.
Overall survival analysis
After combining the overall survival of patients with GC in the TCGA, the survival R package was used to generate the Kaplan–Meier survival curves to identify the prognostic lncRNAs. LncRNAs screened in ceRNA network were classified into two groups (high expression or low expression) using median expression levels.
Tissue collection and qPCR
A total of 18 GC and paired adjacent normal tissue samples were acquired from patients who had been diagnosed with GC by pathological assessment of tissue biopsy and undergone surgeries at the First Affiliated Hospital of Chongqing Medical University. No radiotherapy or chemotherapy was performed before tissue collection. Informed consents were obtained from all participating patients. The study was approved by the Research Ethics Committee of Chongqing Medical University.
Total RNA was isolated using a TRIzol reagent (TIANGEN, Beijing, China), according to the manufacturer's instruction. cDNA reverse transcription, and qPCR were performed under the instructions of the PrimeScript™ RT Reagent Kit with gDNA Eraser (TaKaRa, Dalian, China) and TB Green® Premix Ex Taq™ II (TaKaRa). The relative expression levels were calculated using the 2−ΔΔCT method. GAPDH was used as internal reference. All reactions were conducted in triplicate The primers used were as follows: HMGA1P4-F: GTGGGGCCTGAATTGACCAT, HMGA1P4-R: CCACCCCCTCCTTGACATTAC; MAGI2-AS3-F: CTTGACACACTTGAGCCGGA, MAGI2-AS3-R: TGTGCTCTCCTGCATTCTGTT; MIR22HG-F: AAGAACTGTTGCCCTCTGCC, MIR22HG-R: ATCATCCACCCTGCTGTTCG; UBE2Q1-AS1-F: AGTCTCTCCACCAGCCAGAT, UBE2Q1-AS1-R: TGACAGAGACAGCCATTTTGC.
Gene set enrichment analysis
Gene set enrichment analysis (GSEA) first generated an ordered list of all genes according to their correlation with MAGI2-AS3 expression, GSEA was carried out to elucidate the significant survival difference observed between low and high MAGI2-AS3 groups. The cutoff value of MAGI2-AS3 expressions was determined by its median value. Gene set permutations were performed 1000 times for each analysis. The expression level of MAGI2-AS3 was used as a phenotype label. The nominal p value was used to sort the pathways enriched in low expression phenotype.
Statistical analyses
All statistical analyses were conducted using R (v.3.5.1). Normalized p value or false discovery rate (FDR) was used to evaluate statistical differences of lncRNA expression levels in GEO or TCGA databases. The relationship between clinicopathological features and lncRNAs were analyzed with the Wilcoxon test or Kruskal test and logistic regression. Clinicopathological characteristics associated with overall survival in TCGA patients were analyzed using Cox regression and the Kaplan–Meier method. Multivariate Cox analysis was used to compare the influence of lncRNA expression on survival along with other clinical characteristics (stage, grade, lymph node status, distant metastasis status). The statistical differences of four lncRNA expression levels between the clinical samples were analyzed with paired Student's t-test. Error bars represent the mean ± SD.
Results
Convergence of gene expression signatures across different studies from GEO database
In the study, four datasets supplemented with their platform information were downloaded from GEO database. After reannotation, 17,053 genes in GSE72307, 23,386 genes in GSE53137 dataset, 174,302 genes in GSE95667 dataset, and 22,477 genes in GSE111762 dataset were obtained. Before integrated analysis of four datasets, limma package was applied to screen differentially expressed genes according to the threshold of |LogFC| > 1 and FDR <0.05 in each dataset separately. We found 1733 differential genes, including 838 upregulated genes and 895 downregulated genes in GSE53137. The GSE95667 dataset contained 1178 differential genes, including 559 upregulated genes and 619 downregulated genes; and the GSE111762 dataset contained 114 differential genes, including 84 upregulated genes and 30 downregulated genes. However, only 19 genes were differentially expressed in dataset GSE72307, which was far less than that in the other three datasets. The results indicated that GSE72307 was not consistent with other datasets, thus GSE72307 was not suitable for later study.
The datasets, including GSE53137, GSE95667, and GSE111762, were finally picked up for batch normalization and merge together to increase sample number. The raw and normalized data are shown in Supplementary Figure S1 [the GSE15137 was same as in reference (Zhang et al., 2019)]. The detailed information of three datasets and the number of differentially expressed genes identified from each dataset are shown in Table 1. In total, 142 integrated genes were significantly changed. Among them, 56 lncRNAs and 32 mRNAs were upregulated, 23 lncRNAs and 31 mRNAs were downregulated. Detailed information including the fold change and FDR of these genes can be found in Supplementary Tables S1 and S2.
LncRNA validation in TCGA database
To validate the differentially expressed lncRNAs selected from GEO database, the gastric cancer RNA expression profile data of the corresponding patients were downloaded from TCGA data portal in April 2019. The characteristics of patients, including gender, tumor grade, and TNM stage were collected, as shown in Table 2. The median age at diagnosis was 65.68 years of age. Stage I disease was found in 59 patients (13.32%), while most patients were at stage II and stage III (29.35%, n = 130; 41.31%, n = 183 respectively). Two thirds of patients (n = 292) had lymph node metastasis. Thirty of 443 (6.77%) cases had distant metastasis. Two hundred ninety patients (65.46%) were alive at last contact and the median follow-up time was 17.49 months (range 0–118 months).
In line with the differentially expressed gene selection in GEO database, the limma R package was applied to screen differentially expressed genes according to the |LogFC| > 1 and FDR <0.05 thresholds. A total of 2927 differentially expressed lncRNAs with 2200 upregulated and 727 lncRNAs downregulated were obtained from the TCGA database. The intersection result of lncRNAs between GEO and TCGA database showed that 17 lncRNAs were differentially expressed in TCGA database as well (Supplementary Table S3).
ceRNA network
To find out whether these differentially expressed lncRNAs can be found in the competing endogenous regulating network, the mRNA selected from GEO database and intersected lncRNAs were used to construct a ceRNA network. Four lncRNAs (HMGA1P4, UBE2Q1-AS1, MAGI2-AS3, MIR22HG), 28 miRNAs, and 30 mRNAs were included in the network (Fig. 2). More miRNA connected to MAGI2-AS3 than the other lncRNAs, indicating that MAGI2-AS3 may have a significant role in GC, through a ceRNA network.
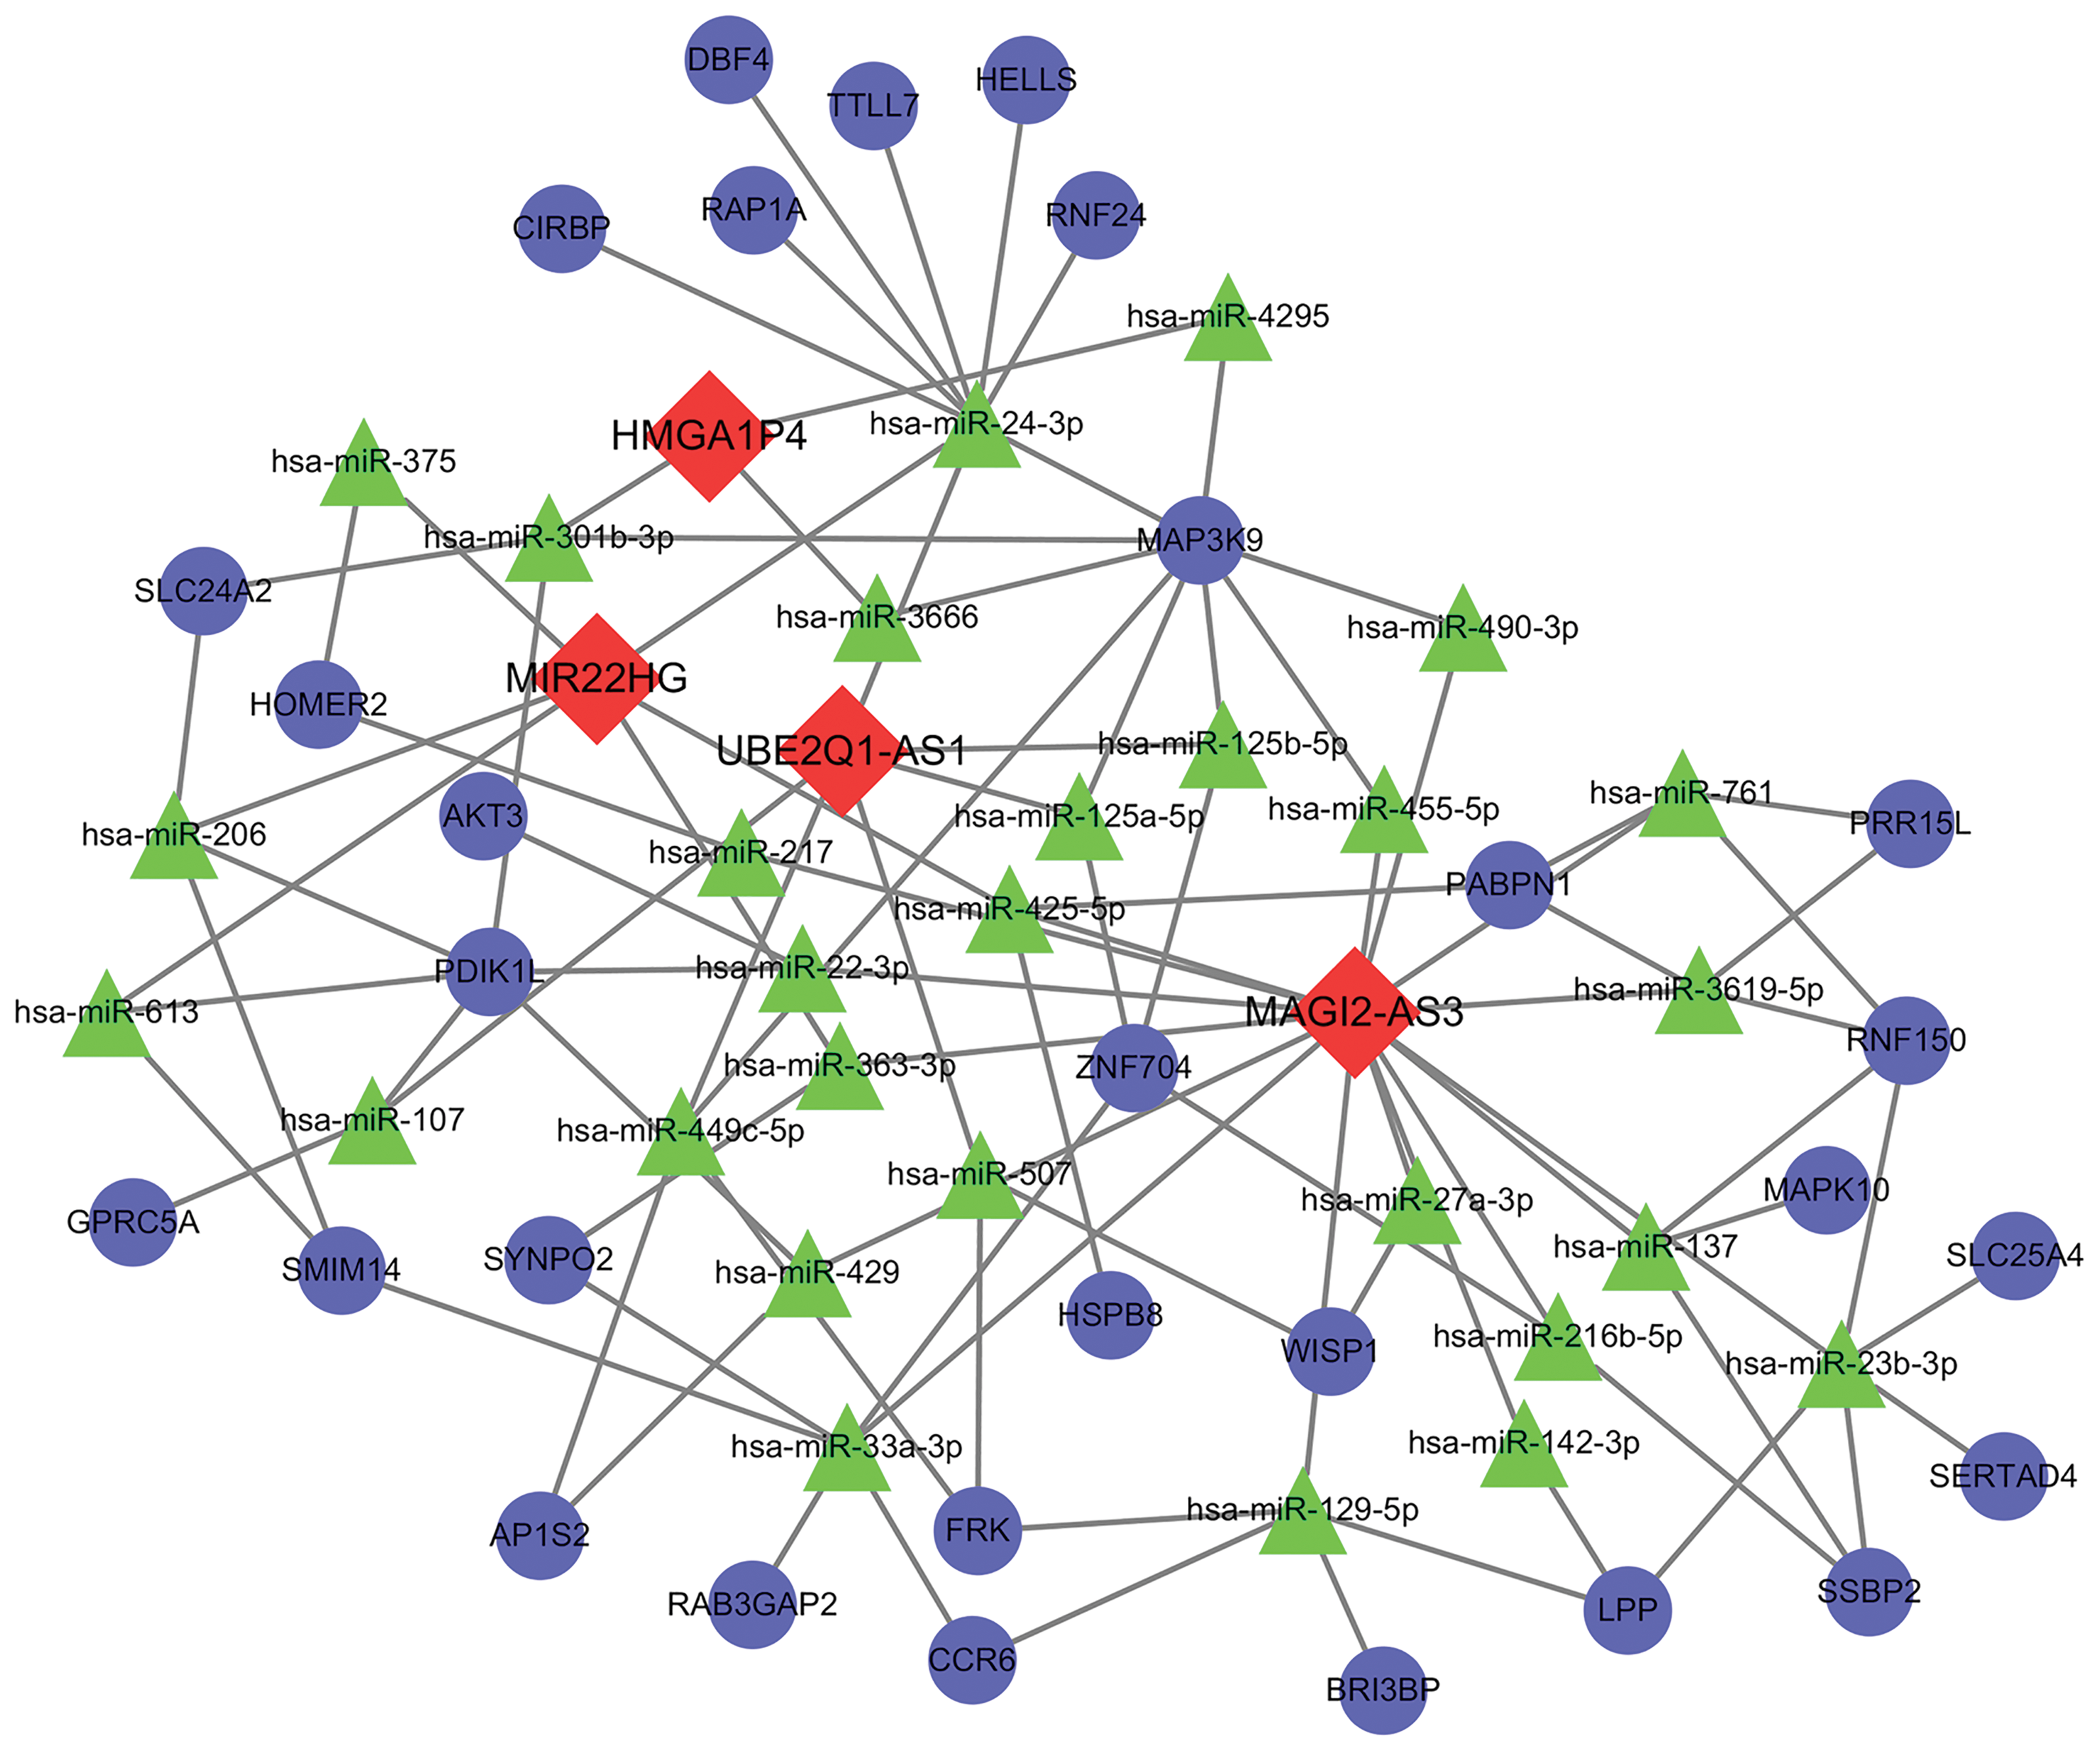
ceRNA network. Red diamond indicates lncRNAs; green triangle indicates miRNAs, blue circle stands for mRNAs. Color images are available online.
Consensus lncRNA expression levels and clinicopathological variables
To further estimate the clinical value of four central lncRNAs in GC, the correlations between lncRNA expression levels and clinicopathological characteristics were investigated using TCGA data. The association between lncRNA expression and clinicopathological features of the GC patient was estimated by Wilcoxon test or Kruskal test and logistic regression. As shown in Figure 3, the expression levels of HMGA1P4 and UBE2Q1-AS1 were upregulated and lncRNAs, MAGI2-AS3 and MIR22HG, were downregulated in the GC patient samples, which were consistent with results using GEO data (Supplementary Table S1). In addition, we found that the increase of HMGA1P4 was significantly correlated with the tumor topography (p = 0.016, Fig. 3I) and upregulation of UBE2Q1-AS1 was significantly related to tumor grade (p = 0.04, Fig. 3J). The expression of MAGI2-AS3 was lower in GC stage I than other stages, indicating that MAGI2-AS3 could be a biomarker for early stage GC diagnosis (Fig. 3K). Reduced MIR22HG expression in GC was significantly associated with lymph node metastasis (p = 0.032, Fig. 3L), revealing that MIR22HG might be an indicator for early stage GC diagnosis without lymph node metastasis.
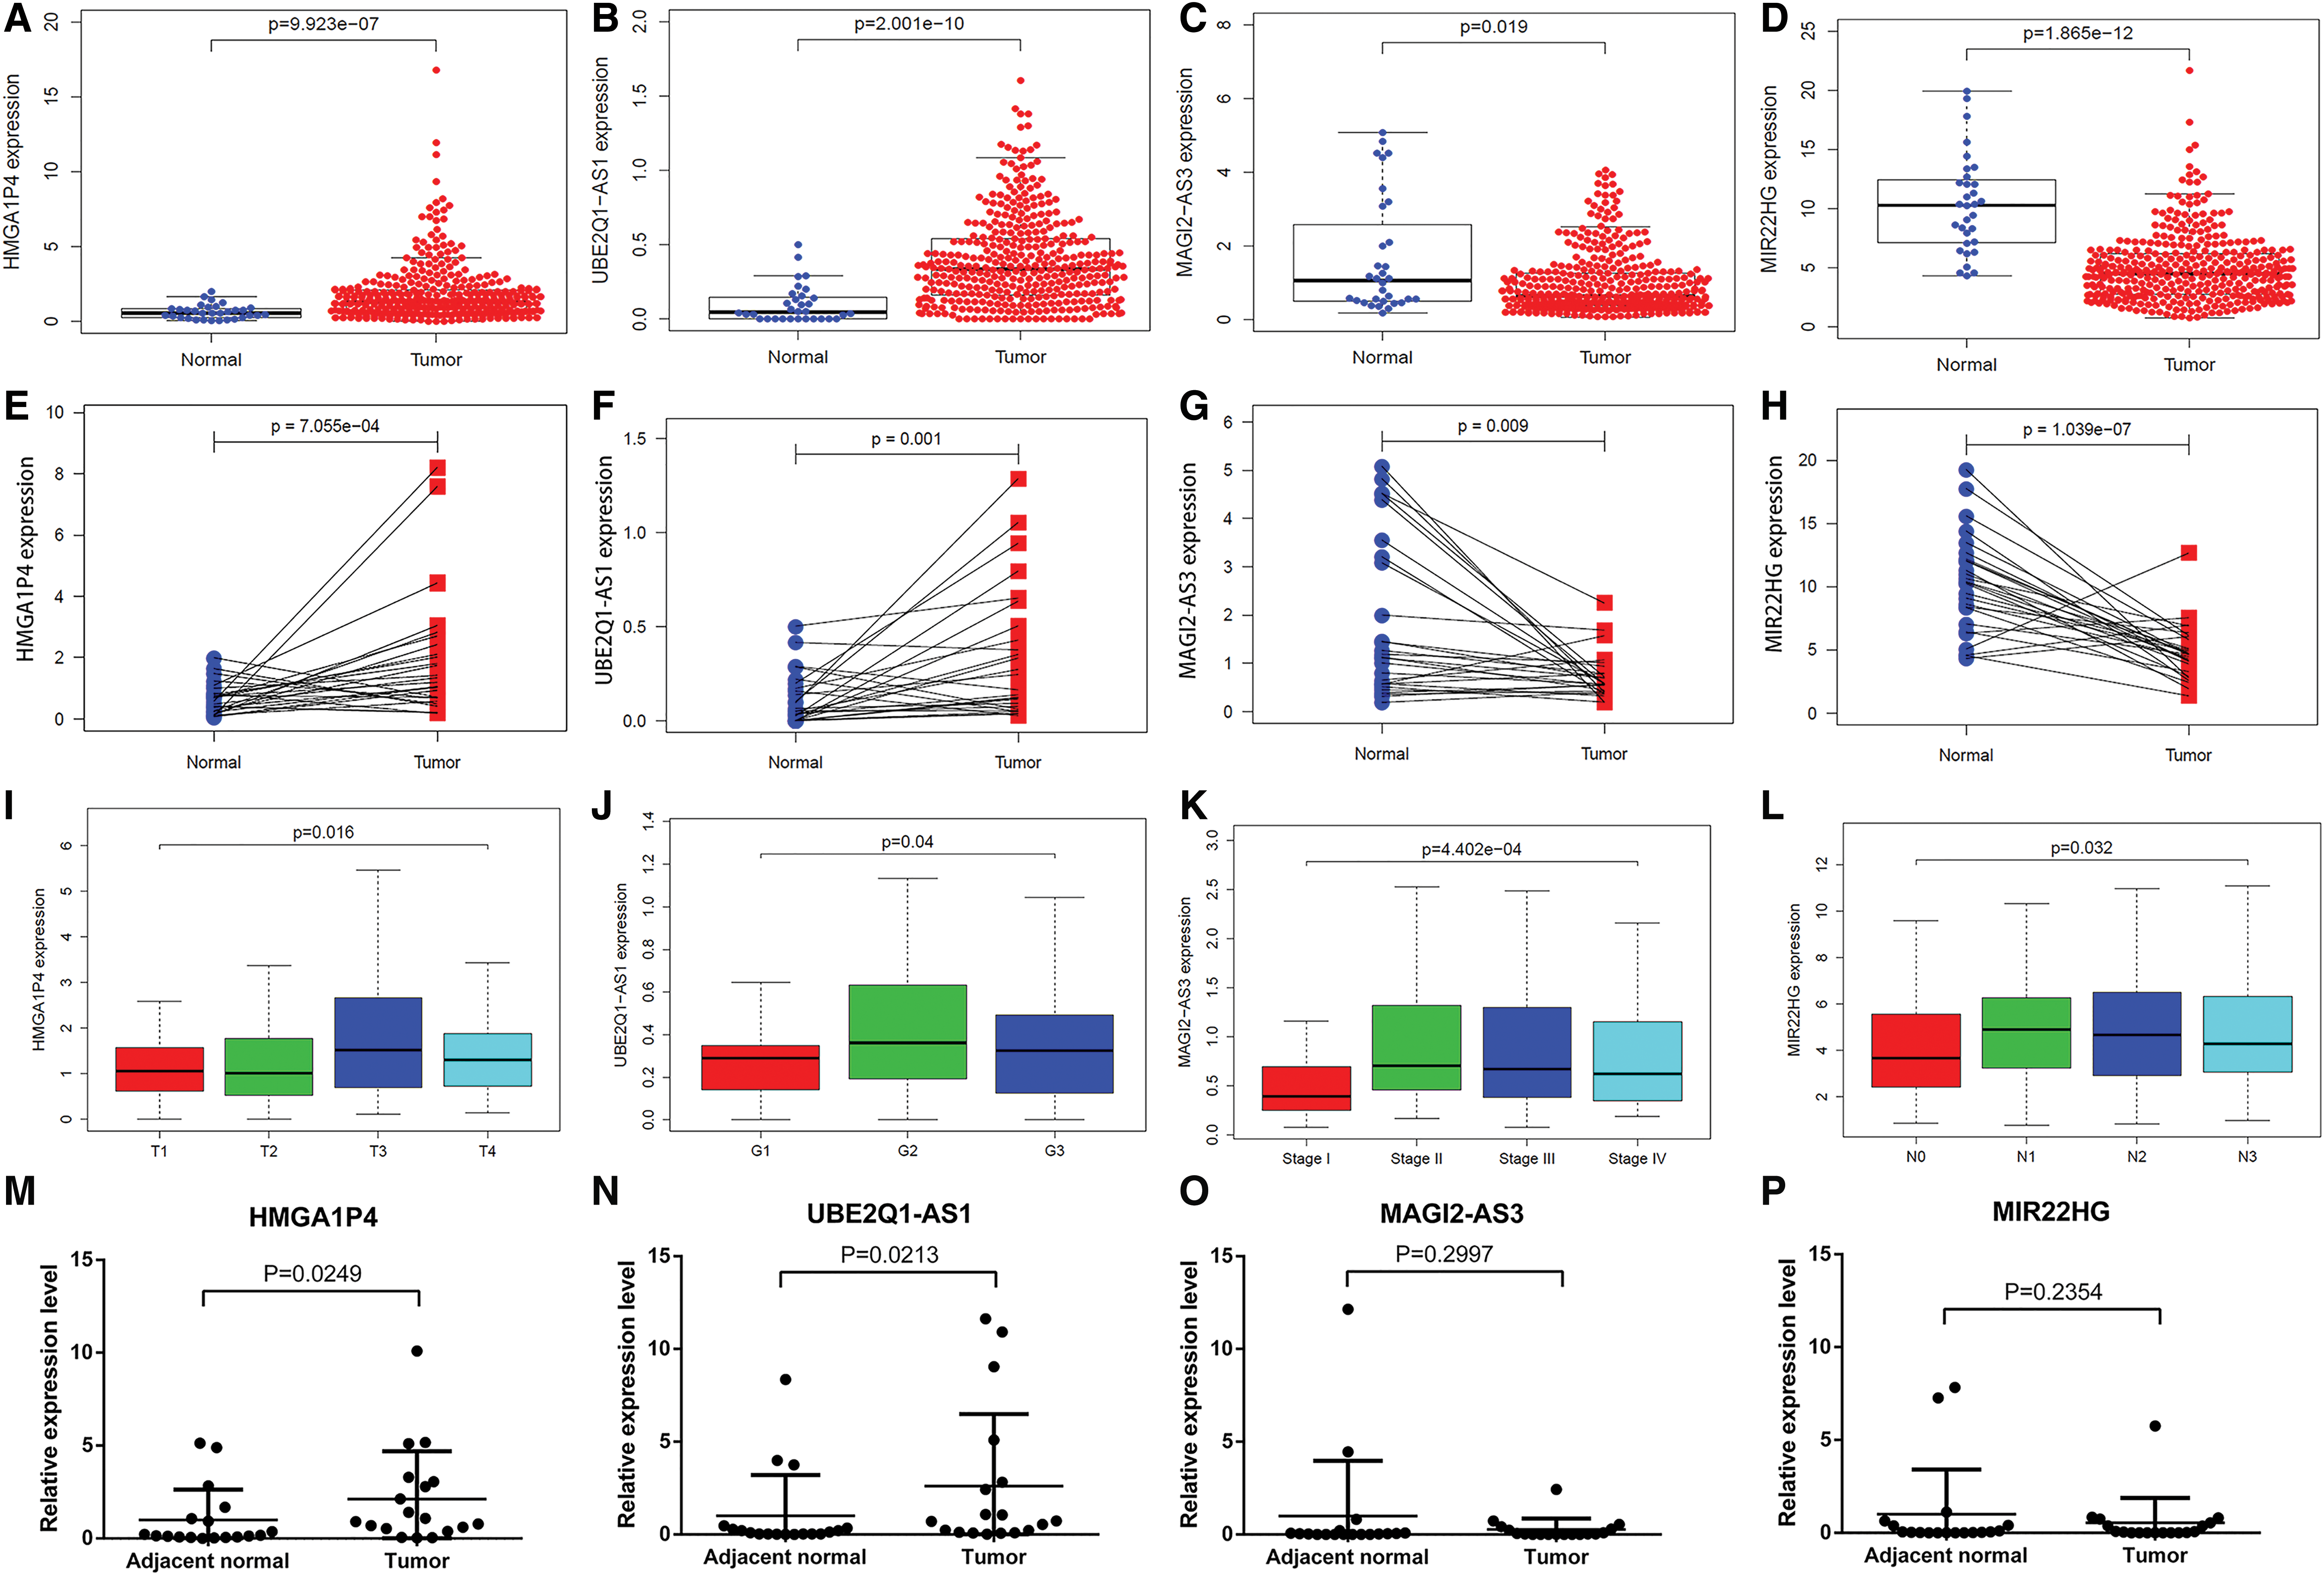
lncRNA expression levels.
Furthermore, the expression levels of four lncRNAs were checked in patient GC tissue by qPCR. Consistent with bioinformatics analysis results, the expression levels of HMGA1P4 and UBE2Q1-AS1 were upregulated in GC tissues compared with paired adjacent normal tissues (Fig. 3M, N). In detail, HMGA1P4 increased 2.122-fold with p value = 0.0249, whereas UBE2Q1-AS1 was upregulated 2.604-fold with p value = 0.0213. The expression levels of two downregulated lncRNAs, MAGI2-AS3 and MIR22HG, were decreased in GC tissues, but without statistical significance (Fig. 3O, P). These results suggested that four lncRNAs might be effective in GC progression.
Survival outcomes and multivariate analysis
To explore the prognostic value of the four lncRNAs in
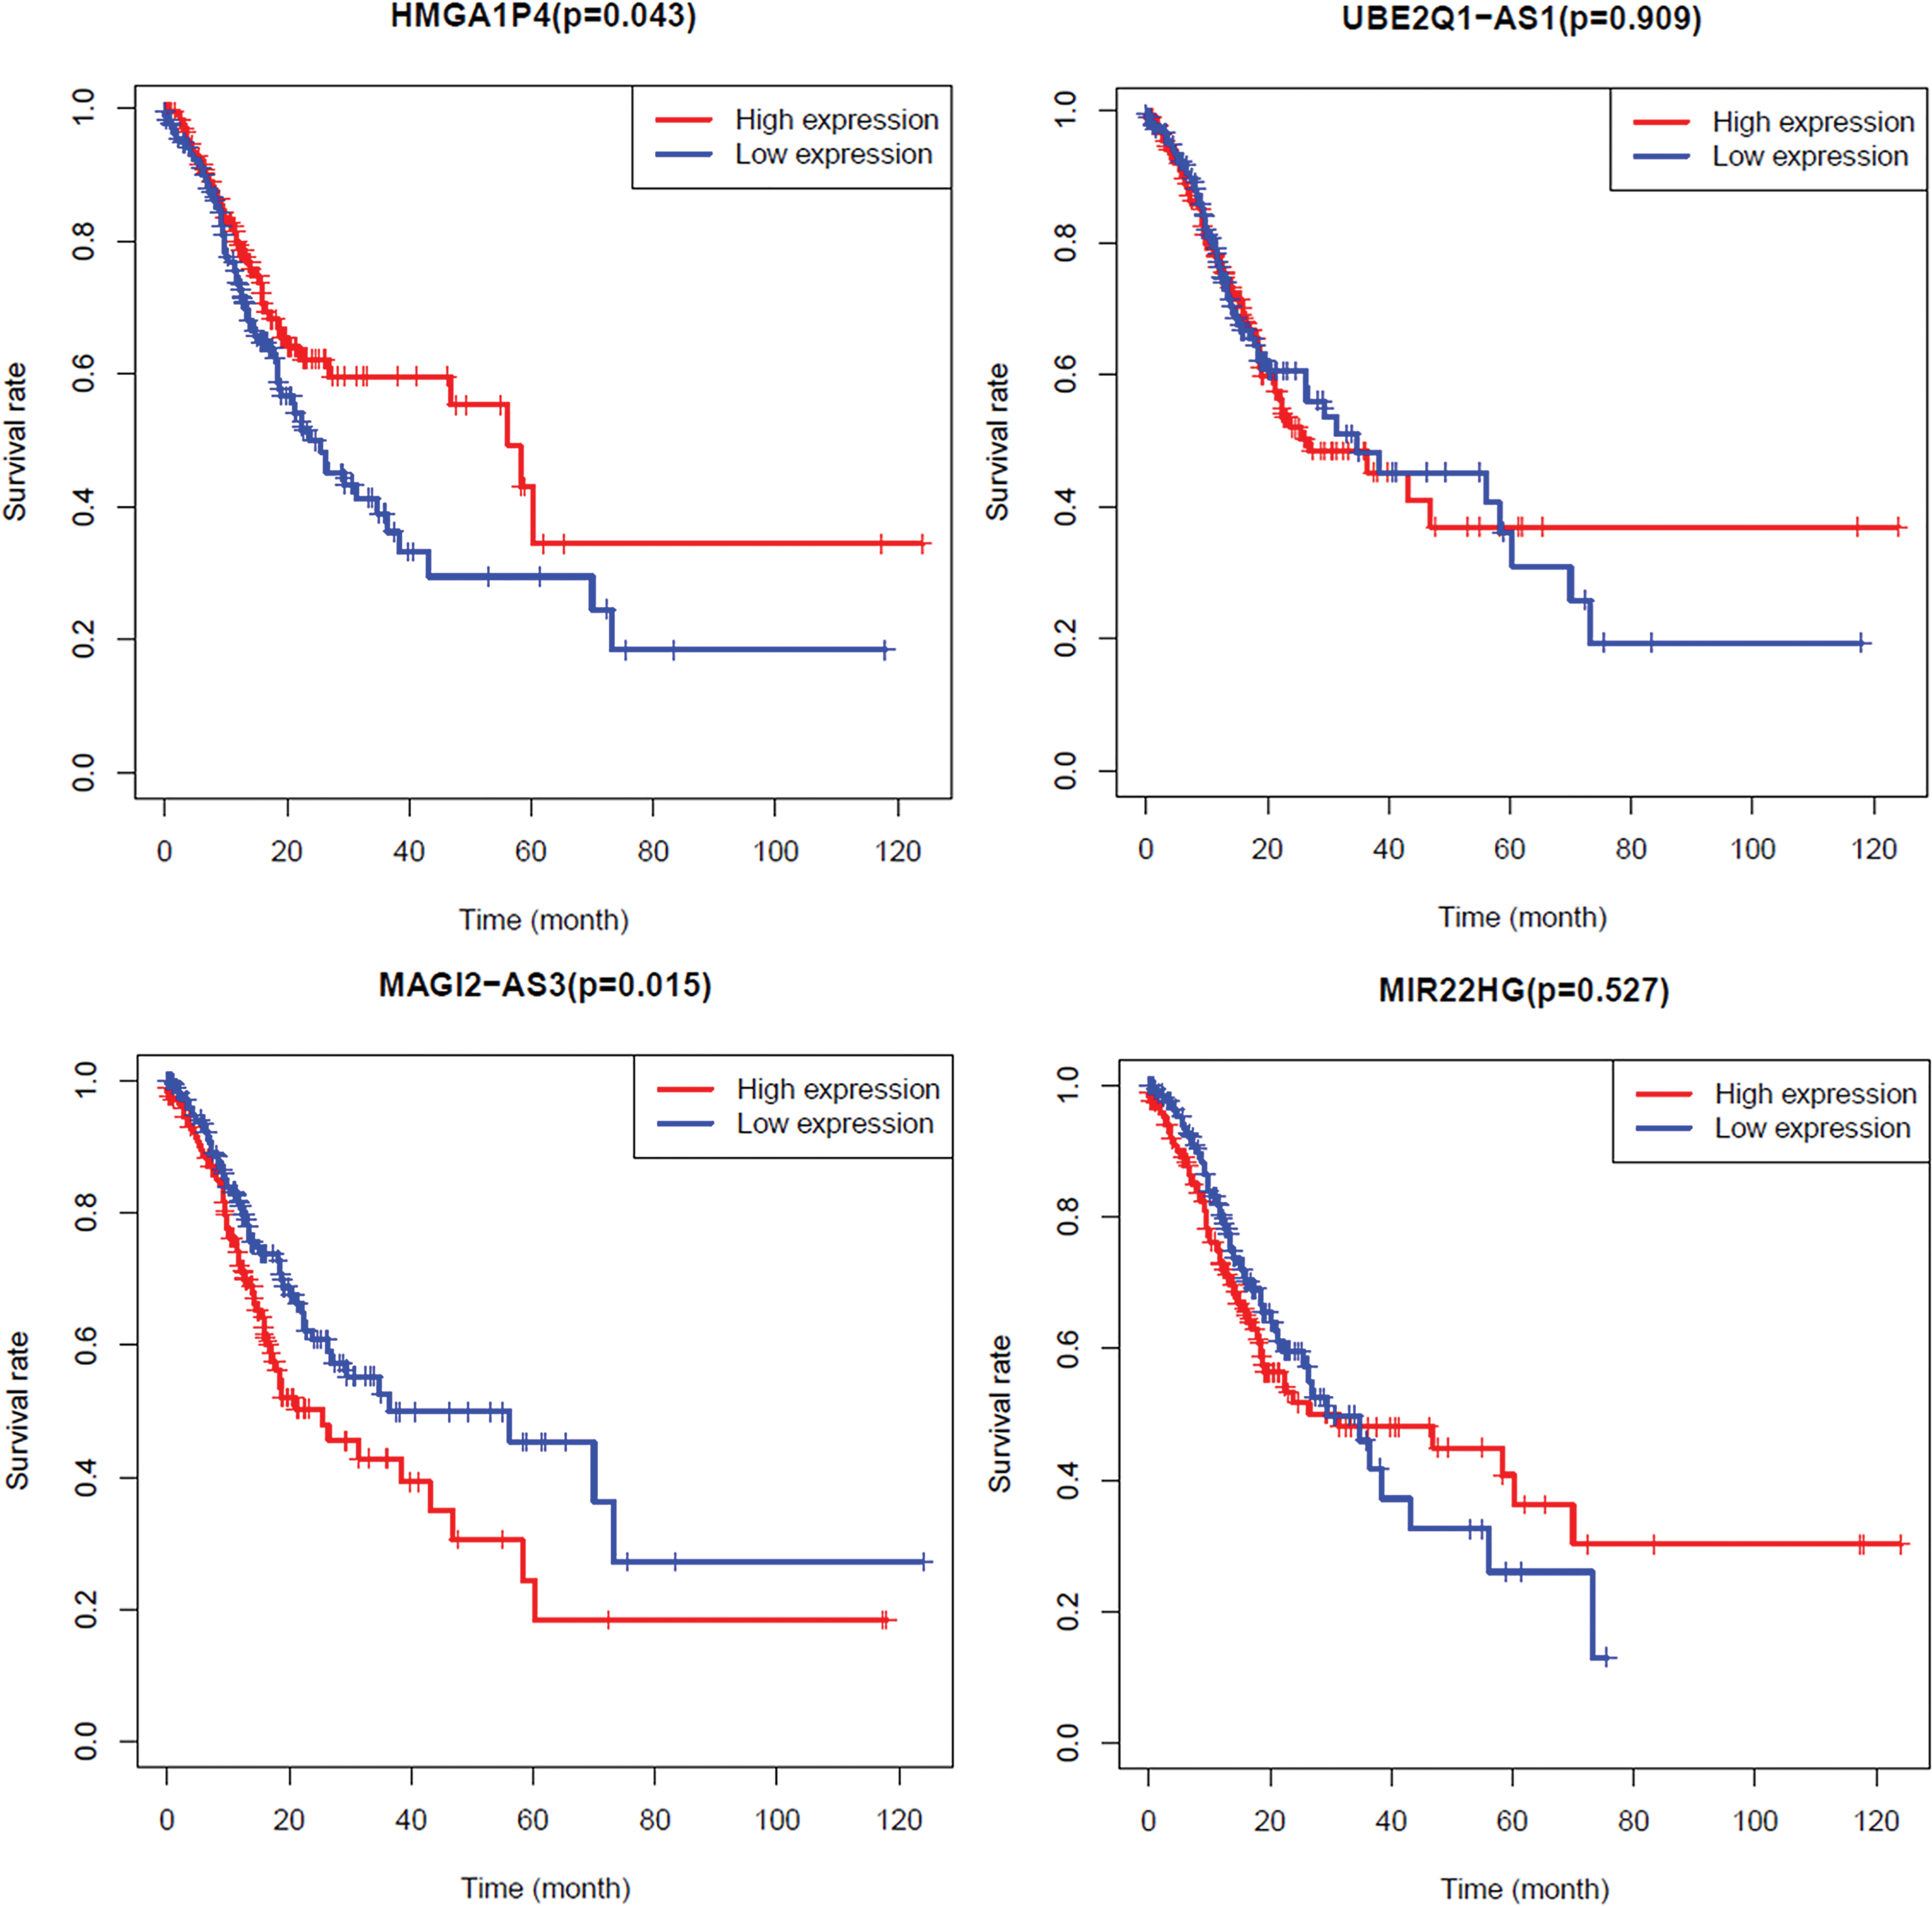
Overall survival analyses. All samples were grouped into two groups (high vs. low) using optimal cutoff values determined by the survminer R package. p value <0.05 was considered as statistically significant. Color images are available online.
Univariate and Multivariate Analysis
MAGI2-AS3-related signaling pathway identification
To identify signaling pathways that are differentially activated in GC, we conducted GSEA between low and high MAGI2-AS3 expression datasets. GSEA revealed significant differences (gene size >50, FDR <0.05, NOM p < 0.05) in enrichment of MSigDB (
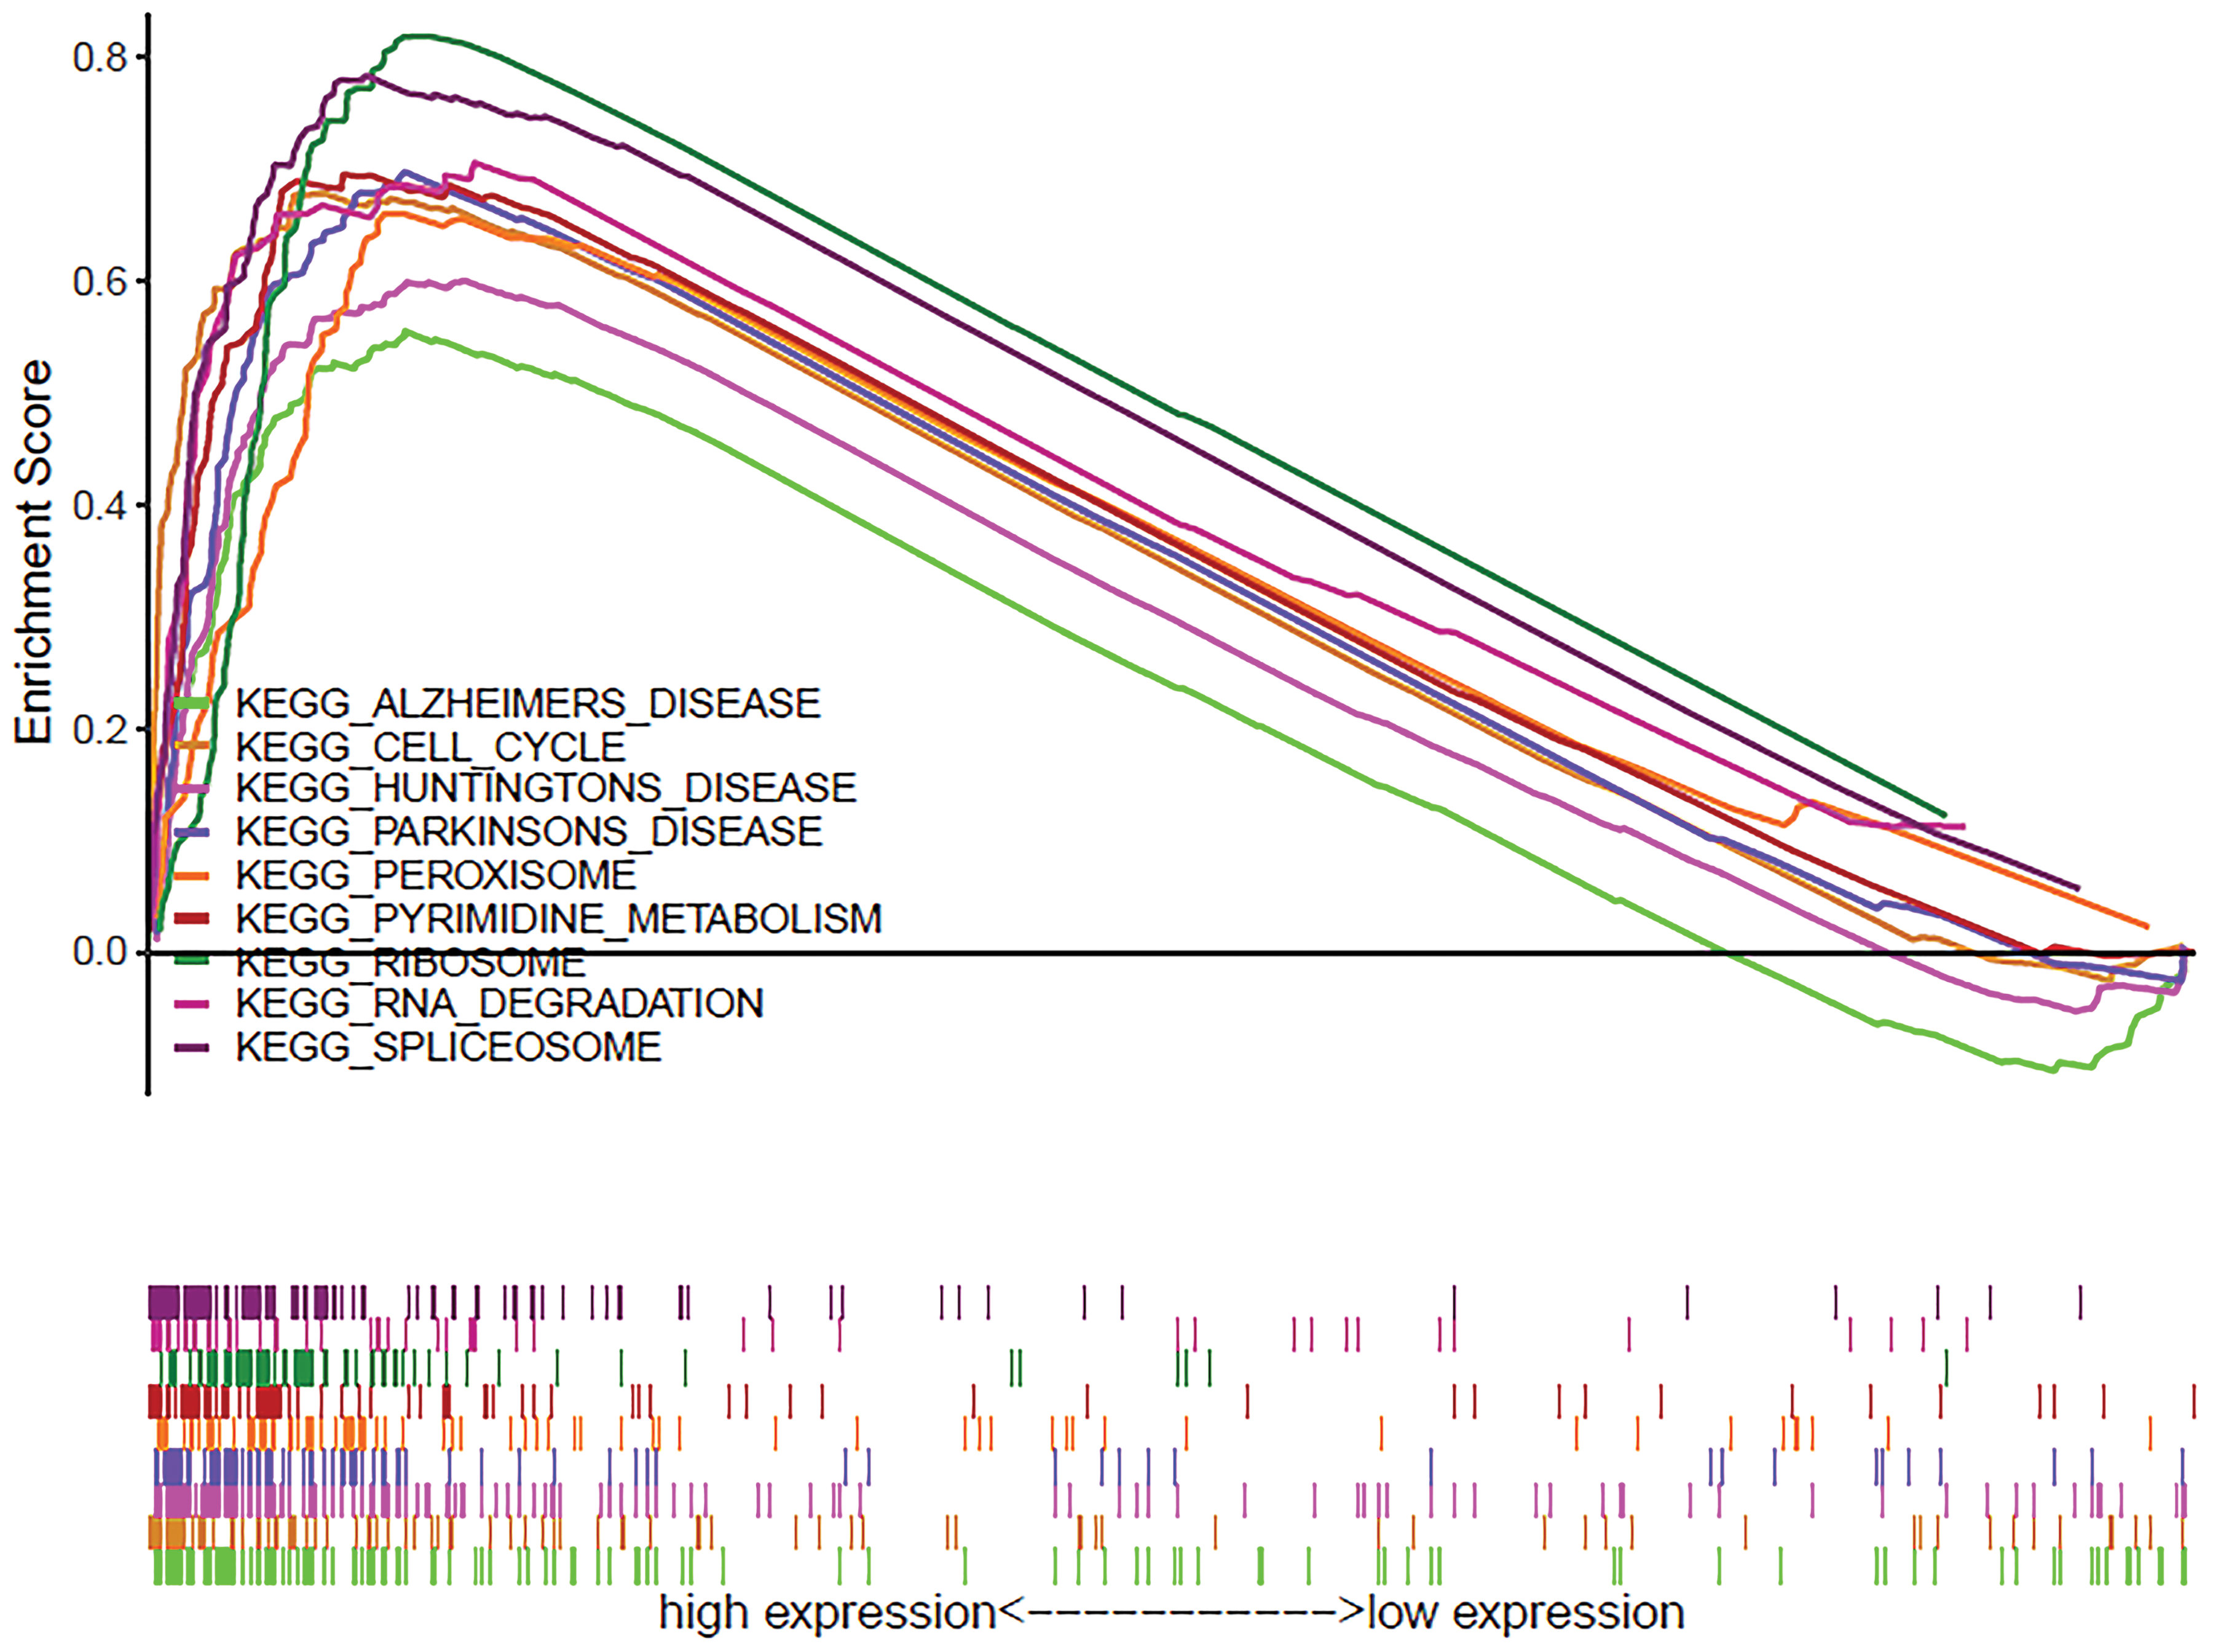
KEGG pathway analysis of MAGI2-AS3. GSEA was carried out to elucidate the significant survival difference observed between low and high MAGI2-AS3 groups. Gene set permutations were performed 1000 times for each analysis. The nominal p-value (FDR) <0.05 and size number >50 were used to sort the pathways enriched in low expression phenotype. GSEA, gene set enrichment analysis; FDR, false discovery rate. Color images are available online.
Gene Sets Enriched in Phenotype Low
Gene sets with NOM p-val <0.05 and FDR q-val <0.05 are considered as significant.
NES, normalized enrichment score; NOM, nominal; FDR, false discovery rate.
Discussion
Although the incidence and associated mortality rate decreased in GC, it remains a worldwide public health concern. Therefore, identification of genes with oncogenic potential or tumor suppressor activity may be of great value for diagnosis and treatment. In the present study, we identified lncRNAs involved in GC by analyzing gene expression data obtained from GEO and TCGA databases, supplement with confirmation of lncRNA expression levels in GC and normal tissues. ceRNA network was constructed according to the bioinformatics differential analysis. The functions of key lncRNAs were predicted in GC by survival and pathway analyses. We found that four lncRNAs, including HMGA1P4, UBE2Q1-AS1, MAGI2-AS3, and MIR22HG, may contribute to GC development, specifically MAGI2-AS3 might be associated with the prognosis of GC.
A multistep approach and integrated bioinformatics described by our previous work were applied to reveal aberrantly expressed lncRNAs in GC (Zhang et al., 2019). However, we found that the medium expression levels in each dataset were still varied. Thus, we hypothesized that the gene heterogeneity could be further reduced if different datasets performed on the same platform. Therefore, the datasets belonging to platform GPL15134 were downloaded for differential lncRNA analysis. In total, four datasets met our conditions. After normalization, we found that the medium expression levels in each dataset were almost the same (Supplementary Fig. S1), which confirmed our hypothesis. Although few differential genes were obtained in the dataset GSE72307 when analyzed separately (differential genes = 19), we still expected to obtain more differential genes when four datasets were integrated. The results showed only 80 differential genes obtained. Further analysis revealed that it was difficult to conduct ceRNA network construction after intersection with differential genes from TCGA database. Thus, the dataset GSE72307 was excluded.
To insure the reliability and accuracy of lncRNAs, two-stage validations were used for lncRNA isolation in this study. To start with, 79 lncRNAs were obtained after the integration of three GEO datasets. In the first-stage validation, the lncRNAs were intersected with differentially expressed lncRNAs from the TCGA database, 56 lncRNAs were both changed in GEO and TCGA databases. In the second validation, four lncRNAs in ceRNA network were picked up for qPCR validation. The expression levels of two upregulated lncRNAs (HMGA1P4 and UBE2Q1-AS1) were elevated in GC tissues. Although the two downregulated lncRNAs (MAGI2-AS3 and MIR22HG) did not show statistical significance in GC tissue, their expression levels were trending down. There are two main problems that might contribute to the nonsignificant differences. First, it is difficult to detect expression levels due to the potential decreased tendency in GC tissues. That is also the reason why most of the lncRNAs studied in tumors are those that show overexpression. Then, the sample size; it is not big enough in this study. Thus, to enlarge sample size for expression level, confirmation is still necessary in the further study.
ceRNA networks represent a powerful way to functionalize lncRNAs and provide an opportunity to determine their functions in cancer. Changes in ceRNA regulation could affect expressions of oncogenes or tumor suppressors, thereby contributing to tumor progression. Generally, not only one method was used for lncRNA isolation. In this study, a ceRNA network was used to identify hub lncRNAs after integration of GEO and TCGA data in GC. Besides ceRNA network, some other methods were also applied to identify lncRNAs. Weighted gene coexpression network was used to identify five candidate biomarkers in breast cancer (Tang et al., 2018). Undoubtedly, various analyses often were combined together for better and comprehensive results. For example, using sample-splitting method, random survival forests-variable hunting algorithm and Cox regression analysis, a 24-lncRNA signature, was identified in GC (Zhu et al., 2016).
In this study, four lncRNAs (HMGA1P4, UBE2Q1-AS1, MAGI2-AS3, MIR22HG), 28 miRNAs, and 30 mRNAs were included in the network. Of note, 16 miRNA of total 28 in ceRNA network bind to lncRNA MAGI2-AS3, revealing that MAGI2-AS3 might be effective in GC by communicating with a great many of molecular factors through ceRNA network. Further analysis revealed that MAGI2-AS3 was independently associated with overall survival and the main molecular functions of MAGI2-AS3 were pyrimidine metabolism, RNA degradation, cell cycle, oxidative phosphorylation etc. MAGI2-AS3 probably participates in these pathways through ceRNA network. MAPK10 and MAP3K, two genes belonging to the mitogen-activated protein kinase (MAPK) family, are found to be involved in a ceRNA network. MAGI2-AS3 is likely to regulate the cell cycle through ceRNA through hsa-miR-137/MAPK10, hsa-miR-490-3p/MAP3K9, or hsa-miR-455-5p/MAP3K9 pathways. Studies have showed that MAGI2-AS3 inhibits cell proliferation and migration by targeting miR-347a and miR-374b-5p/SMG1 signaling pathway in hepatocellular carcinoma (Du et al., 2019; Yin et al., 2019). In bladder cancer, MAGI2-AS3 regulated CCDC19 expression by sponging miR-15b-5p (Wang et al., 2018). Furthermore, MAGI2-AS3 was reported significantly correlated with TNM stage, lymph node metastasis, and distant metastasis in non-small-cell lung cancer (Luo et al., 2018). Although MAGI2-AS3 has not been reported in GC, the qPCR results at least confirmed its altered expression level in GC. Overall, these results give the evidence that MAGI2-AS3 might be a promising valuable lncRNA in GC.
The expression of lncRNA MIR22HG has been reported to be downregulated in many cancers, including hepatocellular carcinoma (Zhang et al., 2018b; Wu et al., 2019), endometrial carcinoma (Cui et al., 2018), lung cancer (Su et al., 2018), and GC (Li and Wang, 2019). Although we failed to prove that MIR22HG was statistically related to the overall survival rate, a previous study has demonstrated low MIR22HG expression, indicated lower 5-year overall survival rate in GC (Li and Wang, 2019). Unsurprisingly, MIR22HG can serve as a ceRNA to modulate miRNA level. The MIR22HG-miRNA-10a-5p-NCOR2 axis inhibited HCC progression by inhibition of Wnt/β-catenin pathway activation (Wu et al., 2019), and MIR22HG-derived miR-22-3p to target HMGB1, thereby inactivating HMGB1 downstream pathways in hepatocellular carcinoma (Zhang et al., 2018b). Apart from the ceRNA network, silencing of MIR22HG promoted cell survival and cell death signaling through dysregulation of the oncogenes YBX1, MET, and p21 in lung cancer (Su et al., 2018). Although the ceRNA network of MIR22HG predicted in this study has not been elucidated until now, a large function area of MIR22HG still needs to be uncovered.
HMGA1P4 selected by ceRNA network was reported to contribute to GC development (Zhang et al., 2019). In this study, we reported that HMGA1P4 was upregulated in GC tissues as well. KEGG analysis revealed that MHGA1P4 is involved in “PATHWAYS_IN_CANCER,” “PPAR_SIGNALING_PATHWAY,” “KEGG_MTOR_SIGNALING_PATHWAY” etc., pathways related in cancer. The results indicated that HMGA1P4 has a potential to function in cancer progress. Generally, the downregulated genes in cancers often indicated higher overall survival rate, the downregulated HMGA1P4 should relate to higher overall survival rate. However, our results showed that GC patients with HMGA1P4-low had a worse prognosis than that with HMGA1P4-high. In addition, the univariate analysis revealed that HMGA1P4 was not significantly correlated with a poor overall survival. Thus, whether HMGA1P4 could be a prognosis biomarker in GC should be further evaluated.
In this study, we identified lncRNA UBE2Q1-AS1, upregulated, and significantly related to tumor grade in GC, which has not been previously reported in cancer. The KEGG analysis revealed that UBE2Q1-AS1 mainly participates in ubiquitin-mediated proteolysis and RNA degradation, perhaps indicating a potential role in GC. Although little information about UBE2Q1-AS was available, some indirect evidence might indicate its potential regulatory functions. Antisense lncRNA, often associated with the expression of its sense gene, may be widely involved in the regulation of protein-coding gene expression especially the expression of the sense gene. Therefore, we suspect that UBE2Q1-AS might serve a role in cancers, including GC, through the sense gene UBE2Q1. By investigating the function of UBE2Q1, we found it enhanced cell proliferation and poor prognosis in hepatocellular carcinoma (Chang et al., 2015). A recent study showed that UBE2Q1 is a candidate oncogene involved in hepatocellular carcinoma development and progression by regulation of β-catenin-EGFR-PI3K-Akt-mTOR signaling pathway (Zhang et al., 2018a). Also, UBE2Q1 is associated with breast cancer (Seghatoleslam et al., 2012), colorectal cancer (Shafiee et al., 2013), and GC (Yoo et al., 2011) as well. Thus, based on our results and literature information, we believe that UBE2Q1-AS1 might be effective through regulation of UBE2Q1 in GC.
However, there were several limitations to this study. All differentially expressed lncRNAs identified were based on datasets from GEO database. Although we integrated three GEO datasets to enlarge sample number, the total sample number was still not big enough, which restricted to discover more lncRNAs in GC. Also most of the samples from GEO database are males, which is a cause that contributes to differential gene isolation. Therefore, more datasets are required for further validation. Then, the potential functions of four lncRNAs, including the ceRNA regulatory network still need to be validated by experiments, which will be conducted in our further studies.
In conclusion, through the combined analysis of gene expression profiles from GEO and TCGA databases, differentially expressed lncRNAs (HMGA1P4, UBE2Q1-AS1, MAGI2-AS3, MIR22HG) and their potential functions in GC were revealed in this study. A series of analysis showed that four lncRNAs may contribute to GC and MAGI2-AS3 that might be associated with the prognosis of GC, which may facilitate further exploration of the mechanism.
Footnotes
Authors' Contributions
Xianqin Zhang and Fangzhou Song conceived idea of the study. Xianqin Zhang participated in experiment design and coordination, drafted and revised the article. Yuyou Jiang collected tissue samples and performed qPCR experiment. Yan Xie and Xue Leng performed statistical analysis and revised the article. All authors read and approved the final article.
Disclosure Statement
The authors declare that they have no conflicts of interest.
Funding Information
This study was supported by grants from the Natural Science Foundation of Chongqing in China (Grant no. cstc2019jcyj-msxmX0259).
Supplementary Material
Supplementary Figure S1
Supplementary Table S1
Supplementary Table S2
Supplementary Table S3
References
Supplementary Material
Please find the following supplemental material available below.
For Open Access articles published under a Creative Commons License, all supplemental material carries the same license as the article it is associated with.
For non-Open Access articles published, all supplemental material carries a non-exclusive license, and permission requests for re-use of supplemental material or any part of supplemental material shall be sent directly to the copyright owner as specified in the copyright notice associated with the article.