




Abstract
Single nucleotide polymorphisms in miRNA binding sites (miR-SNPs) are associated with cancer risk. We assessed the relationship between five miR-SNPs in the 3′ untranslated region (3′-UTR) of RYR3 (rs1044129), KIAA0423 (rs1053667), C14orf101 (rs4901706), GOLGA7 (rs11337), and KRT81 (rs3660) and the risk of breast cancer (BC). The CC genotype of rs3660 located in the 3′-UTR of KRT81 was identified for its association with lower BC risk (odds ratio, 0.093; 95% confidence interval, 0.045–0.193; p = 0.000). Immunnochemical analysis and Renilla luciferase reporter assays indicated that the CC genotype of KRT81 was associated with lower expression of KRT81 (p < 0.05). The subsequently functional analysis showed that knockdown the KRT81 could inhibit proliferation and promote apoptosis of the MDA-MB-231 BC cells (p < 0.05) with monocyte chemotactic protein-1 (MCP-1) deregulation. Meanwhile, KRT81 overexpression could promote the proliferation and inhibit the apoptosis of MCF-7 BC cells (p < 0.05). Our data demonstrated that the KRT81 expressional change modulated by rs3660 miR-SNP could modify the carcinogenesis of BC, thereby KRT81 would be a new target for BC treatment.
Introduction
Breast cancer (BC) is the most frequently diagnosed cancer and the sixth leading cause of cancer-related death in Chinese women, and the incidence of this disease displays a trend of rapid rise worldwide with more and more younger patients involved (Fan et al., 2014). Although reproductive and hormonal factors, nulliparity, increased age of first live-birth, and limited breastfeeding contributed to the increased risk of BC, the true mechanism of BC carcinogenesis remains uncertain (Bao et al., 2011; Tanic et al., 2012; Yanhua et al., 2012; Zhang et al., 2012; Arthur et al., 2017).
MicroRNAs (miRNAs) are an abundant class of 19–25nt long single-stranded noncoding RNA molecules that can act as regulators at post-transcriptional level by base pairing to the “seed region” of 2–8 nucleotides in the 3′ untranslated region (3′-UTR) of mRNAs (Malumbres, 2013). MiRNAs are involved in crucial biological processes including development, proliferation, differentiation, apoptosis, and stress reaction (Cannell et al., 2008). Single nucleotide polymorphisms in miRNA binding sites (miR-SNPs) could influence the complementarity between the miRNA and its target gene so as to alter the expression of corresponding gene to modify cancer risk, treatment efficacy, and patient prognosis (Brendle et al., 2008; Chin et al., 2008).
A total of 12 miR-SNPs located in the miRNA target site were identified for their potential association with cancer (Yu et al., 2007), these SNPs were genotyped in healthy cases from Hebei province in China, 6 SNPs were excluded due to presenting a minor allele frequency of <5% (Wang et al., 2016a). In addition, the SNP locus rs16917496 in the 3′-UTR of SET8 was identified to be associated with the risk and prognosis of BC (Liu et al., 2016), so the present study aimed to investigate the remaining five miR-SNPs in the 3′-UTR of RYR3 (rs1044129), KIAA0423 (rs1053667), C14orf101 (rs4901706), GOLGA7 (rs11337), and KRT81 (rs3660) in BC patients to assess their association with the risk of BC.
Materials and Methods
Ethics approval and informed consent
All procedures were supervised and approved by the Human Tissue Research Committee of the Fourth Hospital of Hebei Medical University (Ethical number: EMC20121128c). Inform consent was provided to all cases enrolled in this study.
Tissue specimens and DNA extraction
A total of 182 blood samples and 70 BC tissues were collected at the Breast Center in the Fourth Hospital of Hebei Medical University between January of 2013 and March of 2016. All BC patients were diagnosed via histopathological examination. In addition, blood samples were collected from 130 healthy subjects without cancer history or breast disease in the same hospital between October of 2013 and October of 2016. Genomic DNA extraction was carried out by using the Wizard Genomic DNA Purification Kit (Promega Corporation, Fitchburg, WI).
DNA amplification and miR-SNP screening
The miR-SNPs including RYR3 (rs1044129), KIAA0423 (rs1053667), C14orf101 (rs4901706), GOLGA7 (rs11337), and KRT81 (rs3660) were genotyped via ligation detection reaction method with forward and reverse primers to amplify the DNA fragments according to the SNP database of the National Center for Biotechnology Information (NCBI, Bethesda, MD) (Yi et al., 2011). Then PCR Master Mix Kit (Promega Corporation) was used to perform PCR based on the manufacturer's instructions: Mix 50 ng genomic DNA, 1 μL of 10 nm primer pairs, 12.5 μL of Master Mix, and distilled water to a final volume of 25 μL for 35 thermal cycles. Ligation was performed with various probes matched to the miR-SNPs with length difference. The ABI PRISM 3730xl DNA Analyzer (Applied Biosystems, Thermo Fisher Scientific, Inc., Foster City, CA) was used to separate the ligated products. The miR-SNPs were verified based on the different length of ligated products. The primers and probe sequences used in PCR are shown in Table 1.
Primers and Probes Used for Genotyping of miRNA Single Nucleotide Polymorphisms
F represents forward primer. R represents reverse primer. S1 and S2 represent probes that match to different alleles of the SNP. S3 represents probes downstream of the SNP.
Immunohistochemical staining
BC tissues were cut into 4-mm paraffin sections after fixation with 10% formalin. The sections were incubated with an anti-KRT81 antibody (Abcam, Cambridge, United Kingdom) overnight at 4°C followed by incubation with a universal secondary anti-mouse IgG antibody (Abcam) at room temperature for 30 min. The staining were developed using 3,3′-diaminobenzidine (DAB) after HRP-conjugated streptavidin incubation. The HSCORE was used to semi-quantify the immunostaining by two pathologists who were blinded to the genotype (Vizoso et al., 1995). The HSCORE represents the staining intensity multiplied by the sum of each of the percentages as follows: HSCORE = (i + 1) × PC. i = 0, 1, 2, 3, and 4, i was weighted by the staining intensity as follows: 0, no staining; 1, weak staining, light-yellow; 2, moderate-weak staining, yellow brown; 3, moderate-strong staining, brown; and 4, strong staining, dark brown. And PC was the sum of each of the percentages, ranging from 0% to 100%. High expression was defined as a score of ≥100% and low expression was defined as a score <100%.
Renilla luciferase reporter assays
Renilla luciferase reporter assays were performed based on a protocol described previously (Wang et al., 2016b). Four oligonucleotides containing the GG or CC genotype (rs3660; 51 bp) were synthesized: sense for GG (5′-TCGAGGAGCAAGTGCTCAGCTACTTCTCCTGCACTTTGAAAGACCCCTCCCACTCCGC-3′); and antisense for GG (5′-GGCCGCGGAGTGGGAGGGGTCTTTCAAAGTGCAGGAGAAGTAGCTGAGCACTTGCTCC-3′); sense for CC (5′-TCGAGGAGCAAGTGCTCAGCTACTTCTCCTCCACTTTGAAAGACCCCTCCCACTCCGC-3′) and antisense for CC (5′-GGCCGCGGAGTGGGAGGGGTCTTTCAAAGTGGAGGAGAAGTAGCTGAGCACTTGCTCC-3′). The four oligonucleotides were first annealed with 1 × NEBuffer 2 (New England Biolabs, Ipswich, MA) in a heating block at 95°C for 5 min, followed by a gradual reduction of temperature to room temperature. The psiCheck2 vector (Promega Corporation) containing Renilla luciferase and controlled firefly luciferase genes was linearized by digestion with NotI and XhoI (New England Biolabs) and purified from an agarose gel. The annealed oligonucleotides were ligated in the linearized psiCheck2 vector into the NotI and XhoI cloning sites located downstream of the Renilla luciferase reporter gene with T4 DNA ligase (Promega Corporation). The ligated vectors were transformed in Escherichia coli competent cells, and positive clones were selected by sequencing.
The BC cell line MCF7 was seeded in 48-well plates and transfected with 800 ng of the modified psiCheck2 vector containing either the GG or CC genotype. Then, the Renilla luciferase activity was measured with a luminometer (Lumat, Albuquerque, NM) 48 h after transfection with the Dual-Lucy Assay Kit (Vigorous Instrument, Beijing, China), and the transfection efficiency was normalized with the firefly luciferase activities.
Cell culture
The BC cell lines MDA-MB-231, MCF-7, MDA-MB-453, and T47D were obtained from the Cell Bank of the Chinese Academy of Sciences (Shanghai, China) where they were characterized by mycoplasma detection, DNA Fingerprinting, isozyme detection, and cell vitality detection. MDA-MB-231 cells and MDA-MB-453 cells were cultured in L15 medium (Corning-Costar, NY) supplemented with 10% fetal bovine serum (FBS) (Gibco™Life Technologies, NY) at 37°C in a humidified atmosphere, while MCF-7 and T47D cells were cultured in RPMI-1640 medium (Gibco Life Technologies) with 10% FBS (Gibco Life Technologies) at 37°C in 5% CO2. Then, western blot was performed to analyze the expression level of KRT81 of each cell line.
Transfection and western blot
To knockdown KRT81, ∼1 × 10⁵ MDA-MB-231 cells were incubated with psi-U6-KRT81shRNA (GeneCopoeia, Rockville, MD) using Lipofactamine 2000 (Invitrogen, San Diego, CA) based on a protocol described previously (Dalby et al., 2004), the target sequence of the psi-U6-KRT81shRNA was GGAAAGGCCACCCTAGAAAGA. For the negative control experiments, MDA-MB-231 cells were transfected with psi-U6 plasmids (GeneCopoeia). MCF-7 cells were transfected with KRT81-pEZ-Lv201 (GeneCopoeia) for KRT81 overexpression.
According to a protocol described previously (Towbin et al., 1979), western blot was performed to confirm the success of KRT81 knocking-down and overexpression. Equal protein quantities of lysates prepared from each cell group were subjected to SDS-PAGE and transfered to PVDF membranes. Membranes were blocked for 2 h in blocking buffer (5% nonfat dry milk in Tris-buffered saline with 0.1% Tween 20) at room temperature, incubated overnight at 4°C with the following primary antibodies: mouse anti-KRT81 antibody (Abcam) at a dilution of 1:2000 or mouse anti-β-actin antibody (Abcam) at a dilution of 1:10,000, followed by incubation with secondary antibody, which was anti-mouse IgG antibody (Abcam) at a dilution of 1:5000. Protein bands were visualized with ECL reagent (BD, San Diego, CA). Then, cells transfected successfully were maintained in normal medium supplement with 0.3 μg/mL puromycin.
Cell proliferation assay (MTS assay)
Cell proliferation assay was examined by 3-(4,5-dimethylthiazol-2-yl)-5-(3-carboxymethoxyphenyl)-2-(4-sulfophenyl)-2H-tetrazolium (MTS) assay (CellTiter 96R Aqueous One Solution Cell Proliferation Assay; Promega Corporation) (Shinqyochi et al., 2017). According to the manufacturer's protocol, ∼1 × 10⁴ cells were seeded into 96-well plates with 100 μL medium per well. The proliferation of cells was determined at different time points including 0, 12, 24, 48, 72, and 96 h after a 4 h incubation with 20 μL of CellTiter96R Aqueous One Solution (Promega Corporation). Colorimetric evaluation was performed in a MicroplateReader (Bio-Rad, Hercules, CA) at 490 nm.
Cell apoptosis
PE Annxin V Apoptosis Detection Kit 1 (BD) was used to analyze cell apoptosis (Gong et al., 2015). According to the instruction, each group of cells was collected after transfection for 48 h, washed twice with cold PBS and once in Binding Buffer, and then stained by Annexin V-PE and 7-aminoactinomycin D (7-AAD) for 15 min in the dark at 25°C. FACS Aria II flow cytometer (BD) was used to analyze cell apoptosis.
Cytokines detection
Flow fluorescence immunomicrobeads assay was used to detect 13 cytokines including interleukin-1β (IL-1β), interferon-α (IFN-α), IFN-γ, tumor necrosis factor-α (TNF-α), monocyte chemotactic protein-1 (MCP-1), IL-6, IL-8, IL-10, IL-12p70, IL-17A, IL-18, IL-23, and IL-33 secreted by BC cells (de Jager et al., 2003). Approximately 2 × 10⁵ cells were seeded into six-well plates with 2 mL medium per well for 72 h, 30 μL cell medium was mixed with LEGENDplex Multi-analyte flow assay kit (Biolegend, San Diego, CA) and incubated for 2 h in the dark at 25°C. The antibodies and streptavidin-phycoerythrin (SA-PE) were added into each medium for another 30 min incubation. The PE fluorescent signal of analyte-specific beads regions is quantified using flow cytometry MACSQuant Analyzer 10 (Miltenyi Biotec, Bergisch Gladbach, Germany), the concentrations of particular analytes were determined and the standard curve was generated using data analysis software (Biolegend).
Statistical analysis
All statistical analyses were performed using the Statistical Package for the Social Sciences (version 21.0; SPSS Company, Chicago, IL). Results were presented as the mean ± standard deviation. The χ 2 test was used to judge the influence of genotype on the risk of BC and the expression of KRT81. Renilla/luciferase reporter assays, cell proliferation, and apoptosis were compared by the Student's t test. p-Value ≤0.05 was considered statistically significant.
Results
Relationship of KRT81 SNP with risk of BC
A total of 182 BC patients and 130 controls were enrolled in this study. The average age of BC group was 51.48 ± 10.49 while control group was 50.57 ± 10.56, no statistical difference existed referring to age between BC patients and healthy controls (p = 0.452).
The miR-SNPs including RYR3 (rs1044129), KIAA0423 (rs1053667), C14orf101 (rs4901706), GOLGA7 (rs11337), and KRT81 (rs3660) were genotyped in BC patients and healthy controls (Table 2). The genotype distribution frequency for SNPs (rs1044129, rs1053667, rs4901706, and rs11337) showed no statistical difference between BC patients and healthy controls. For the rs3660 located in the gene KRT81, the frequencies of genotype CC and CG+GG were 5.5% and 94.5% in BC patients whereas 38.5% and 61.5% in controls. The CC genotype of BC patients was associated with a 0.093-fold decreased risk when compared with that of CG+GG genotype carrier (odds ratio, 0.093; 95% confidence interval, 0.045–0.193; p = 0.000). The relationship between genotype and clinical characteristics of BC patients was evaluated, no association could be obtained based on our analysis (data not shown).
Associations of the Five Single Nucleotide Polymorphisms with Breast Cancer Risk
BC, breast cancer; CI, confidence interval; OR, odds ratio.
rs3660 mediates KRT81 expression through miRNA binding site
Since miR-SNP of rs3660 in KRT81 gene affects BC risk, we evaluated the biological relevance of rs3660 with KRT81 expression. Immunostaining of KRT81 in BC tissue was performed in 70 BC patients and the HSCORE was calculated (Fig. 1A, B). As shown in Table 3, the CC genotype was associated with lower expression of KRT81 than that of the GG+GC genotype (χ 2 = 4.608, p = 0.032). To evaluate the binding affinity between miRNA and KRT81 genotype, the modified psiCheck2 vector containing either the GG or CC genotype of KRT81 was constructed in the 3′-UTR of the Renilla luciferasegene and transfected into MCF-7 cell line. Consistent with immunostaining results, a dramatic reduction of Renilla luciferase activity was observed in CC genotype of KRT81 (Fig. 1C) (p = 0.025). These results indicate that the rs3660 SNP in the 3′-UTR of KRT81 may change the binding affinity between miRNA and KRT81 so as to affect KRT81 expression.

The rs3660 SNP was linked with KRT81 expression in BC patients.
Associations of the Genotype with KRT81 Expression
KRT81 knockdown inhibits the proliferation of MDA-MB-231 cells
We analyzed the expression level of KRT81 of MDA-MB-231, MCF-7, MDA-MB-453, and T47D cell lines via western blotting. As shown in Figure 2A, the MDA-MB-231 cell displayed the highest expression level of KRT81, so the MDA-MB-231 was used for subsequent knockdown analysis, the successful knockdown of KRT81 was confirmed by western blot analysis (Fig. 2B). To investigate the effect of KRT81 on proliferation of MDA-MB-231 cells, MTS assay was performed to measure proliferation capacity of MDA-MB-231 cells with three different treatments: MDA-MB-231 cell transfected with psi-U6-KRT81shRNA, psi-U6, and MDA-MB-231 cell (blank control). Proliferation of MDA-MB-231 cells significantly decreased after psi-U6-KRT81shRNA transfection from 24 to 96 h compared with that of psi-U6 and blank control group (p < 0.01, Fig. 2C, D). This result indicates that KRT81 knockdown could inhibit the growth of MDA-MB-231 cells in a time-dependent manner.

KRT81 knockdown inhibits proliferation, induces apoptosis of MDA-MB-231 cells.
KRT81 knockdown induces apoptosis of MDA-MB-231 cells
Apoptosis was measured by Annexin V-PE/7-AAD double staining with flow cytometry to further investigate the mechanism of the cell proliferation inhibition by KRT81. MDA-MB-231 cell line transfected with psi-U6-KRT81shRNA displayed higher apoptosis rate than that of MDA-MB-231 transfected with psi-U6 and blank control (p < 0.01, Fig. 2E, F). This result demonstrated that knockdown of KRT81 could induce apoptosis of MDA-MB-231 cells.
KRT81 knockdown reduces the secretion of MCP-1
Cytokines from the medium of MDA-MB-231 cell were detected by flow fluorescence immunomicrobeads assay. Among 13 cytokines including IL-1β, IFN-α, IFN-γ, TNF-α, MCP-1, IL-6, IL-8, IL-10, IL-12p70, IL-17A, IL-18, IL-23, and IL-33, the level of MCP-1 decreased dramatically upon psi-U6-KRT81shRNA transfection (p < 0.01, Fig. 2G, H). No significant changes could be found with other cytokines upon psi-U6-KRT81shRNA transfection (data not shown). This result shows that knockdown KRT81 gene reduces the secretion of MCP-1 in BC cells.
Overexpression of KRT81 promotes proliferation and inhibits apoptosis of MCF-7 cells
Since MCF-7 displayed low KRT81 expression, we used this cell line for subsequent overexpression assays. Western blot was used to confirm successful overexpression of KRT81 (Fig. 3A). Cells transfected with KRT81-pEZ-Lv201 promoted proliferation from 48 to 96 h (p < 0.01, Fig. 3B, C) compared with cells transfected with pEZ-Lv201 or blank control cells. What's more, MCF-7 cell line transfected with KRT81-pEZ-Lv201 displayed lower apoptosis rate than that of cells transfected with pEZ-Lv201 (p = 0.019, Fig. 3D, E) or blank control (p < 0.01, Fig. 3D, E). These data demonstrated that overexpression of KRT81 could promote the proliferation and inhibit the apoptosis of MCF-7 cells.
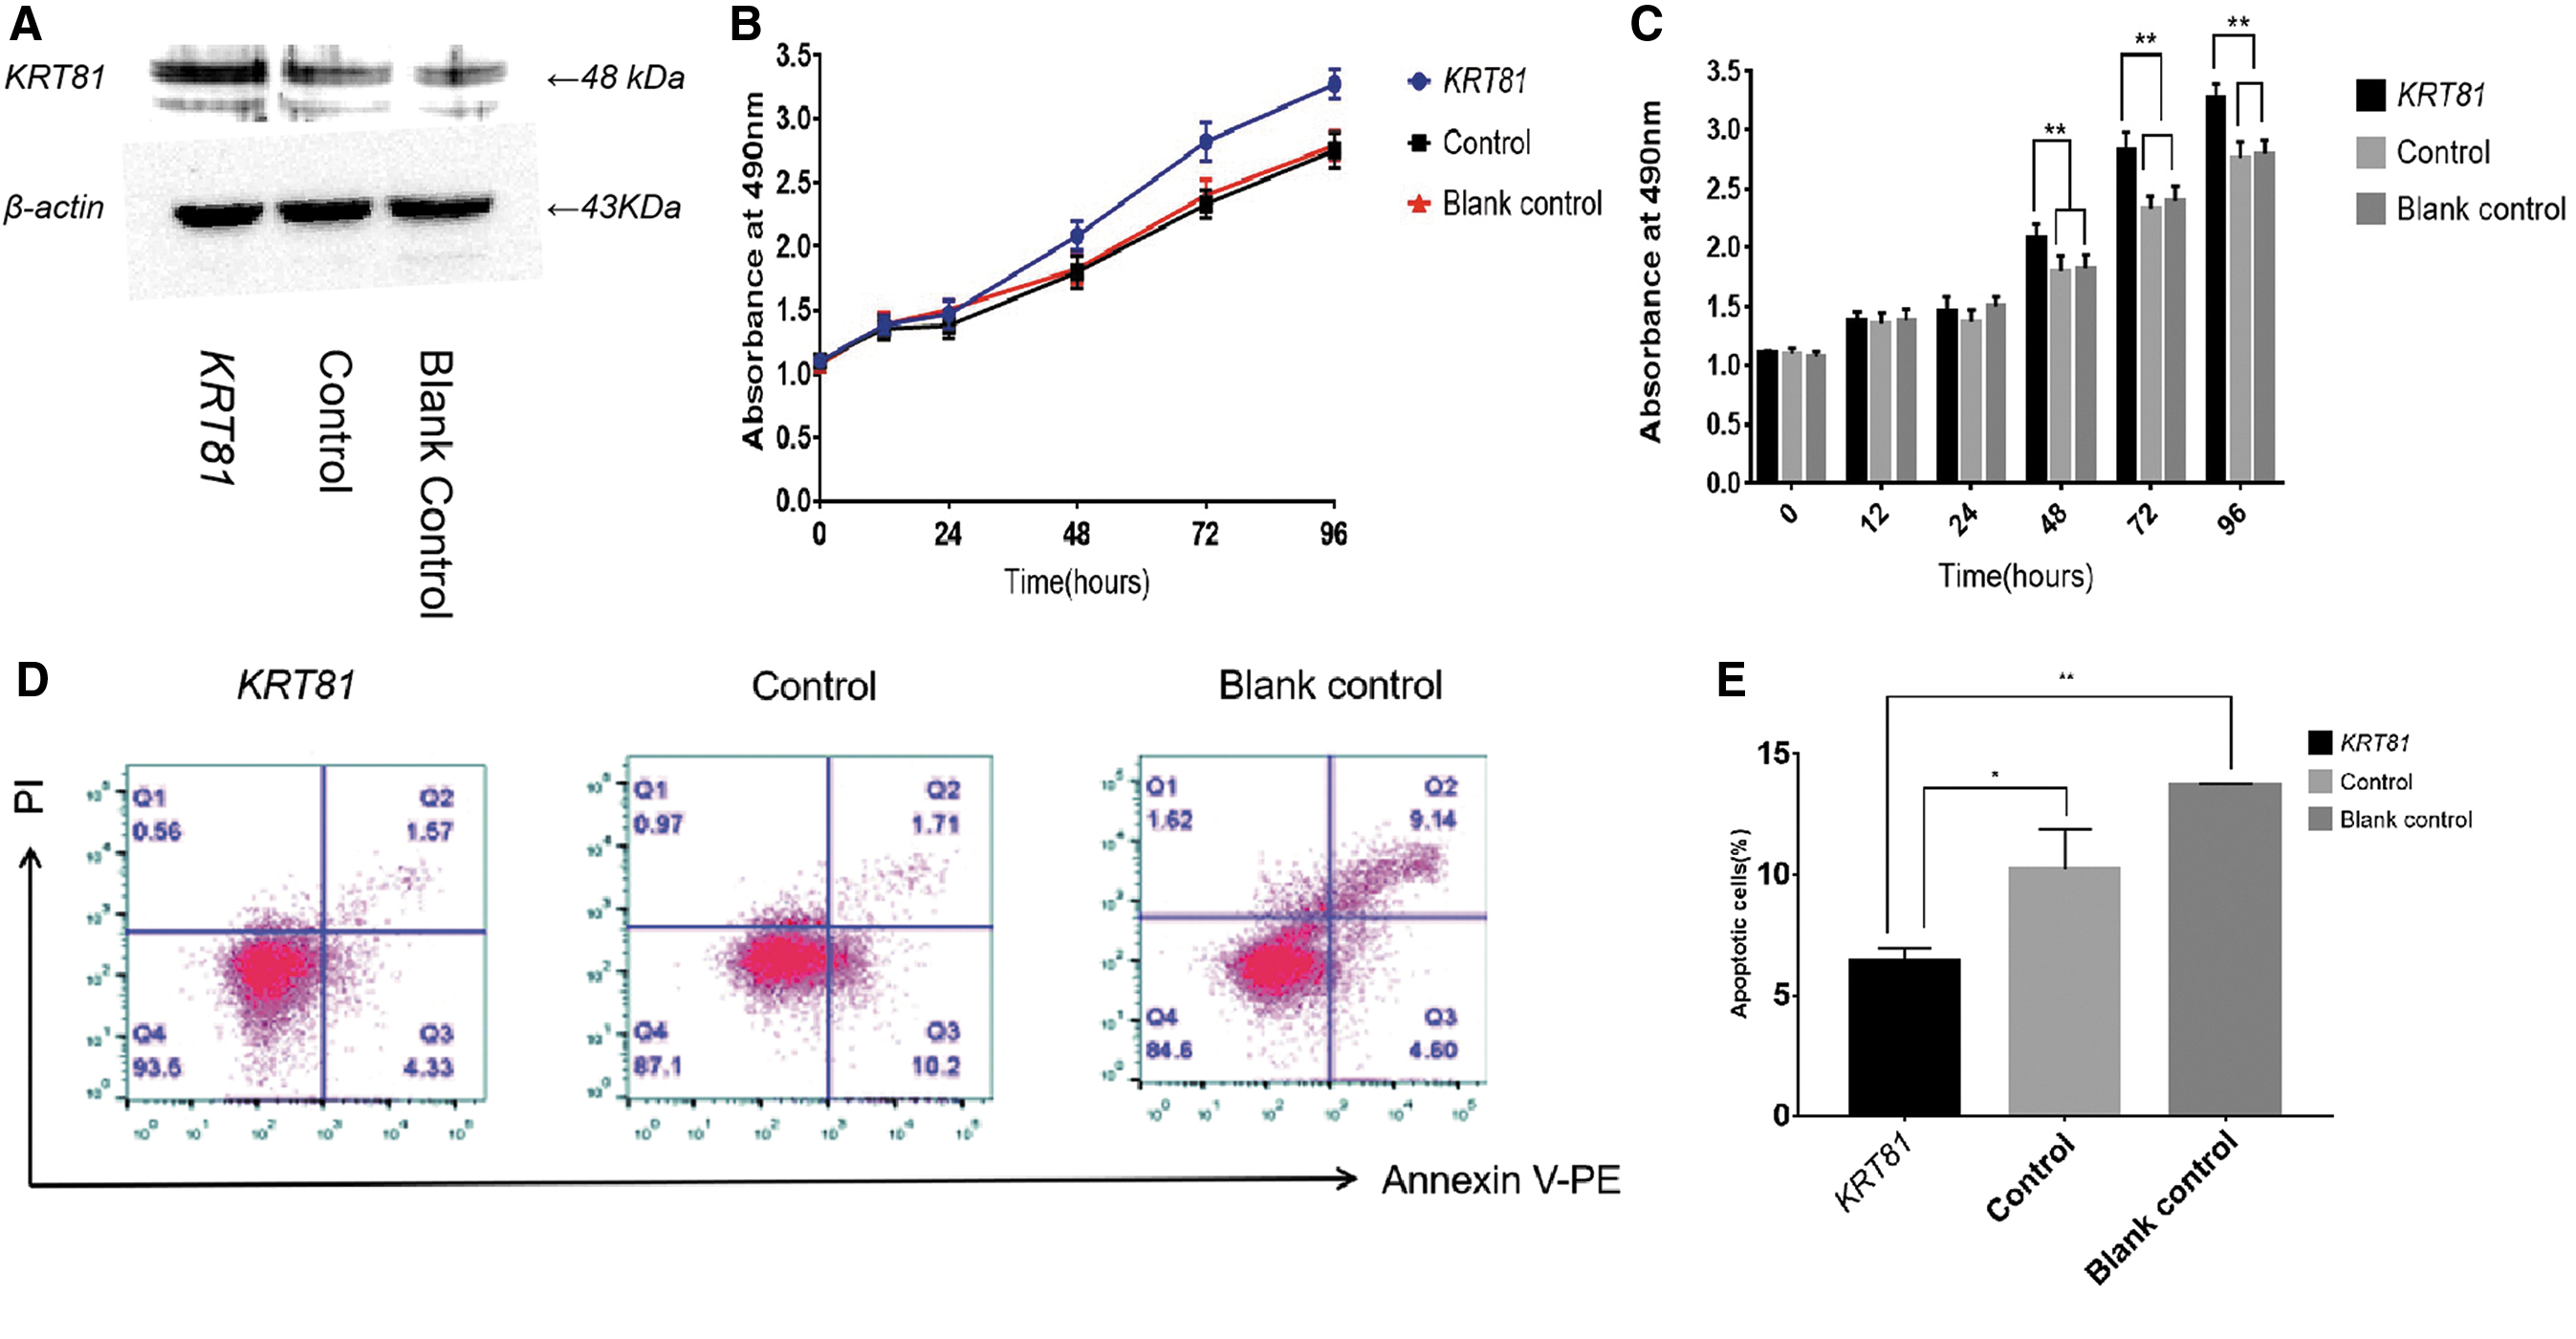
Overexpression of KRT81 promotes proliferation and inhibits apoptosis of MCF-7 cells.
Discussion
In this study, we examined five miR-SNPs including RYR3 (rs1044129), KIAA0423 (rs1053667), C14orf101 (rs4901706), GOLGA7 (rs11337), and KRT81 (rs3660) for their associations with BC risk, rs3660 in the 3′-UTR of KRT81 was identified for its associated with BC risk. The CC allele appears to associate with low KRT81 expression by immunohistochemical analysis, but the tissue availability with less CC samples influence the statistical significance of our analysis. Thereby we performed Renilla luciferase reporter assays to further evaluate the relationship between CC genotype and KRT81 expression. We found that the G to C transition might destroy the G:C binding site so as to reduce the binding affinity between miRNA and KRT81 for decrease of KRT81 expression. The subsequent functional analysis proved that KRT81 knockdown could inhibit proliferation and promote apoptosis of BC cells. More and more researchers suggest that miR-SNPs contribute to cancer risk via modify the expression of their binding gene (Horikawa et al., 2008; Hu et al., 2008; Landi et al., 2008; Gao et al., 2009; Wang et al., 2012a, 2016a, 2016b). KRT81 was proved to play an oncogenic role in carcinogenesis and the GG genotype of rs3660 is associated with poor overall survival in non-small-cell lung cancer (Lee et al., 2015). Another study also shows that rs3660 with C allele linking for reduced KRT81 expression could modify the outcome of multiple myeloma through KRT81 knockdown and resulted in reduction of proliferation (de Larrea et al., 2012). As for BC cells, knocked down of KRT81 caused decreased migration and invasion of MDA-MB-231 cells (Nanashima et al., 2017). Consistent with these previous studies, we found that KRT81 knockdown might influence BC tumorigenesis and rs3660 could modify BC development through changing the expression of KRT81 and thereby inhibit proliferation and promote apoptosis of BC cells.
KRT81 encodes a type II keratin that could modulate the process of cell signaling by maintaining the stability and integrity of epithelial tissues as the intermediate filament-forming proteins of epithelial cells (Coulombe and Omary, 2002; Karantza, 2011; Xie et al., 2014). Emerging evidence suggests that keratin can promote malignant transformation, cancer cell invasion, and metastasis as diagnostic and prognostic makers for tumors (Moll et al., 1982, 2008; Sorlie et al., 2001; Magin et al., 2007; Karantza, 2011). Our study further showed that knockdown KRT81 resulted in reduced secretion of MCP-1, also known as chemokine (C-C motif) ligand 2 (CCL2) that contributes to angiogenesis and tumor progression (Salcedo et al., 2000; Li et al., 2011; Wang et al., 2012b; Agresti et al., 2019; Mulholland et al., 2019). The true mechanism that KRT81 modifies BC development through MCP-1 related angiogenesis needs to be evaluated in the subsequent research.
Conclusion
In conclusion, the KRT81 expressional change modulated by rs3660 miR-SNP could modify the carcinogenesis of BC, thereby KRT81 would be a new target for BC treatment due to its role in proliferation and apoptosis of BC cells.
Footnotes
Disclosure Statement
No competing financial interests exist.
Funding Information
This work was supported by The Natural Science Foundation of Hebei Province of China (H2019206428).