




Abstract
Sepsis is a life-threatening disorder and leads to organ dysfunction and death. Therefore, searching for more alternative biomarkers is of great significance for sepsis assessment and surveillance. In our study, the gene expression profiles of 163 samples from healthy controls and septic patients were analyzed and 8 gene co-expression modules were identified by constructing weighted gene co-expression network. The blue and yellow modules showed close correlations with the phenotypic trait “days postsepsis.” Besides, differentially expressed genes (DEGs) over time in septic patients were screened using Short Time-series Expression Miner (STEM) program. The intersection of genes in the blue and yellow modules and DEGs, which were significantly enriched in “HTLV-1 infection” pathway, was analyzed with protein-protein interaction network. The logistic regression model based on these eight mRNAs was constructed to determine the type of the sample reliably. Eight vital genes CECR1, ANXA2, ELANE, CTSG, AZU1, PRTN3, LYZ, and DEFA4 presented high scores and may be associated with sepsis, which provided candidate biomarkers for sepsis.
Introduction
As a life-threatening condition, sepsis is characterized by systemic inflammation from infection, leading to organ dysfunction and death (Angus and Wax, 2001; Lever and Mackenzie, 2007). According to the Third International Consensus Definitions for Sepsis and Septic Shock, the definition of sepsis is a life-threatening organ dysfunction caused by dysregulated host response to infection, and septic shock is a subset of sepsis in which particularly profound circulatory, cellular, and metabolic abnormalities are associated with a greater risk of mortality than sepsis alone (Keeley et al., 2017). Sepsis is constituted by several infection progressions, including systemic inflammatory response syndrome, severe sepsis, and septic shock. The syndrome includes fever, hyperventilation, leukocytosis, organ dysfunction, and hypotension (Ludwig and Hummon, 2017).
In the developed countries, the incidence of sepsis varied from 66 to 300 per 100,000 population (Angus et al., 2001; Harrison et al., 2006). The mortality rate of patients with sepsis and severe sepsis was 25–30%, and for patients with septic shock, the mortality rate was 40–50% (Cohen et al., 2015). About 30% of intensive care unit patients developed sepsis, and for hospitalized patients in developed countries, the occurrence rate was 2% (Martin and Greg, 2012). Due to the antibiotic resistance and aging population, the incidence rate of sepsis has been still increasing in the developed countries (Kumar et al., 2011).
The therapies for sepsis aimed to improve tissue oxygenation and perfusion, and inhibit infection of causative organism, including antimicrobial therapy with antibiotics, intravenous fluids, source control, monitoring response to treatment, lactate monitoring, airway support and oxygen, vasopressors, corticosteroids, transfusion of blood products, and glucose control (Keeley et al., 2017). Nevertheless, owing to lack of effective therapy for sepsis prognosis, the clinical outcome remained poor (Verdonk et al., 2017).
Early and accurate diagnosis is vital for sepsis treatment, which can suppress the progression of septic shock. The microbial determination in the blood was usually adopted for the detection, but the rate of accuracy was only 30–40% (Dellinger et al., 2013; Cohen et al., 2015). The traditional biomarkers consist of C-reactive protein, procalcitonin, soluble urokinase-type plasminogen activator receptor, interleukin-6, and so on, with limitation in specificity; White blood cell counts and serum lactate levels were also used in diagnosis (Ludwig and Hummon, 2017). Transcriptomic changes conducted by RNAseq exhibit high sensitivity and unlimited dynamic range, but the price was expensive and the related bioinformatics was difficult (Langley and Wong, 2017).
Metabolomics and proteomic research were carried out to explore novel biomarkers for sepsis. However, due to the variable sample preparation methods, data acquisition approaches, and data analysis parameters, the proposed signature could not be applied to clinical implementation (Ludwig and Hummon, 2017). It is suggested that genes S100P, SERPINA1, and FCER1 G may be involved in sepsis (Yang and Li, 2017). A previous study showed that vitamin D receptor gene polymorphisms were related to the risk and mortality of sepsis among Serbian population. However, the vitamin D level in serum was not measured (Zeljic et al., 2017). Several miRNAs were reported as biomarkers for sepsis and may be helpful for diagnosis. Although many biomarkers were identified, some of them did not present high specificity and sensitivity due to the difficulty in interpreting the clinical features of sepsis (Huang et al., 2014).
Therefore, it is urgent to explore more alternative and effective biomarkers for sepsis. In our study, by constructing weighted gene co-expression network and analyzing (WGCNA) the correlation of module with phenotype, eight genes CECR1, ANXA2, ELANE, CTSG, AZU1, PRTN3, LYZ, and DEFA4 were screened and associated with sepsis with high expression level in septic patients. The logistic regression model based on these eight mRNAs was constructed to further determine the type of the sample reliably. They will provide potential biomarkers for the diagnosis and surveillance of sepsis.
Materials and Methods
Gene expression profiles
This study did not involve any patients or animals, thus IRB approval was not required. The gene expression profiles of 163 whole blood samples were obtained from the GEO database, accession no.: GSE54514). The subjects were assigned into three groups: healthy controls (n = 18), sepsis nonsurvivors (n = 9), and sepsis survivors (n = 26). For healthy controls, whole blood samples were collected on day 1 and 5; for sepsis nonsurvivors, whole blood samples were collected for 5 days (day 1: 9 samples, day 2: 7 samples, day 3: 7 samples, day 4: 5 samples, and day 5: 3 samples); for sepsis survivors, whole blood samples were also collected for 5 days (day 1: 26 samples, day 2: 24 samples, day 3: 21 samples, day 4: 14 samples, and day 5: 11 samples). The gene expression profilings were performed using Illumina Sentrix HT-12_v3_BeadChip arrays (Illumina, San Diego, Calif).
Background correction and normalization of the data were carried out with the “rma” method of Affy Bioconductor package. The mapping between probes and gene symbols was conducted using the annotation package. Probes that matched multiple genes were excluded and the median value was adopted as an expression value for genes that matched multiple probes.
Construction of gene co-expression module
The WGCNA was conducted using WGCNA R package. The method was as follows: first, the Pearson correlation coefficient of genes was calculated and the similarity matrix was created. Then the similarity matrix was transformed to adjacency matrix by αij = |(1+cor(xi+yj))/2|β. β denoted the soft threshold and the similarity was raised. The soft threshold was determined complied with the scale-free attribute of the network. In brief, to ensure that the criterion of scale-free network was satisfied, the correlation coefficient between log(k) and log(p(k)) should be greater than 0.85, where k indicated the intramodular connectivity and p(k) indicated the frequency distribution of the connectivity. The adjacency matrix was then transformed into topological matrix using topological overlap measure (TOM) = (∑μ≠ijαiμαμj+αij)/(min(∑μαiμ+∑μαjμ)+1-αij), where TOM indicated the relative interconnectedness between two genes.
The 1-TOM, denoting similarity between two genes, was adopted for hierarchical clustering analysis. Modules were identified using dynamic branch cutting method. The dynamic branch cutting method included two steps: first, identifying the primary network that meets the following conditions: a. meet the predefined minimum gene number of gene modules, b. each cluster must be significantly different from other clusters around it, and c. the core gene of each cluster at the tip of tree branch should be closely connected; second, the unassigned genes were tested, if there was a gene close enough to a primary network, the gene would be assigned to this cluster, and eventually formed a gene module. The genes that were closely interconnected were placed into the same module (min module size = 30). The representative gene of each module was defined as module eigengene (ME), which reflected the expression value of corresponding module.
Correlation of gene co-expression module with phenotypic trait
The ME of corresponding gene co-expression module (GCM) was calculated, and then the correlation coefficient of ME with phenotypic trait was calculated using Spearman's rank test to select the vital modules. Significant threshold was set as p-value <0.05.
Analysis of gene expression in septic patients
The gene expression values of patients were determined at each time point (day 1, 2, 3, 4, and 5) and the mean expression values were calculated. Short Time-series Expression Miner (STEM) program was used to analyze temporal gene expression profiles. Clusters that were upregulated or downregulated over time were selected and corresponding genes were exported. Then the intersection of them and genes in the vital modules was obtained for further analysis.
Functional annotation of the significant genes
Kyoto Encyclopedia of Genes and Genomes (KEGG) pathway enrichment for the significant genes was performed using KOBAS (version 3.0). The threshold was set as p-value <0.05.
Protein-protein interaction network analysis of the significant genes
Protein-protein interaction (PPI) network analysis was carried out on the common genes of vital phenotype-related modules and differentially expressed clusters using STRING database. Combined score >0.4 was used as threshold to screen the interactions between genes. Topological structure of PPI network was analyzed with cytohubba of Cytoscape (version 3.6.1).
Construction of logistic regression model
Logistic regression is a common method in classification, which is to predict a classification result based on a set of variables. The meaning in this study was the amount of mRNA expression to predict the type of sample, that is, whether the samples were sepsis samples. We used fivefold cross validation to divide 163 sample data in the GSE54514 data set into a training set and a validation set for the construction and verification of the logistic regression model.
Results
The normalized gene expression profiles
According to Figure 1, gene expression profiles after normalization presented high quality. The gene expression profiles included 163 samples and 13,620 genes, with genes that were not available removed. The variances of gene expression values were calculated and genes with expression values deviated from the mean value by 25% were screened (n = 3405). According to the clustering analysis, there were no outlier samples (Fig. 2A).
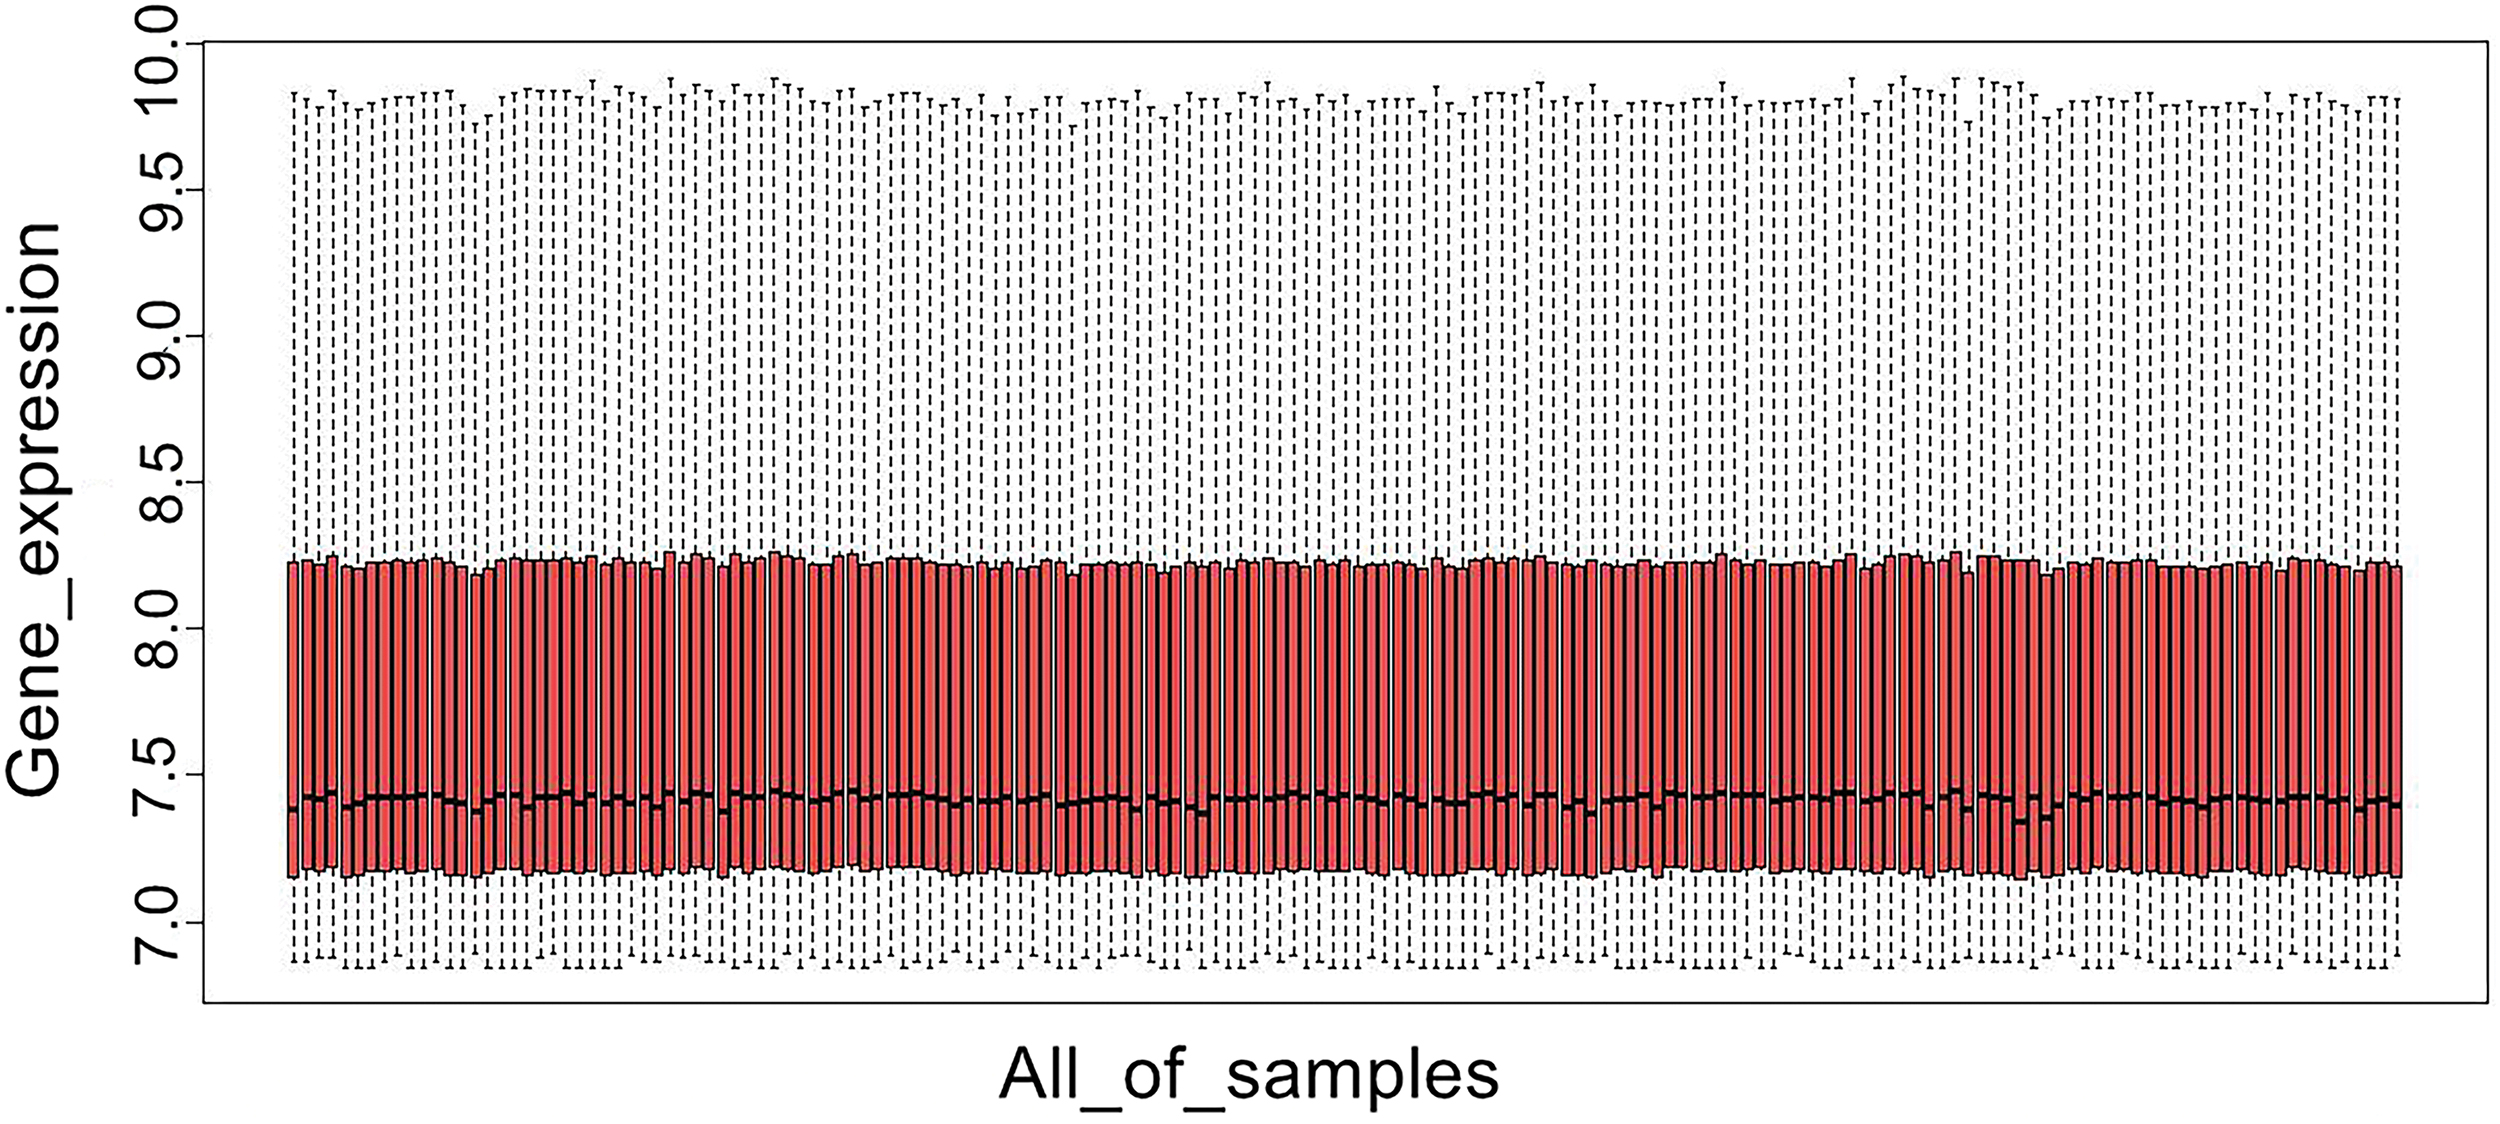
After background correction and normalization, the gene expression profiles exhibited high quality. Color images are available online.
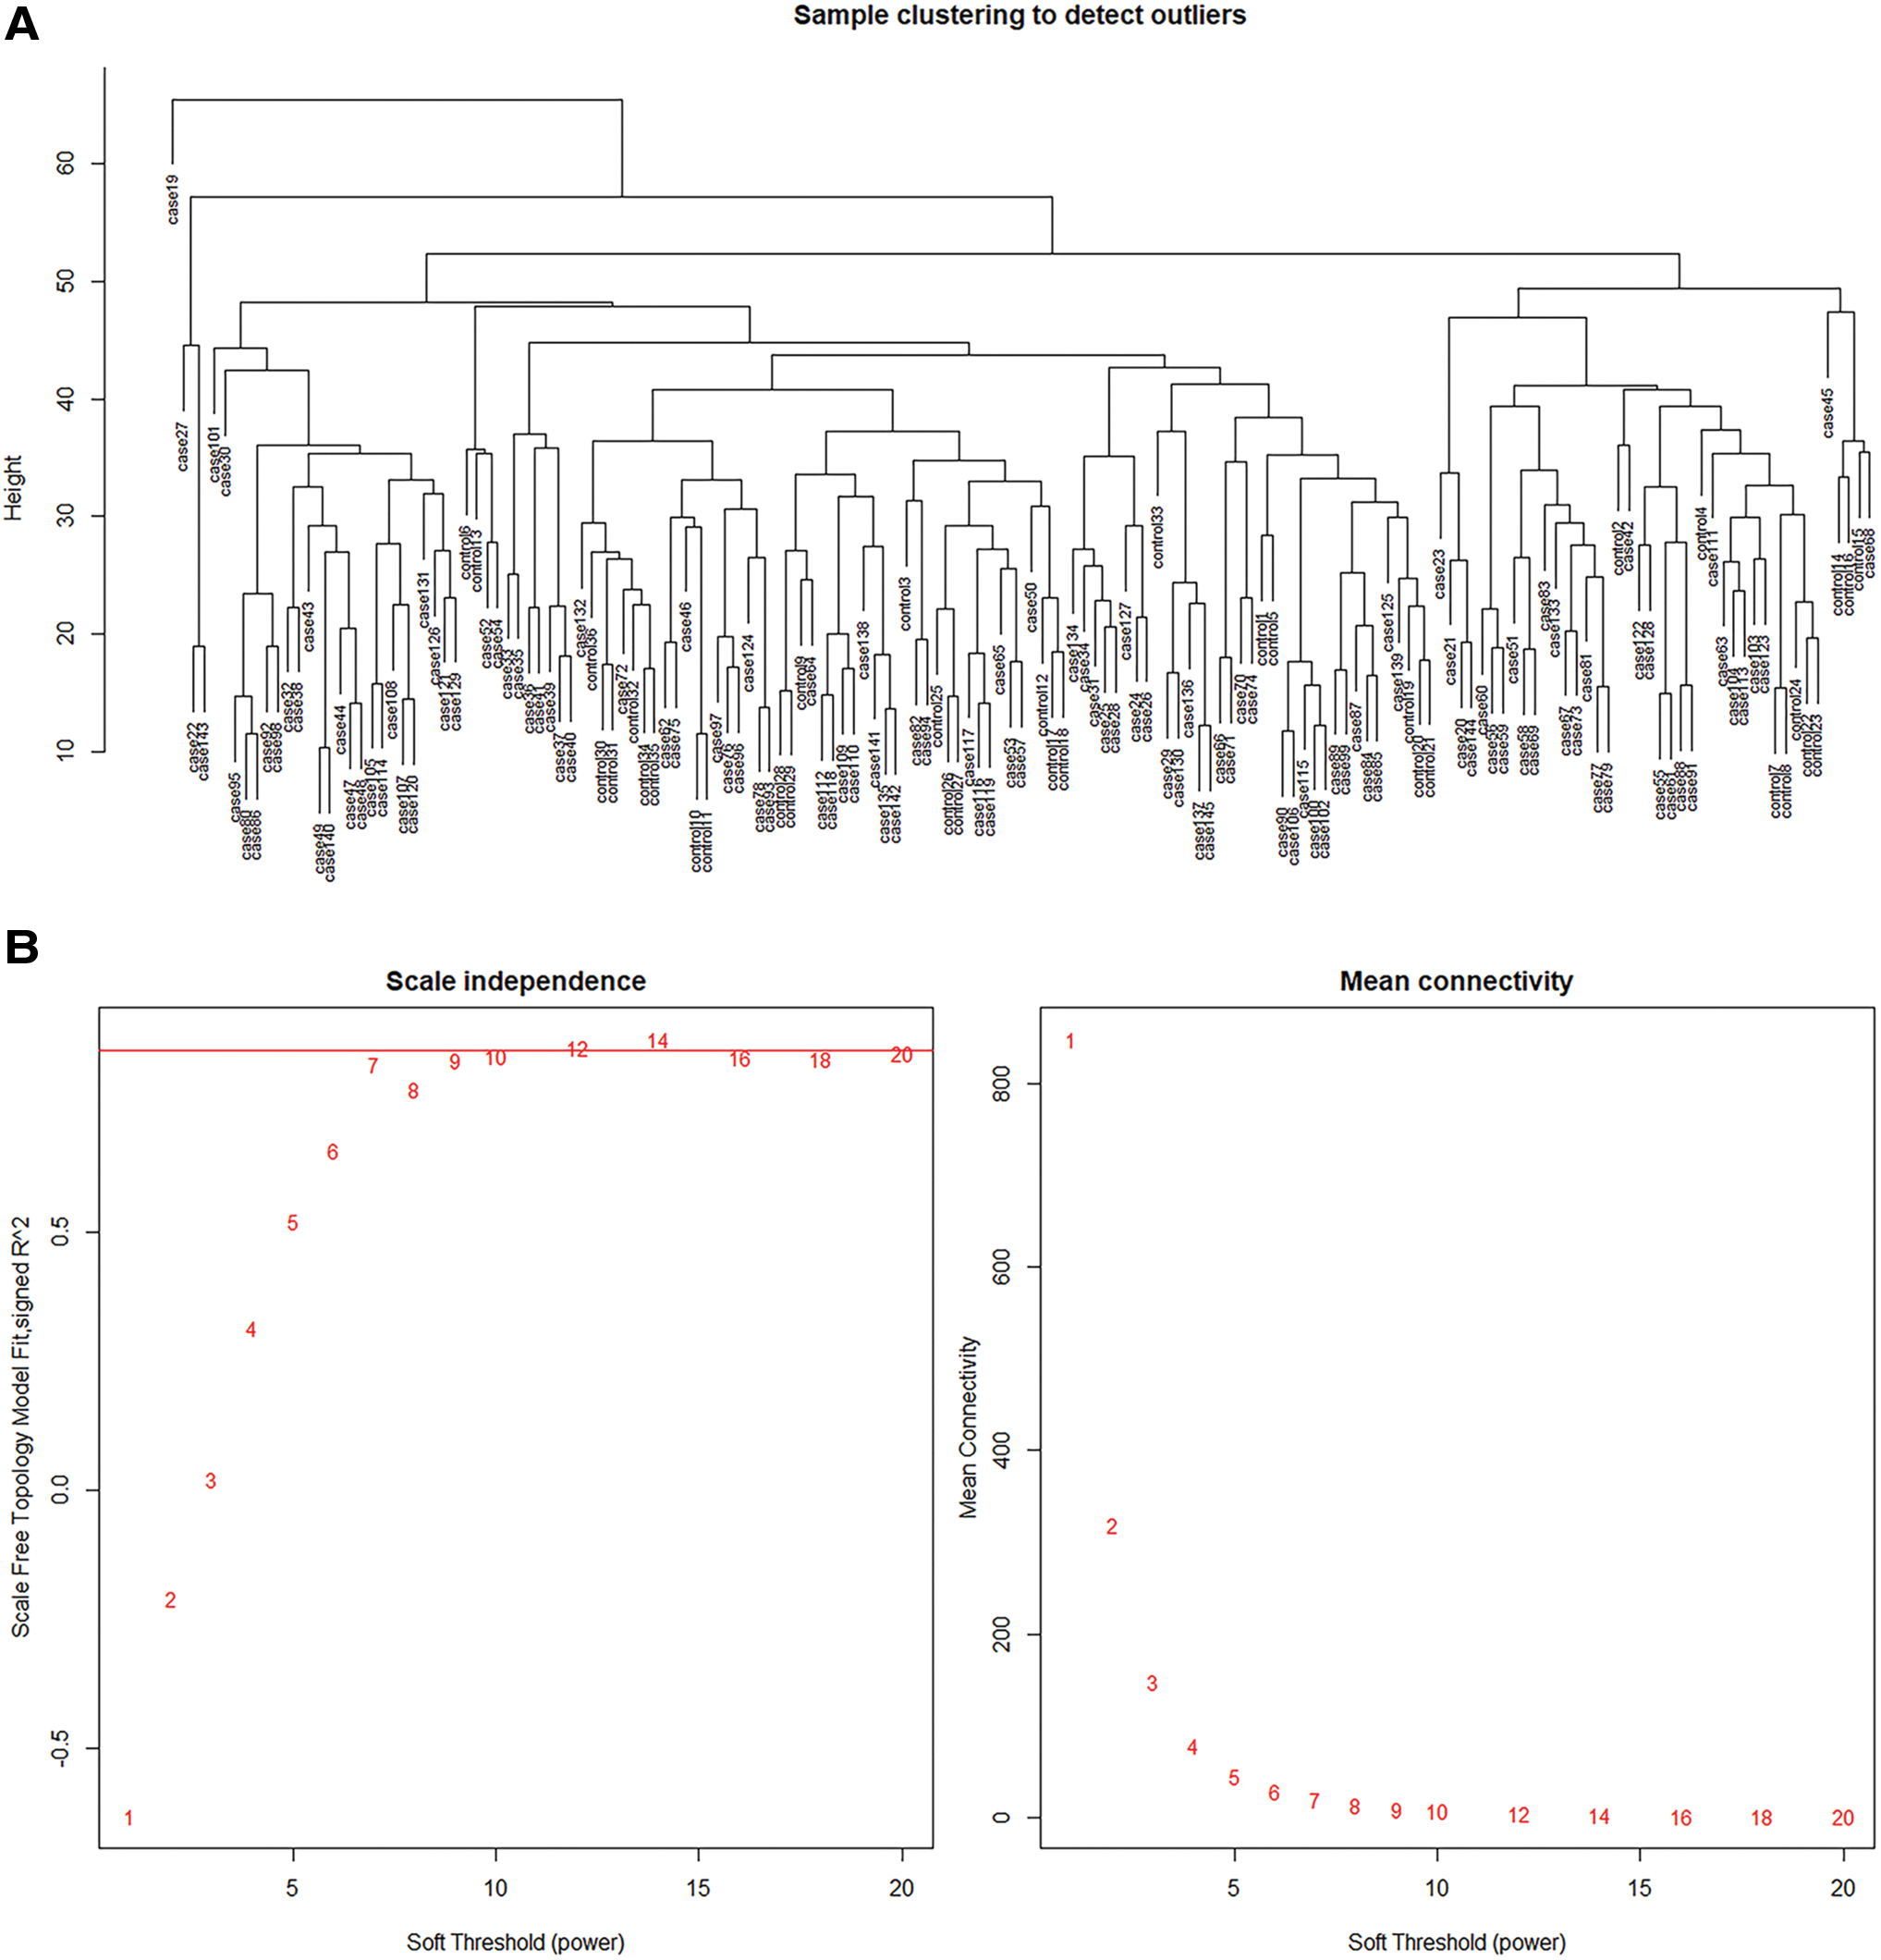
Clustering analysis of the samples and optimal soft threshold selection.
Gene co-expression modules
Based on criteria of scale free of network, the soft threshold was selected as β = 12 (Fig. 2B). Clustering analysis was conducted to identify GCMs, and a total of eight modules were obtained, with the height set as 0.25. Genes that could not be grouped into other modules, were added to the gray module (Fig. 3A).

Gene co-expression modules and analysis of module-trait correlations.
Identification of vital modules in septic patients
The information of phenotypic traits is shown in Table 1. Correlations of modules with phenotypic traits were calculated based on ME calculated. We chose the “days postsepsis” as clinical phenotypic traits for sepsis. Figure 3B displayed that the blue module was positively correlated with phenotype “days postsepsis,” but the yellow module was negatively correlated with this phenotype. The genes of blue module (n = 520) and yellow module (n = 217) were exported, respectively, for further analysis.
The Phenotypic Traits of Sepsis
Genes associated with progression of septic patients
Colored clusters in Figure 4A indicated the significantly enriched clusters (p-value <0.05). Twenty-two genes were upregulated in green cluster, but 11 genes were downregulated in purple cluster (Fig. 4B, C and Table 2). Because there are many genes, we used the heat maps of the expressions of the genes in # 11 and # 22 at different stages in different samples. It could be seen that the expression of 22 genes increased significantly with time (1–5 day) in green cluster (Fig. 4D), but the expression of 11 genes decreased significantly with time (1–5 day) in pure cluster (Fig. 4E).

Clustering of gene expression profiles for septic patients at different time points (day 1–5).
Genes That were Upregulated/Downregulated Over Time in Septic Patients
Gene function analysis of the significant genes
The intersection of genes in the blue and yellow modules and genes screened by STEM was obtained (n = 29) (Table 3). KEGG pathways were enriched with p-value <0.05 as threshold. The top 20 significantly enriched pathways are shown in Figure 5. It revealed that 29 genes were significantly enriched in HTLV-1 infection, salivary secretion, systemic lupus erythematosus, and transcriptional misregulation in cancer pathways.
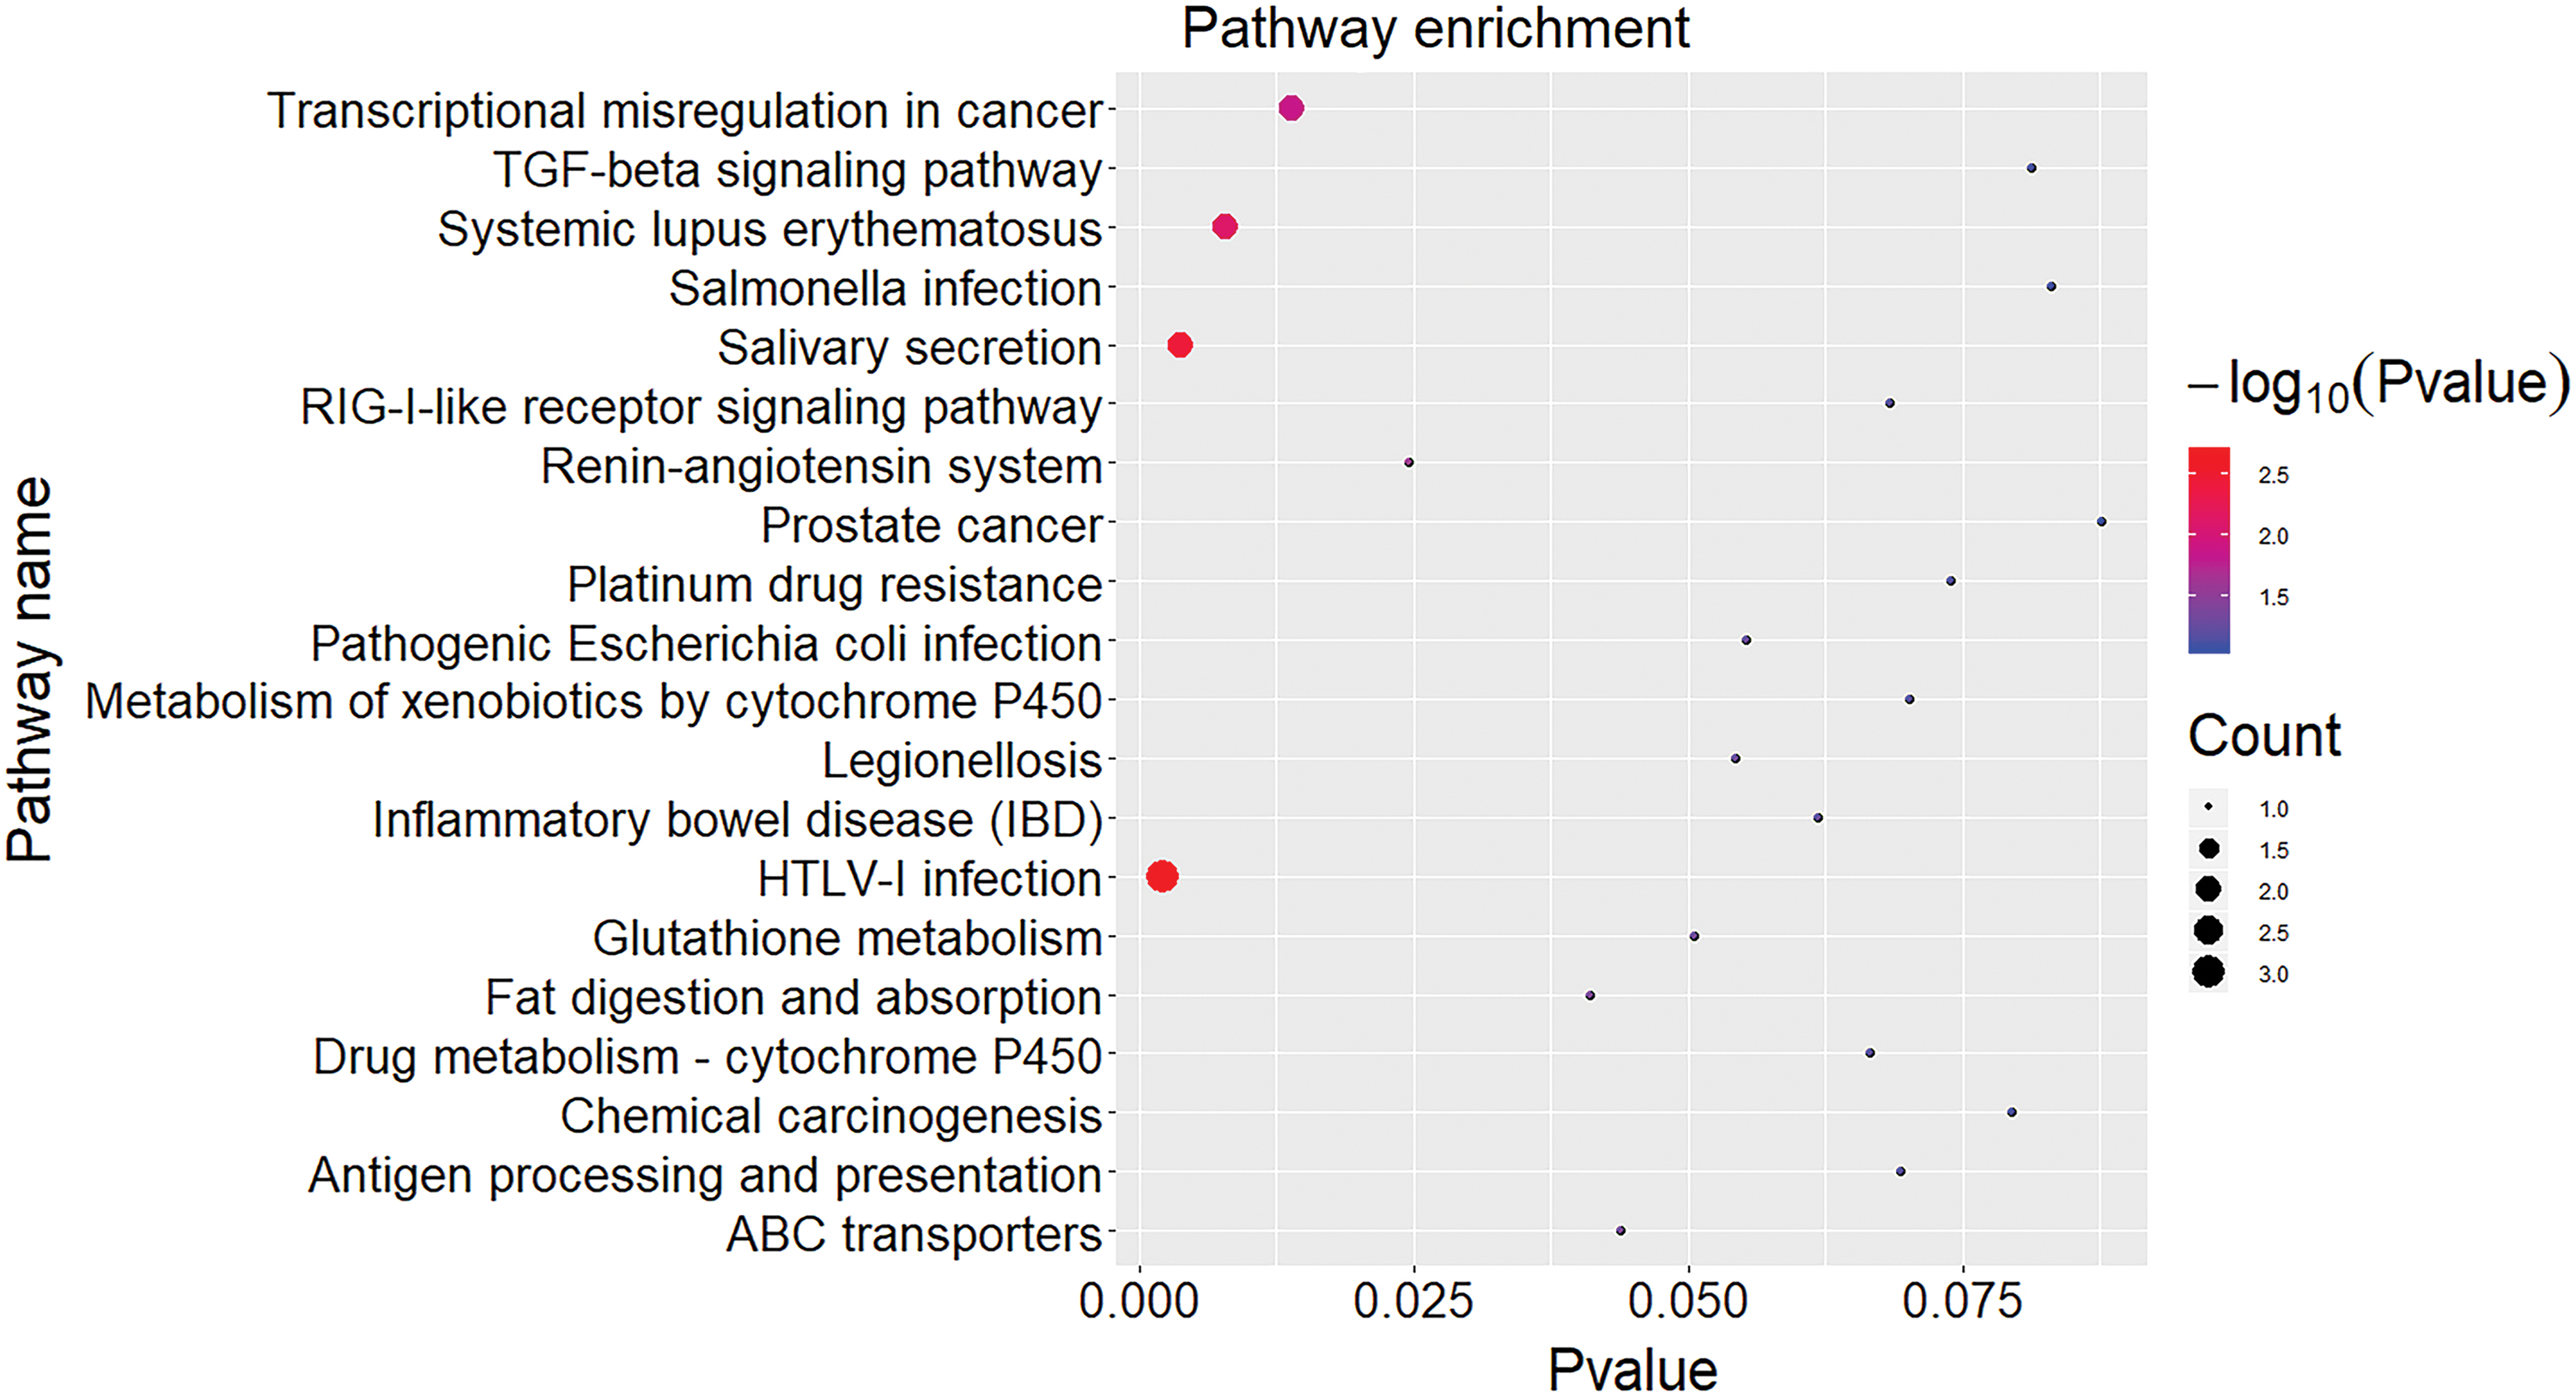
Function enrichment analysis of the intersected genes. The genes were significantly enriched in HTLV-1 infection, salivary secretion, systemic lupus erythematosus, and transcriptional misregulation in cancer pathways. Color images are available online.
The Intersection of Genes in the Blue and Yellow Modules (WGCNA, Figure 3B) and Genes Screened by STEM
STEM, Short Time-series Expression Miner; WGCNA, weighted gene co-expression network analysis.
Identification of vital genes in septic patients
PPI network analysis was conducted on the selected 29 genes. Protein isoforms encoded by the same gene were merged. The nodes in Figure 6A represented corresponding proteins and letters in the node indicated gene symbol. Spiral structure in node suggested the three-dimensional structure of this protein was known. The information of nodes and edges is shown in Table 4. Figure 6B revealed that the analysis result of PPI network and nodes with score >0.5 were screened with darker color representing higher score. The selected eight vital genes (CECR1, ANXA2, ELANE, CTSG, AZU1, PRTN3, LYZ, and DEFA4) are shown in Table 5.

PPI network analysis of the intersected genes.
Information of Nodes and Edges in Figure 6
PPI, protein-protein interaction.
The Screened Eight Vital Genes
Construction and evaluation of logistic regression diagnostic model
We incorporated these eight mRNAs to construct the logistic regression model, and found that there was no extreme point that affected the accuracy of the model (Fig. 7A). Then we used the fivefold cross validation to evaluate the reliability of the model. First, the samples were randomly divided into five parts. Each time, four of the data were used as the training sets to incorporate these eight mRNAs to construct logistic regression model, and another data were used as the verification set to verify. The process was repeated five times. The process of cross validation could ensure that every subsample was trained and tested, which could reduce the errors and more truly reflect the detection ability of the model. The result showed that the five logistic regression models constructed using the fivefold cross-validation method had AUCs of 0.8086, 0.7391, 0.7593, 0.8594, and 0.8707 (Fig. 7B), respectively, with an average AUC of 0.8099. The above results demonstrated that the model constructed based on these eight mRNAs could be used to determine the type of the sample reliably.
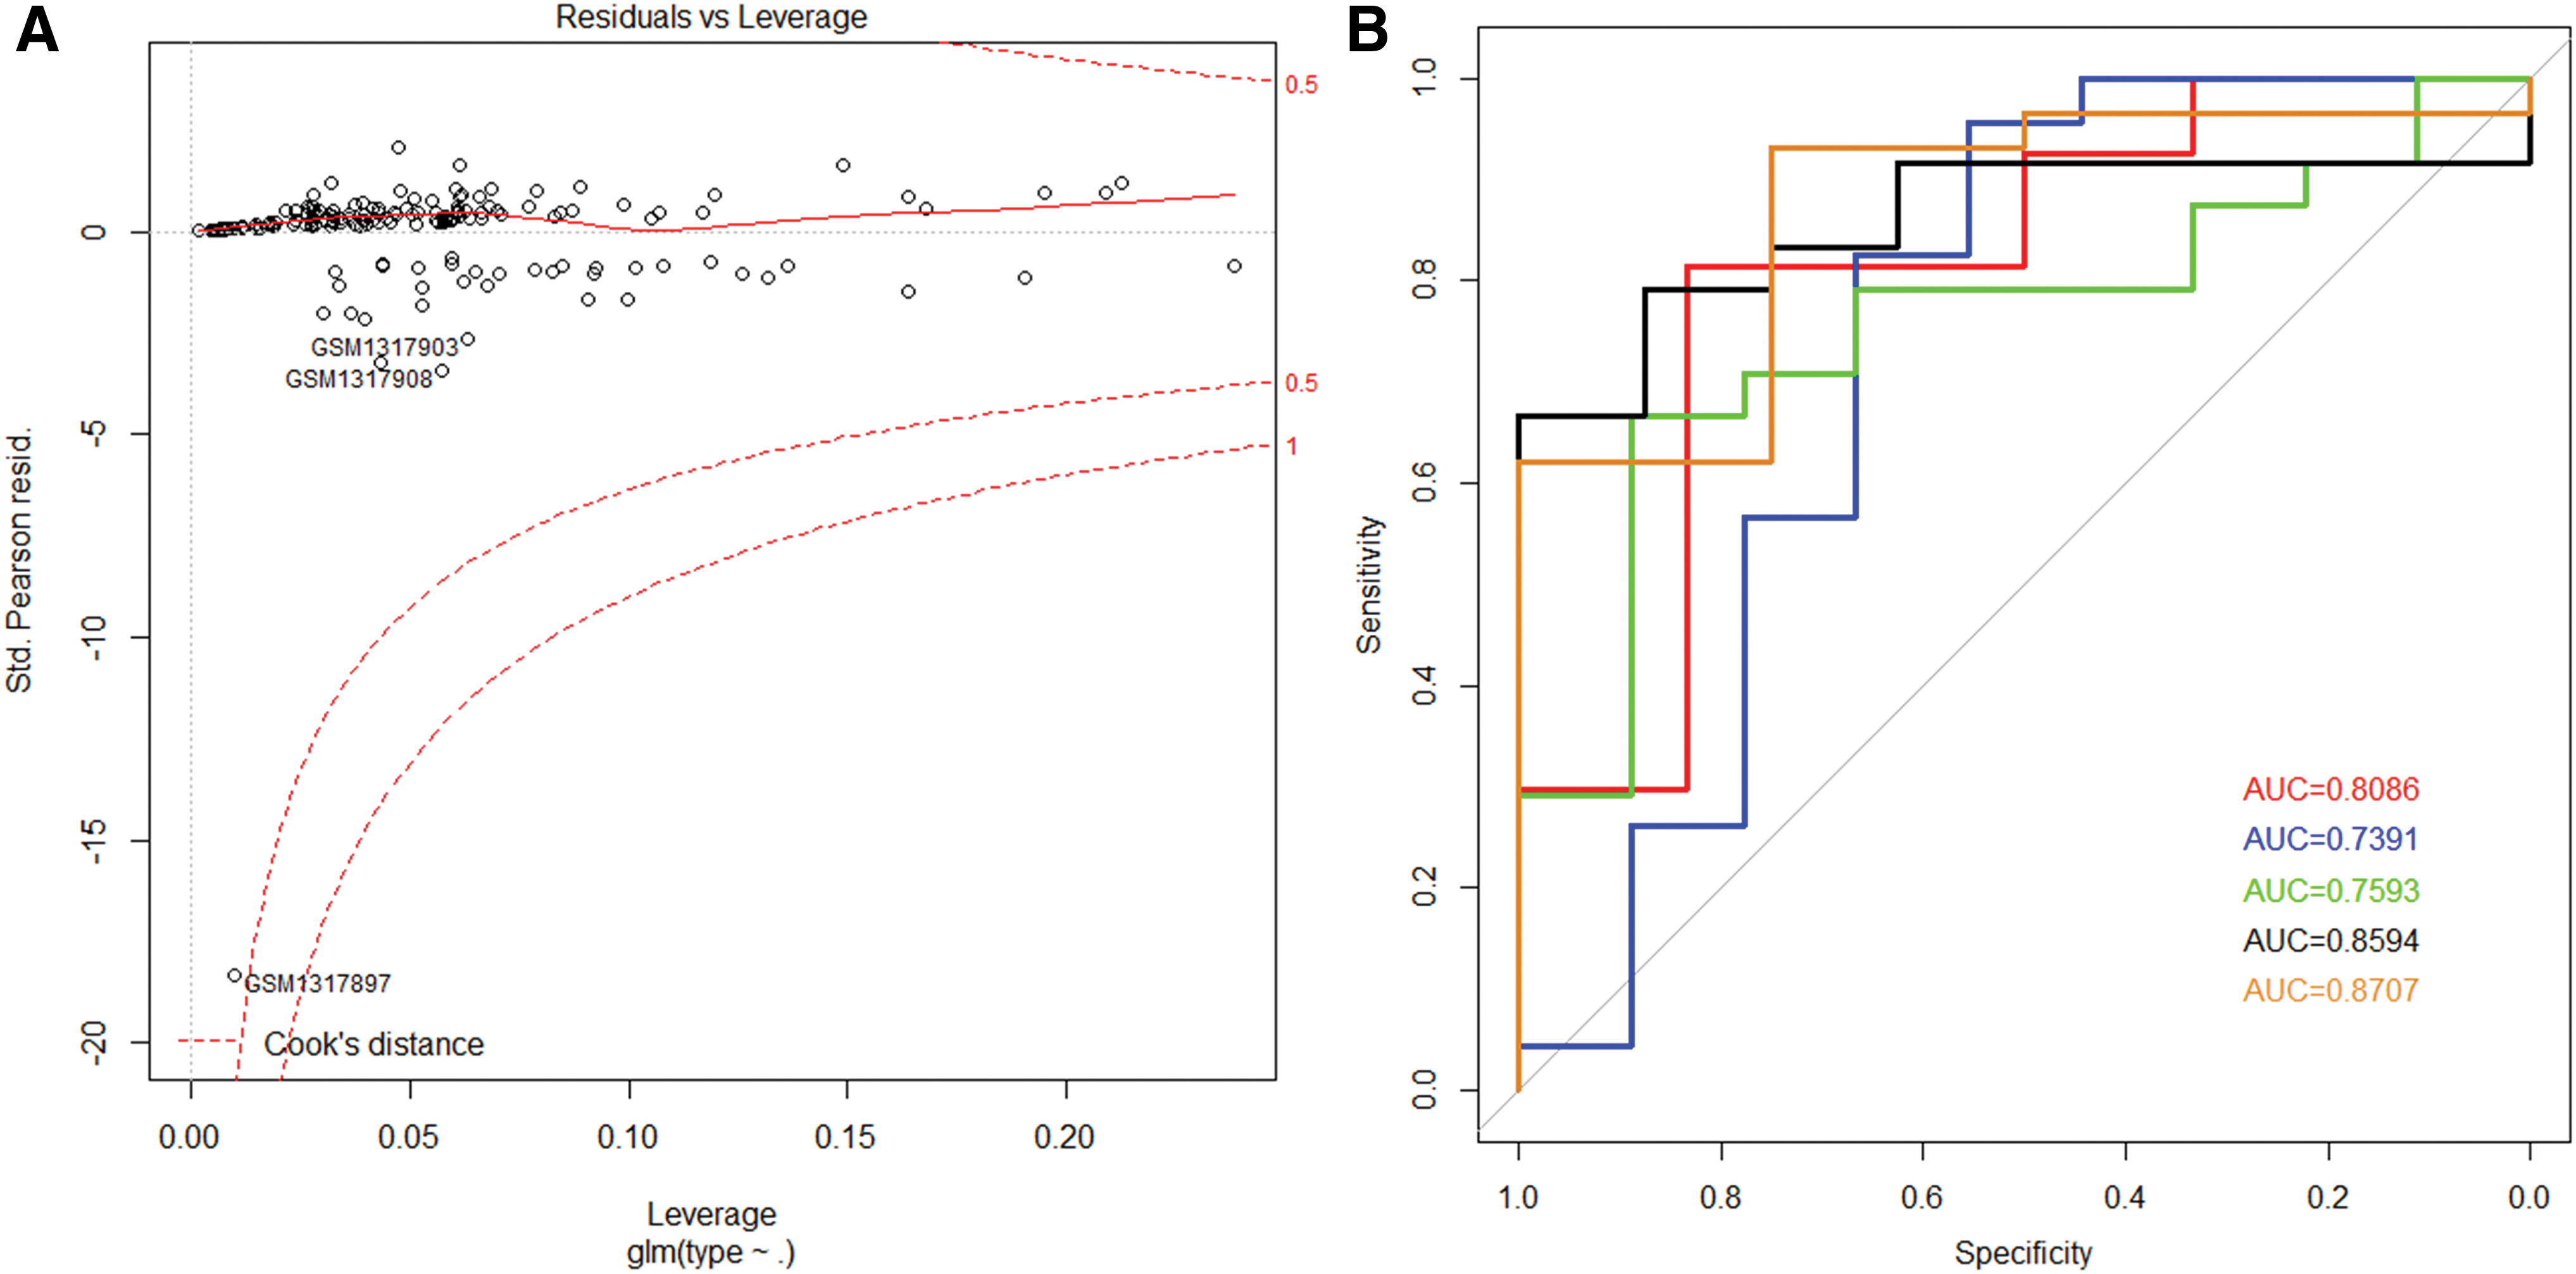
Construction of the logistic regression model and prediction of results.
Discussion
As the most severe manifestation of acute infection, sepsis is a major challenge to the healthcare systems worldwide (Fleischmann et al., 2016). From 2000 to 2008, the incidence of sepsis in America increased from 2.21 cases per 1000 persons to 3.77 cases per 1000 persons, rising by 7–8% per year (Hall et al., 2011). Despite the advances in care, sepsis is still considered a heavy economic burden for many regions. Agency for Healthcare Research and Quality listed sepsis as the most expensive disease treated in American hospitals, costing about $22.2 billion in 2011, considered the most expensive disease (Fleischmann et al., 2016). However, due to lack of gold standard for sepsis diagnosis, comparability of the results from clinical studies was limited (Vincent et al., 2013). Therefore, exploring more effective biomarkers will be helpful for understanding on diagnosis as well as underlying mechanism of sepsis.
In our research, the gene expression profiles of 163 samples from healthy controls and septic patients were analyzed, and eight GCMs were identified. Among them, the blue module was positively correlated with phenotype “days postsepsis” and the yellow module was negatively correlated with this phenotype. A total of 33 genes were significantly upregulated or downregulated over time in septic patients, and the intersection (n = 29) of them and genes in the blue and yellow modules was significantly enriched in HTLV-1 infection, salivary secretion, systemic lupus erythematosus, and transcriptional misregulation in cancer pathways. Finally, vital genes CECR1, ANXA2, ELANE, CTSG, AZU1, PRTN3, LYZ, and DEFA4 showed high scores in PPI analysis, and may be associated with sepsis.
Adenosine deaminase (ADA) plays a key role in inflammatory responses (Adanin et al., 2002). During inflammatory responses, the activity of ADA was improved in spleen and liver (Law et al., 2003). ADA1, a member of ADA family, participates in lymphocyte proliferation and development, and its congenital deficiency lead to severe combined immunodeficiency syndrome (Hirschhorn, 1995). ADA2, as the other member of ADA family, is encoded by gene CECR1 (Adanin et al., 2002). Elevated ADA2 was observed in tuberculosis, HIV, and septic rats, and the increased ADA2 was proved to be a biomarker for several disease statuses, as well as a tool for diagnosis (Conlon and Law, 2004). A previous study indicated ADA2 changes regulated innate defense response to pathogenic organism by affecting the concentrations of deoxyadenosine in monocytic cells (Gakis et al., 2010). In our study, CECR1 expression was increased over time in septic patients and it is closely correlated with the phenotype “days postsepsis.” We speculated that CECR1 may participate in sepsis progression through regulating the innate defense response of host to pathogenic organism.
Annexins are conserved Ca2+-regulated phospholipid-binding proteins, which have existed for 500 million years (Geisow et al., 1987). Annexin A2, encoded by ANXA2, is widely expressed in cells, including macrophages, tumor cells, mononuclear cells, and endothelial cells, and plays multifaceted roles in cellular processes, human diseases, and health (Zhang et al., 2015). It regulates the infection-initiated inflammation and protects the host from inflammatory damage. The ANXA2-deficient mice are susceptible to sepsis induced by Gram-negative bacteria, developing fast bacterial growth, severe tissue injury, great mortality, and enhanced inflammatory responses (Zhang et al., 2015; He et al., 2016). In glioblastoma, the expression value of ANXA2 is increased (Bronisz et al., 2014). In our research, ANXA2 was upregulated over time in septic patients and significantly relates to the phenotype “days postsepsis.” It is hypothesized the increased ANXA2 expression level was involved in the defense against infection in sepsis.
Elastase, encoded by gene ELANE, participates in the digestion of bacterial antigens and extracellular matrix. As one of the innate immunity-related genes, ELANE is upregulated in septic patients (Lee et al., 2013). The mutation of ELANE is observed in a case of necrotizing soft tissue infection with severe sepsis (Boo et al., 2015). Neutrophil elastase is reported to destruct the Gram-negative bacteria (Egbring et al., 1977). Increased elastase was associated with Factor V cleavage and inactivation in baboon model of sepsis (Samis et al., 2010). We found that ELANE expression was increased over time in septic patients and speculated that the elevated ELANE expression may be related to the bacteria destruction and bacterial antigen digestion.
We constructed the logistic regression diagnostic model based on these eight genes to predict whether the samples were sepsis samples, and the results indicated the good performance of the diagnostic model in sepsis.
In summary, our study identified eight vital genes CECR1, ANXA2, ELANE, CTSG, AZU1, PRTN3, LYZ, and DEFA4 in sepsis, which may provide alternative biomarkers for the assessment and surveillance of sepsis. Besides, combined diagnosis with multiple biomarkers may be more accurate and significant for diagnosis of sepsis. However, further studies on the specific roles and underlying molecular mechanisms of them still need a better understanding of sepsis.
Footnotes
Authors' Contributions
S.Z. and N.L. conceived and designed the project, S.Z. and W.C. acquired the data, N.L. and Q.F. analyzed and interpreted the data, and S.Z. and Y.L. wrote the article. Y.L. approved the final version.
Availability of Data and Material
All data generated or analyzed during this study are included in this published article.
Disclosure Statement
No competing financial interests exist.
Funding Information
No funding suppport in this study.