




Abstract
Increasing evidence suggests that aberrant long noncoding (lnc) RNA expression plays a vital role in gastric cancer (GC) initiation and progression. Thus, we aimed to develop a lncRNA-based risk signature and nomogram to predict overall survival (OS) for patients with GC. Our primary cohort was composed of 341 patients with clinical and lncRNA expression data in The Cancer Genome Atlas stomach adenocarcinoma (TCGA STAD), the internal validation cohort was composed of 172 randomly assigned patients, and the external validation cohort was composed of 300 patients from GSE62254 dataset. A risk signature and nomogram were developed for the primary cohort and validated on the validation cohorts. Furthermore, gene set enrichment analysis (GSEA) was used to investigate the pathway enrichment for the risk signature. The expression patterns of several lncRNAs were also investigated in clinical samples from 10 GC patients. We identified and validated a 14-lncRNA signature highly associated with the OS of patients with GC, which performed well on evaluation with C-index, area under the curve, and calibration curves. In addition, univariate and multivariate Cox regression analyses indicated that the lncRNA signature was an independent predictive factor for GC patients. Therefore, a nomogram incorporating lncRNA signature and clinical factors was constructed to predict OS for patients with GC in primary cohort that suggested powerful predictive values for survival in the TCGA cohort and the other two validation cohorts. In addition, GSEA indicated that the identified lncRNAs may regulate the autophagy pathway, affecting tumorigenesis and prognosis of patients with GC. Experimental validation demonstrated that the expression of lncRNAs showed the same trend both in our clinical samples and STAD dataset. These results suggest that both risk signature and nomogram were effective prognostic indicators for patients with GC.
Introduction
Gastric cancer (GC) is the fifth leading cause of cancer and the third leading cause of cancer related deaths worldwide, accounting for up to 7% of cancer occurrences and 9% of deaths (Zhang et al., 2019a). Patients with GC are rarely diagnosed at an early stage, and the prognosis of patients with late-stage GC remains extremely poor regarding recurrence and metastasis; >70% of patients eventually die from this disease (Allemani et al., 2015; Zhang et al., 2018). Pretreatment evaluation may help identify patients with GC at high risk for recurrence, which may guide the future development of targeted treatment strategies and reduce mortality and recurrence rates. Therefore, the identification of prognostic indicators and more effective screening for the diagnosis of patients with GC are essential.
Long noncoding RNAs (lncRNAs) are identified as transcripts with a length >200 nucleotides and no protein-translating functions (Ulitsky and Bartel., 2013). However, they are thought to perform a variety of functions, including the regulation of transcription, translation, splicing, and other processes (Ulitsky and Bartel., 2013). Recently, several newly annotated lncRNAs have been reported to encode small proteins in certain conditions (Anderson et al., 2015; Matsumoto et al., 2017). Increasing evidence suggests that aberrant lncRNA expression plays a vital role in GC initiation and progression (Sun et al., 2016; Huang et al., 2017; Feng et al., 2020), thus, influencing the survival of patients with GC. This indicates that these lncRNAs may be putative candidates for prognostic markers in GC. Although the TNM classification system has been used to predict prognosis for many years, it is sometimes inaccurate considering the heterogeneity of patients with GC (Marano et al., 2015; Mihmanli et al., 2016). Thus, developing a lncRNA signature has an important clinical value and widely applicable prospects in the management of GC.
Consequently, differentially expressed lncRNAs (DELs) were identified from The Cancer Genome Atlas stomach adenocarcinoma (TCGA-STAD). Then, we constructed a risk signature of lncRNAs and a nomogram integrating the signature with clinical features, and the predictive performances of the signature and the nomogram were validated in an internal and an external cohort. Finally, gene set enrichment analysis (GSEA) was used to investigate pathway enrichment for the lncRNA signature.
Materials and Methods
Data obtaining and processing
The GSE62254 microarray expression data were downloaded from the Gene Expression Omnibus (GEO) database, which contained data on 300 patients with GC and their associated clinical information. lncRNA sequencing data and related clinical information of patients with GC were obtained from TCGA database before February 1st, 2020. A total of 1135 overlapping lncRNAs between these two cohorts were selected for further analysis. A package called “edgeR” in R software was used to identify DELs between 32 adjacent samples and 375 STAD samples in TCGA, and there was a significant difference for 1135 lncRNAs when |log2fold change (FC)| ≥ 2 and an adjusted p-value <0.05. And then, we integrated the lncRNA expression data and clinical information according to samples in TCGA STAD. After removing patients with incomplete clinical information and <30 days follow-up duration, 341 patients with lncRNA expression data and their clinical information were used for primary cohort. And we randomly assigned 172 patients as the internal validation cohort using the “caret” package in R software. Finally, all the 300 patients with GC in GSE62254 were assigned as the external validation cohort.
Construction of risk score formula
Univariate Cox proportional hazards regression (CPHR) analysis was used to detect DELs that were highly associated with patients with GC' overall survival (OS) in primary cohort. Then the DELs with a p-value <0.05 were further enrolled into LASSO regression analysis to develop a lncRNA signature using the “glmnet” package in R software. Risk score of each patient was based on a linear combination of lncRNA expression level (X) multiplied by a regression coefficient (α) accessed from LASSO regression analysis. The formula is as follows: risk score = X1α1 + X2α2 + X3α3 +…+ Xnαn . The patients in the cohort were divided into high-risk group and low-risk group according to the median risk score value.
Assessment of lncRNA signature
Kaplan–Meier survival analysis was used to compare the survival rate between the high- and low-risk group. The time-dependent receiver operating characteristic (ROC) analyses were performed by “survivalROC” packages to evaluate the signature's sensitivity and specificity. Calibration curves were conducted to assess whether the predicted survival was in agreement with the actual survival. C-indexes were performed to detect the predictive performances of the signature. All the analyses were conducted in primary cohort and the two validation cohorts. The independence of lncRNA signature for OS was further explored by univariate and multivariate CPHR analyses in the primary cohort.
Construction and assessment of a novel nomogram incorporating the lncRNA signature with clinical factors
Then, the factors with p-values <0.05, both in univariate and multivariate CPHR analyses, were used to construct a novel nomogram incorporating the lncRNA signature and clinical factors by the package “rms” in R software. Calibration curves were conducted to assess whether the predicted survival in the nomogram was in agreement with the actual survival. The predictive performances of the prognostic model were also evaluated using area under the curve (AUC) in the ROC analysis and C-index calculation. All the analyses were conducted in the primary cohort and the two validation cohorts.
Gene set enrichment analysis
Based on the median of risk scores in lncRNA signature, 341 STAD samples in TCGA were divided into two groups (high risk and low risk) according to the median of risk scores in lncRNA signature. To identify the significantly altered Kyoto Encyclopedia of Genes and Genomes (KEGG) pathways, we performed GSEA between the high-risk and low-risk groups using the Java GSEA software. A nominal (NOM) p-value <0.05 was chosen as the cutoff criterion.
Patients and tissue samples
Ten GC samples and paired adjacent samples were obtained from the patients treated at First Affiliated Hospital of Guangzhou University of Chinese Medicine. All these samples were stored at −80°C. All patients signed informed consents before operation. The study was approved by the Ethics Committee of the First Affiliated Hospital of Guangzhou University of Chinese Medicine.
Quantitative reverse transcription polymerase reaction assays
Total RNA was extracted from cells with TRIzol reagent (Invitrogen, China) according to the manufacturer's guidelines. Reverse transcription was performed according to the manufacturer's instructions using the PrimeScript RT Reagent Kit (Takara, China). The SYBR PrimeScript RT-PCR Kit (Takara) was used to analyze quantitative reverse transcription-polymerase chain reaction (qRT-PCR). The 2−ΔΔCt statistic was used to calculate the expression levels of genes. The concrete sequences of different primers used in this study are included in Supplementary Table S1.
Statistical analysis
Based on the critical conditions of |log2FC| ≥ 2 and an adjusted p-value <0.05, DELs were identified using the “edgeR” package in R software. Univariate and lasso CPHR analyses were conducted to evaluate survival. OS was also analyzed using the Kaplan–Meier method, and the log-rank test was performed to assess the statistical significance of the differences between the high-risk and low-risk groups. To explore the predictive accuracy of the 14 lncRNA-based signature and prognostic nomogram, time-dependent ROC analysis was performed by the “survivalROC” package in R software, C-index by “survival” package, and calibration curve by “rms” package. All statistical tests were performed with R software (version 3.6.1). A p-value <0.05 was considered statistically significant, and all tests were two sided.
Results
Patient clinicopathological factors and DELs
A detailed data-processing flow was developed for this study (Fig. 1A). The important clinicopathological characteristics of the patients in the primary and the internal and external validation cohorts are shown in Table 1. According to the criteria of |log2FC| ≥ 2 and an adjusted p < 0.05, 124 DELs were identified, including 90 upregulated and 34 downregulated lncRNAs (Table 2 and Fig. 2).
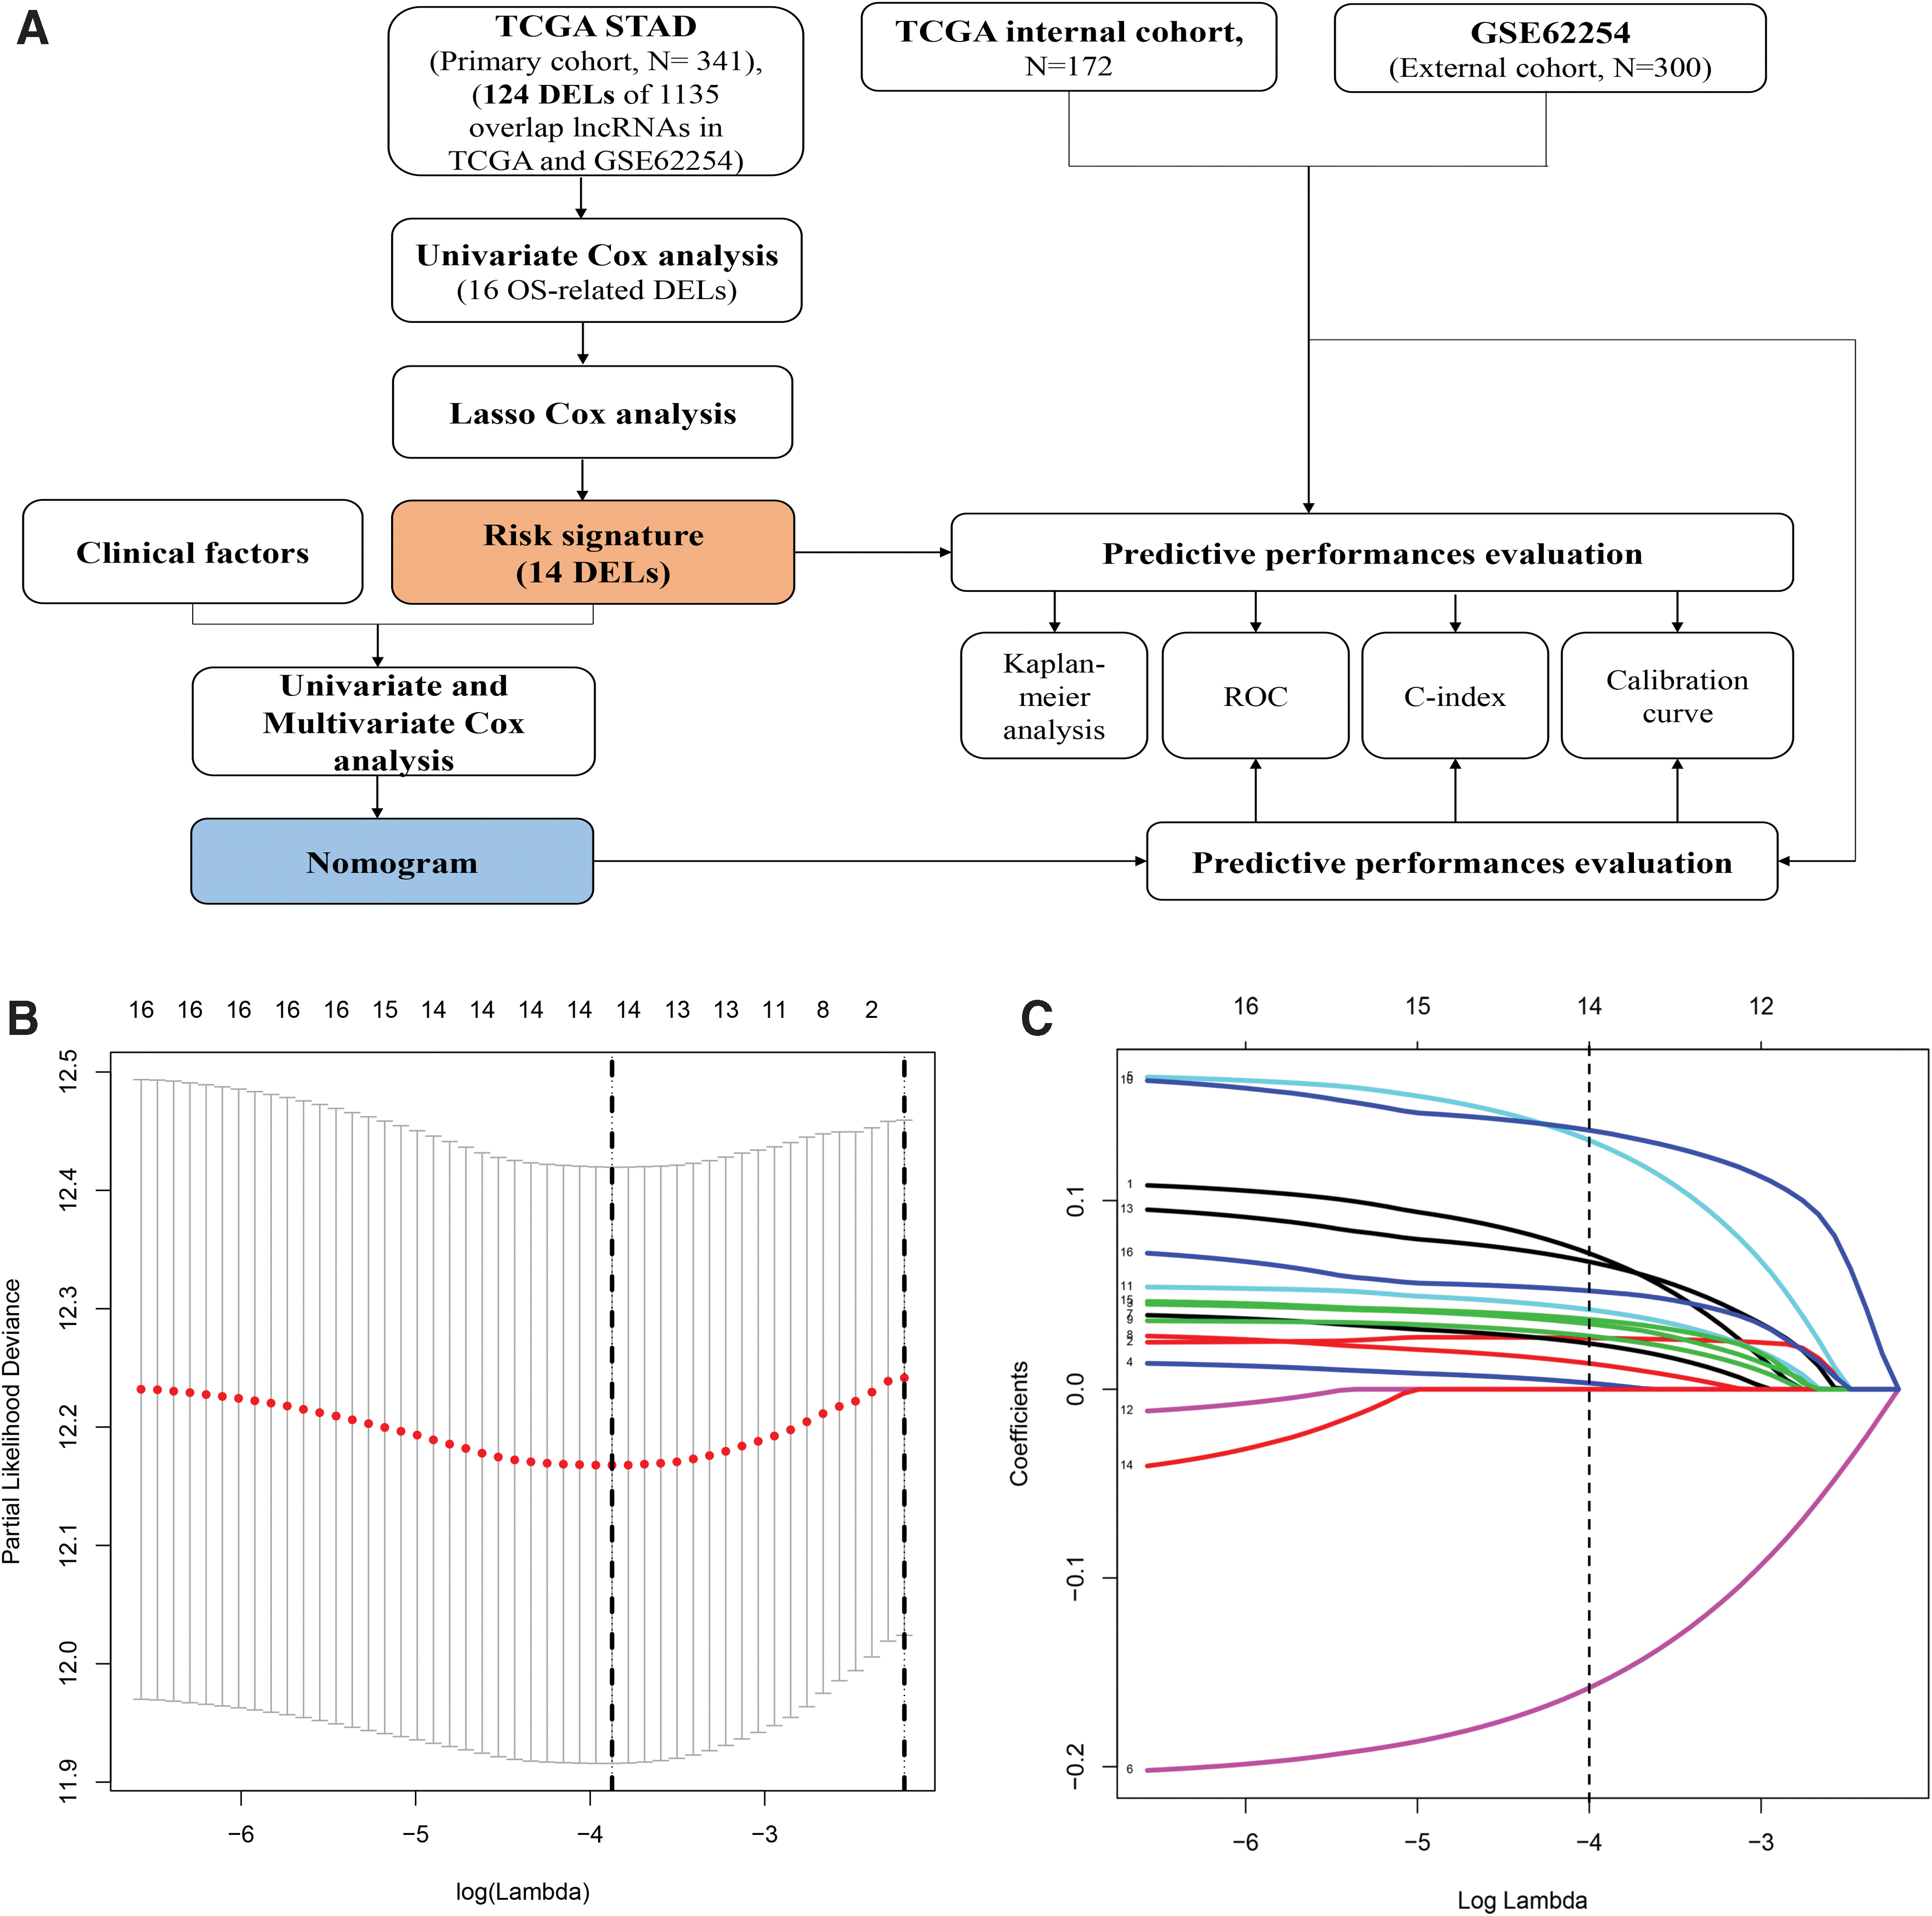
Flowchart and 10-time cross-validation for tuning parameter selection.
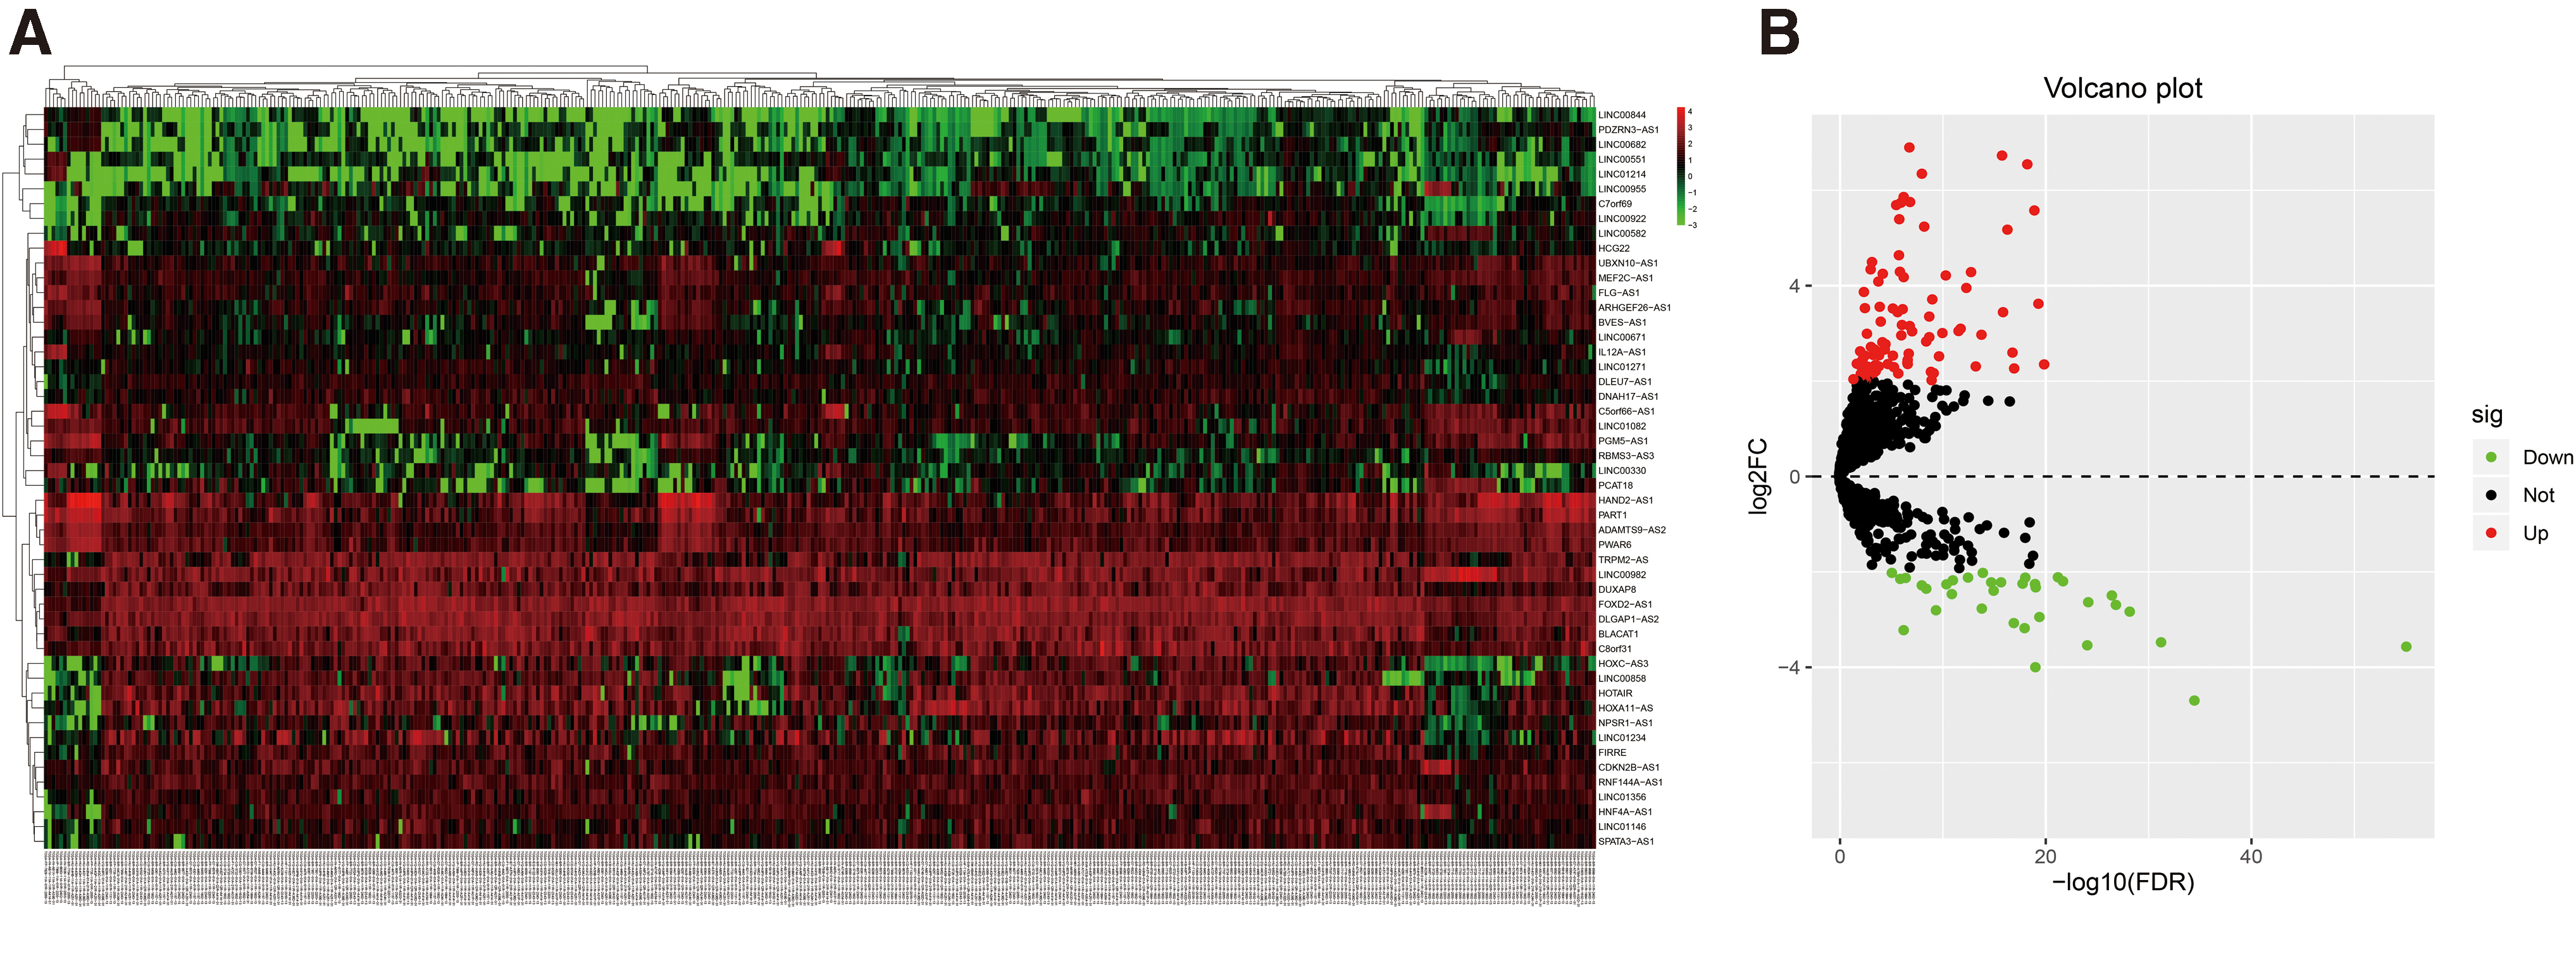
Differently expressed lncRNAs in TCGA STAD database based on the |log2FC| ≥ 2 and adjusted p-value <0.05.
Clinicopathologic Characteristics of Gastric Cancer Patients in Three Cohorts
TNM, tumor-node-metastasis.
The Differentially Expressed lncRNAs of STAD Samples Compared with Adjacent Samples in TCGA Database
lncRNA, long noncoding RNA; STAD, stomach adenocarcinoma; TCGA, The Cancer Genome Atlas.
Risk signature development
To identify OS-related DELs, the 124 identified DELs were analyzed by univariate CPHR in the primary cohort. Subsequently, 16 DELs were identified (p < 0.05); then, a lasso Cox regression model was used with 10-fold cross validation to analyze their expression in the primary cohort (Fig. 1B, C). Finally, 14 DELs were identified as prognosis-associated lncRNAs and used to develop the risk signature (Supplementary Table S2). Risk score = (XADAMTS9-AS2 × 0.0675) + (XFLG-AS1 × 0.0270) + (XRNF144A-AS1 × 0.0333) + (XLINC00922 × 0.0022) + (XC15orf54 × 0.1270) + (XLINC01210 × −0.1526) + (XERVMER61-1 × 0.0227) + (XPOU6F2-AS2 × 0.0122) + (XLINC00973 × 0.0269) + (XERICH3-AS1 × 0.1354) + (XLINC00326 × 0.0406) + (XLINC01208 × 0.0651) + (XLINC00645 × 0.0359) + (XDSCR10 × 0.0512). We plotted the expression patterns of the 14 identified DELs, risk score distributions, and survival status profiles comparing the low-risk and high-risk groups in the primary and validation cohorts (Fig. 3). The heatmap showed that 13 high-risk DELs (ADAMTS9-AS2, FLG-AS1, RNF144A-AS1, LINC00922, C15orf54, ERVMER61-1, POU6F2-AS2, LINC00973, ERICH3-AS1, LINC00326, LINC01208, LINC00645, and DSCR10) were overexpressed in the high-risk group, and 1 DEL (LINC01210) was overexpressed in the low-risk group. We further developed a prognostic nomogram that incorporated the 14 lncRNAs in the risk signature (Fig. 4A).
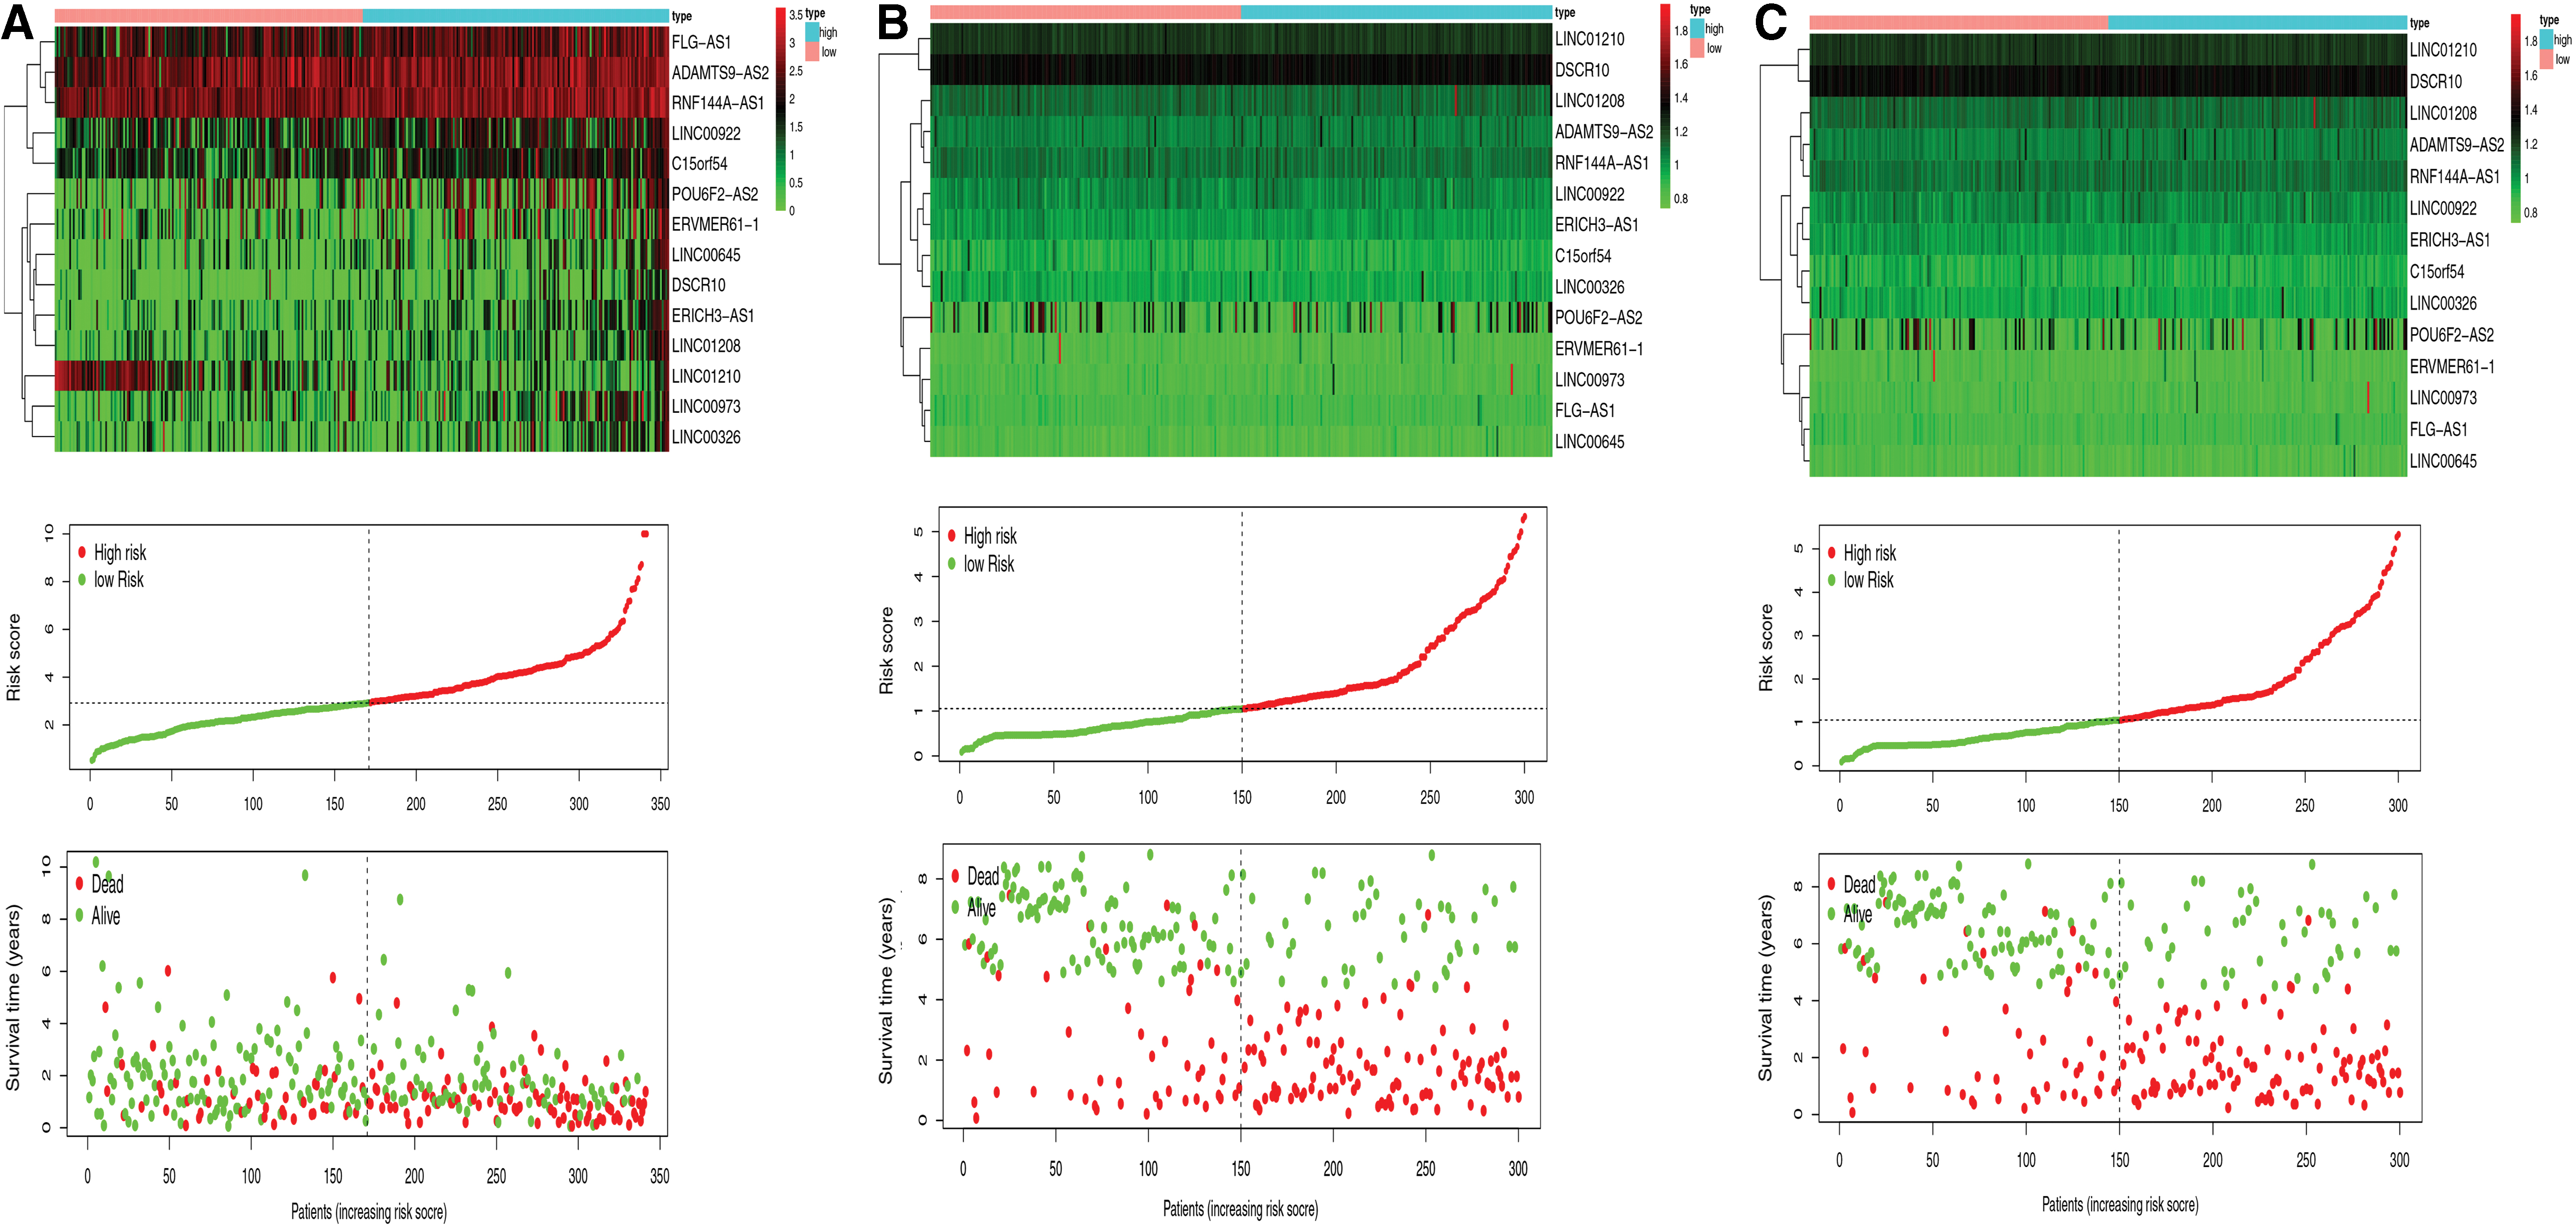
Distributions of 14-lncRNA expression, signature score, and survival status for patients in high- and low-risk groups.
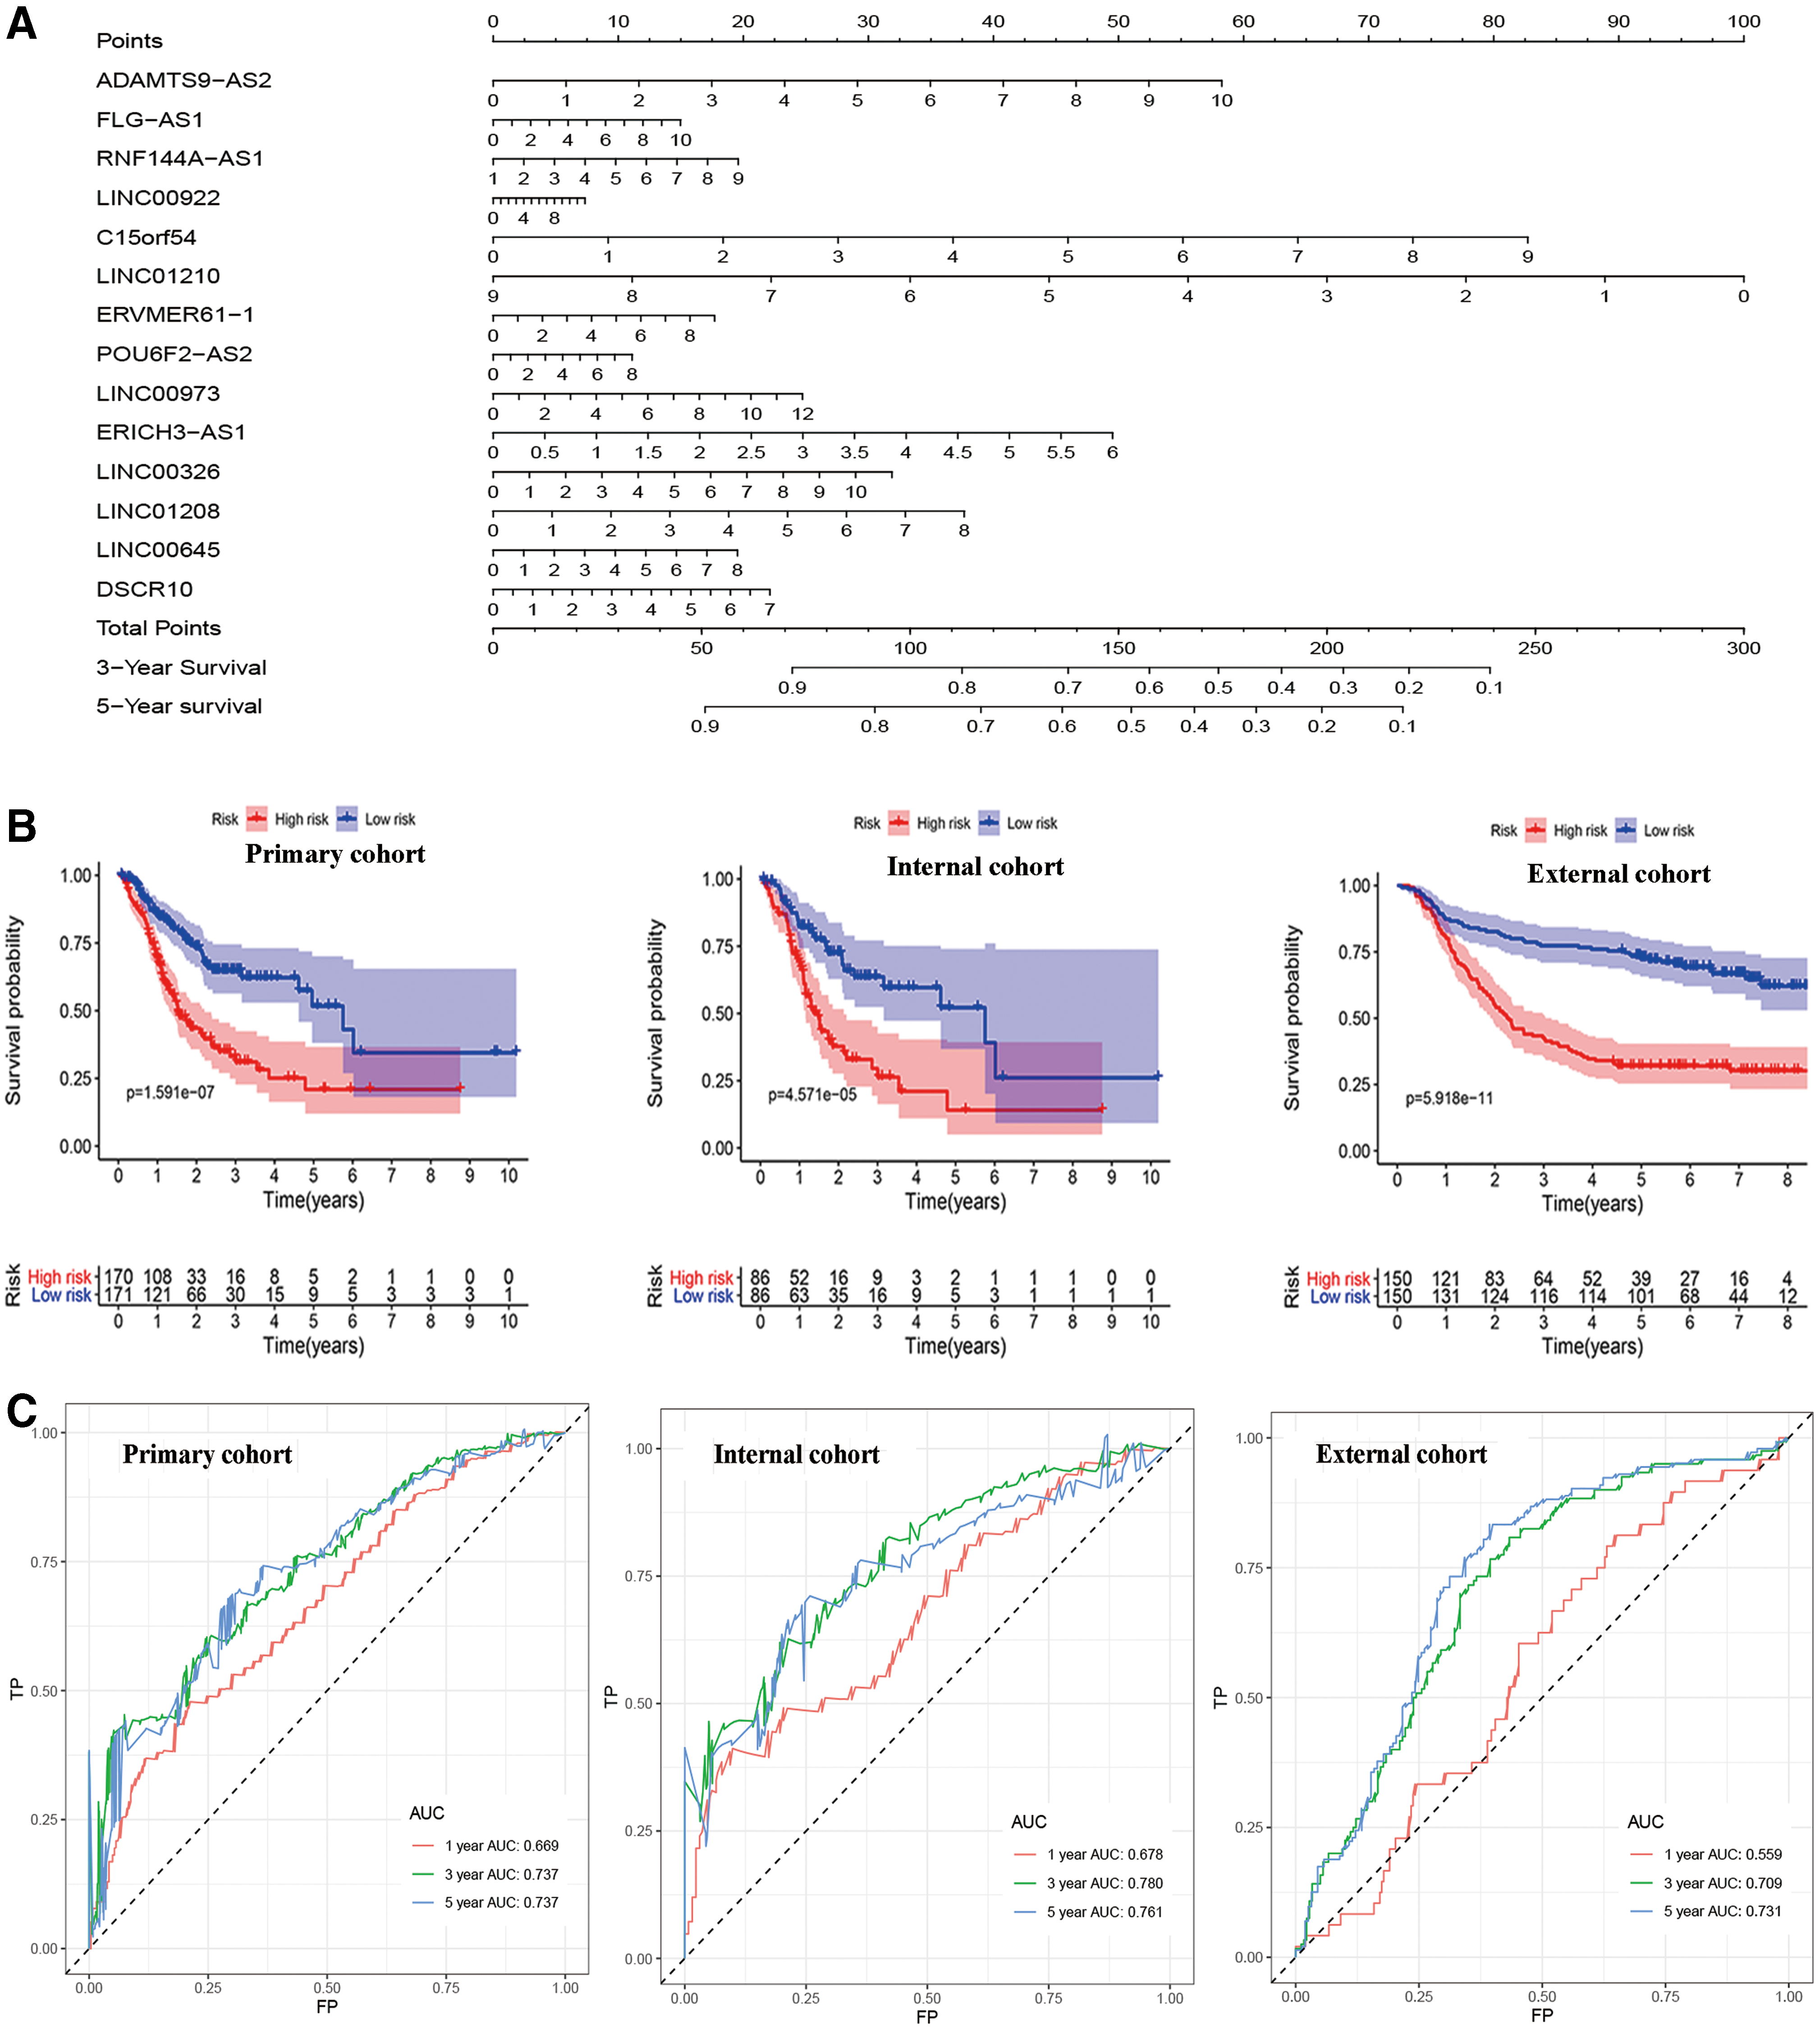
Risk signature assessment based on 14-lncRNA.

Risk signature assessment
Kaplan–Meier survival analysis suggested that patients in the high-risk group had shorter OS than those in the low-risk group among the primary and internal and external validation cohorts (Fig. 4B). In the primary cohort, AUC-ROC analysis for the risk signature was 0.669, 0.737, and 0.737 for 1-, 3-, and 5-year OS, respectively (Fig. 4C). The AUC-ROC of the 14-lncRNA signature was 0.678, 0.780, and 0.761 for 1-, 3-, and 5-year OS, respectively, in the internal validation cohort (Fig. 4C). In the external cohort, the AUC-ROC of the risk signature was 0.559, 0.709, and 0.731 for 1-, 3-, and 5-year OS, respectively (Fig. 4C). The ROC curve analysis suggested that the risk signature had better predictive performance compared with single lncRNAs alone for 5-year OS among the three cohorts (Fig. 4D). Furthermore, there was relatively good agreement between the expected and observed outcomes of the risk signature calibration curves for 5-year OS of the three cohorts (Fig. 4E). The C-indices were 0.667 in the primary cohort, 0.701 in the internal cohort, and 0.624 in the external cohort (Fig. 4F). Univariate and multivariate CPHR analyses indicated that the signature was an independent predictive factor for GC patients (Fig. 5).

Independent predictive power of the lncRNA signature in gastric cancer patients.
Nomogram development and validation
Univariate and multivariate CPHR analysis showed that the age, N stage, and 14-lncRNA risk signature were significantly associated with OS of GC in the primary cohort (Fig. 5). We then used multivariate CPHR analysis to construct a nomogram integrating these three factors to predict 3- and 5-year OS (Fig. 6A). As shown in Figure 6A, the risk signature was the most important factor affecting the patients' survival, followed by N stage and age. Calibration curves showed that the nomogram had a superior agreement between the predicted and actual OS in all three cohorts (Fig. 6B). In the primary cohort, AUC-ROC analysis of the nomogram was 0.660, 0.731, and 0.692 for 1-, 3-, and 5-year OS, respectively (Fig. 6C). The AUC-ROC of the nomogram was 0.651, 0.772, and 0.772 for 1-, 3-, and 5-year OS in the internal validation cohort (Fig. 6C). In the external cohort, AUC-ROC of the nomogram was 0.734, 0.795, and 0.786 for 1-, 3-, and 5-year OS, respectively (Fig. 6C). The C-indices of the nomogram were 0.698 in the primary cohort, 0.706 in the internal validation cohort, and 0.726 in the external validation cohort (Fig. 6D).

Nomogram construction and assessments.
Gene set enrichment analysis
Based on the criterion of a NOM p-value <0.05, five KEGG signaling pathways were significantly altered in the high-risk group (Fig. 7). However, as one of the most altered pathways, according to previously published studies, KEGG_REGULATION_OF_AUTOPHAGY may strongly correlate with GC tumorigenesis and progression. Therefore, we only investigated the expression of the autophagy pathway. The risk signature for predicting OS in patients with GC showed LINC01210, C15orf54, ADAMTS9-AS2, and ERICH3-AS1 expressions to be associated with better survival (Fig. 4A). By retrieving the PubMed database, we found that ADAMTS9-AS2 was the most studied lncRNA among these four lncRNAs, and it was related to most cancers. Therefore, we only investigated the association between ADAMTS9-AS2 expression and the hub genes of autophagy pathway. The analysis using TCGA-STAD data suggested that ADAMTS9-AS2 was strongly correlated with several hub genes that play a role in autophagy regulation, including ATG2A, ATG3, ATG4A, ATG4B, ATG4D, IFNG, ULK3, and PIK3R4 (Supplementary Fig. S1).
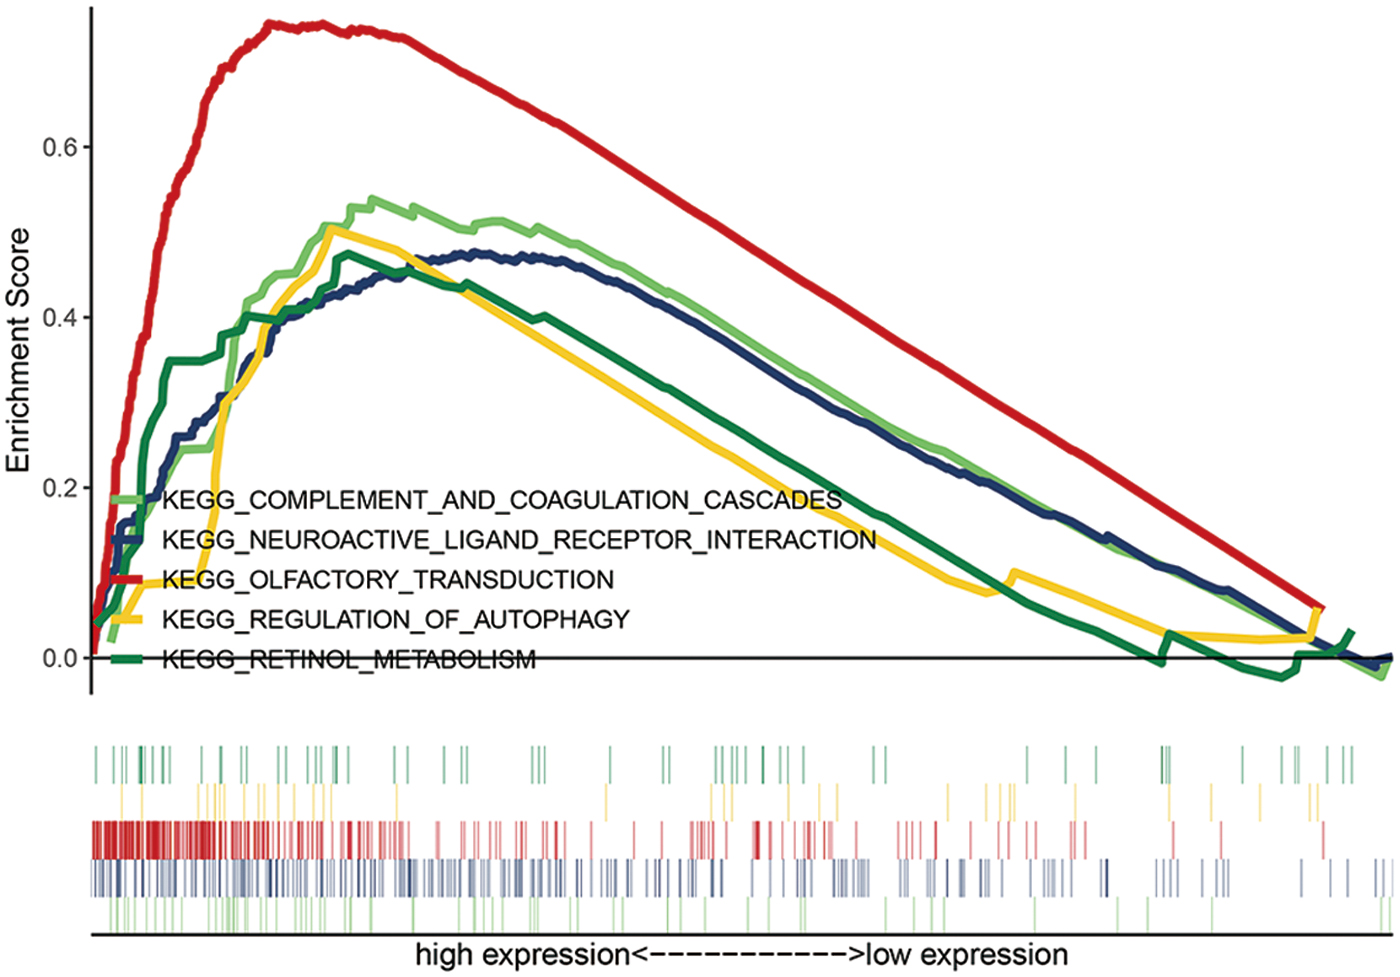
Gene set enrichment analysis of lncRNA signature. Color images are available online.
Validation of the expression of lncRNAs in GC samples
The expression of several lncRNAs (LINC01210, C15orf54, ADAMTS9-AS2, and ERICH3-AS1) that were part of the signature was investigated in 10 paired tumor and adjacent tissues from 10 patients using qRT-PCR. The results indicated that LINC01210, C15orf54, and ERICH3-AS1 were significantly upregulated in tumors compared with adjacent samples (Fig. 8A–C) (p-value <0.05). In contrast, ADAMTS9-AS2 was significantly downregulated in tumors compared with adjacent samples (Fig. 8D) (p-value <0.05). These results were consistent with the results of TCGA STAD dataset (Supplementary Fig. S2).

Quantitative reverse transcription polymerase reaction results of four genes.
Discussion
Previous studies have successfully identified several lncRNA-, miRNA-, and mRNA-expression based risk signatures to prevent the development of various tumors. In our study, we identified and validated a 14-lncRNA risk signature that was highly associated with the OS of patients with GC. Patients with GC in the high-risk group had a shorter survival than those in the low-risk group in the primary and validation cohorts. The signature also showed a high prediction accuracy and robustness on calculating the C-index, AUC in ROC analysis, and on plotting calibration curves. Multivariate Cox regression analyses suggested that age, N stage, and the risk signature were independent risk factors for OS in the primary cohort. A novel nomogram incorporating above three factors was constructed and validated to predict the prognosis for patients with GC. GSEA analysis indicated that the 14-lncRNA signature might regulate the autophagy pathway, thus affecting survival in patients with GC. The expression of several lncRNAs included in the signature was also validated in the clinical samples by qRT-PCR. These results suggested that both the 14-lncRNA risk signature and the novel nomogram were effective prognostic indicators in patients with GC.
There are 14-lncRNAs in our risk signature, including ADAMTS9-AS2, FLG-AS1, RNF144A-AS1, LINC00922, C15orf54, LINC01210, ERVMER61-1, POU6F2-AS2, LINC00973, ERICH3-AS1, LINC00326, LINC01208, LINC00645, and DSCR10. Previous studies have found that ADAMTS9-AS2 is highly expressed in glioblastoma (Yan et al., 2019), tongue squamous cell carcinoma (Li et al., 2019b), salivary adenoid cystic carcinoma (Xie et al., 2018), and ovarian (Wang et al., 2018) and lung (Liu et al., 2018) cancers and could promote cell proliferation, migration, metastasis, and chemoresistance to drugs. In contrast, a low expression level of ADAMTS9-AS2 was detected in renal carcinoma (Song et al., 2019) and esophageal (Liu et al., 2020) and breast (Shi et al., 2019) cancers. In contrast to our results, Cao et al. (2018) found that ADAMTS9-AS2 expression was obviously decreased in GC cells and tissues, and its low expression was related to GC development and progression through activation of the PI3K/Akt signaling pathway. As for the controversial role of ADAMTS9-AS2 in cancers, more experiments with high quality should be done in future. Liang et al. (2019) demonstrated that the overexpression of LINC00922 could promote proliferative, migratory, and invasive capacities of lung cancer through the miRNA-204/CXCR4 regulatory network. High LINC01210 expression was closely related to tumor metastasis and a bad prognosis in patients with ovarian cancer. Further investigations on its biological mechanisms showed that it might stimulate OC cell proliferation, migration, and invasion by targeting and downregulating KLF4 expression (Zhang et al., 2019b). POU6F2-AS2, highly expressed in esophageal squamous cell carcinoma, plays a role in DNA repair and, thus, regulates cell survival after exposure to ionizing radiation (Liu et al., 2016). Jing et al. (2019) found that the expression level of LINC00973 was increased in H508/CR cells. After transfecting LINC00973 interfering plasmids, cell viability, lactic acid secretion, and glucose consumption decreased, and the cell apoptosis rate increased. Zinovieva et al. (2018) revealed that LINC00973 was obviously upregulated in colon cancer cells that were treated with different chemotherapy drugs at different dosages. LINC00645, first identified from lincRNA sequencing data of endometrial cancer patients, was also significantly upregulated, which might be related to malignant pathological changes in patients with endometrial cancer (Chen et al., 2017). Li et al. (2019a) found that LINC00645 was overexpressed in glioma and might competitively bind miR-205-3p to increase the expression of ZEB1, which promotes the epithelial mesenchymal transition (EMT) process of glioma cells activated by transforming growth factor beta (TGF-β). However, there are no studies exploring the molecular mechanism of other lncRNAs in our 14-lncRNA signature.
In this study, we developed a nomogram by combing the lncRNA signature and clinical factors in 341 STAD patients from the TCGA project. The predictive power of the nomogram was validated in both internal and external cohorts by analyzing their calibration curves, C-indexes, and ROC curves. The results showed that the nomogram was an effective predictive tool for patients with GC.
GSEA KEGG pathway analysis indicated that the risk signature may regulate several KEGG pathways to promote cancer initiation and progression, among which the “regulation of autophagy” pathway might be strongly correlated with GC. Autophagy is a highly conserved steady-state process that involves the formation of a double-membrane structure that then fuses with lysosomes to form an autophagosome, leading to cellular protein degradation and organelle damage. Autophagy is generally believed to have an anticancer effect in the early stages of tumorigenesis by reducing DNA damage and oxidative stress in cells (Kong et al., 2017). However, growing evidence indicates that it often promotes tumor progression by providing sufficient energy to tumor cells under various adverse circumstances (White, 2012; Amaravadi et al., 2016). Previously, some lncRNAs had been reported to play a part in GC development by regulating the autophagy pathway. For examples, Wang et al. (2019) found that LINC01419 was overexpressed and that its silencing could suppress GC cell growth, migration, and invasion through inactivation of the autophagy pathway. Xin et al. (2019) demonstrated that autophagy inhibition related to METase could reduce the chemotherapeutic drug resistance of GC cells by targeting the long non-coding RNA highly up-regulated in liver cancer (LncRNA HULC)/FoxM1 pathway. Zhao et al. (2014) showed that HULC induced autophagy activation in GC cells and thus promoted cell survival and that HULC silencing caused EMT process reversion. However, there are no reports on the association between autophagy-associated tumor development and lncRNAs included in our signature; thus, more research should be conducted on their association.
Our research has some obvious strengths. First, this study included 341 GC samples from TCGA and 300 samples from GSE62254, which had a strong statistical effect and could reduce the bias originating from a small sample size. Moreover, our signature and predicted nomogram were validated in both internal and external cohorts and showed a good predictive accuracy and robustness. Second, a novel nomogram incorporating risk signature and other significant clinical factors could comprehensively and systematically show the predicted effects. Third, the calculations are easy even for individuals without a medical background, which could promote the application of the signature in different settings.
In addition, there are several limitations to the current study. First, both the TCGA and GSE62254 databases did not include some important variables, such as chemotherapy, radiation, previous disease, and family history of cancer, which might affect the treatment and prognosis of patients with GC. Second, GEO used microarray chip technology, while TCGA used RNA sequencing. The lncRNAs obtained from RNA sequencing are significantly more than microarray chip technology. Intersection of GEO and TCGA may facilitate subsequent verification in GEO, but it might reduce the amount of lncRNAs, thus influencing the results. Furthermore, all results in this article relied on data mining, and data from clinical experiments were lacking. Thus, researchers should focus on exploring the molecular function of these lncRNAs henceforth. Finally, to assure predictive performance of the nomogram, more independent external cohorts should be analyzed on the basis of our model construction methods.
In conclusion, we successfully constructed a 14-lncRNA risk signature correlated with GC prognosis in TCGA and an external cohort. The results indicated that the signature is a potent predictive indicator for patients with GC. Furthermore, we identified and validated a novel and robust nomogram incorporating the signature and clinical factors to predict the 3- and 5-year OS rates of patients with GC, which could aid in decision-making in clinical settings in the future.
Footnotes
Authors' Contributions
K.N., P.L., and F.L. designed, analyzed, wrote, and revised the article; Z.D., Z.Z., Y.W., J.P., X.J., Y.Y., and P.L. performed literature search and data collection; and P.L. and F.L. improved the language. All authors have read and approved the final version of the article.
Acknowledgments
This study used TCGA and GEO databases. We appreciate the data platform, and the authors have uploaded their data.
Disclosure Statement
No competing financial interests exist.
Funding Information
Breakthrough project of TCM dominant diseases with special funds for strengthening traditional Chinese medicine in 2015 (no. 19), Guangdong administration of traditional Chinese medicine; The Natural Science Foundation of Guangdong Province in 2019 (2019A1515011145); Major projects of first-class disciplines in Guangzhou University of TCM in 2018 (A1-AFD018181A27); Major research projects in Guangzhou University of TCM in 2019 (A1-2606-19-110-007); Innovative research team project of innovation hospital in the First Affiliated Hospital of Guangzhou University of Traditional Chinese Medicine in 2017 (2017TD05); Natural science foundation of Guangdong province in 2017 (2017A030310121); and Youth scientific research talents training program of innovation hospital in the First Affiliated Hospital of Guangzhou University of Traditional Chinese Medicine in 2015 (2015QN09).
Supplementary Material
Supplementary Table S1
Supplementary Table S2
Supplementary Figure S1
Supplementary Figure S2
References
Supplementary Material
Please find the following supplemental material available below.
For Open Access articles published under a Creative Commons License, all supplemental material carries the same license as the article it is associated with.
For non-Open Access articles published, all supplemental material carries a non-exclusive license, and permission requests for re-use of supplemental material or any part of supplemental material shall be sent directly to the copyright owner as specified in the copyright notice associated with the article.
