




Abstract
This study aimed to identify prognostic epigenetic biomarkers for colon cancer (CC). Methylation and mRNA expression in CC samples with clinical characteristics that corresponded to those in The Cancer Genome Atlas were analyzed. Differentially methylated genes (DMGs) and differentially expressed genes (DEGs) were screened between matched tumor and nontumor tissues. Among the 415 DEGs and DMGs that significantly correlated between cytosine-phosphate-guanine (CpG) methylation and gene expression, unc-5 netrin receptor C (UNC5C), solute carrier family 35 member F (SLC35F)1, Ly6/Neurotoxin (LYNX)1, stathmin (STMN)2, slit guidance ligand (SLIT)3, cell adhesion molecule L1 like (CHL1), CAP-Gly domain containing linker protein family member 4 (CLIP4), transmembrane protein (TMEM) 255A, granzyme B (GZMB), and brain expressed X-Linked (BEX)1 were promising epigenetic biomarkers. Prediction was more accurate when models were based on the expression and/or methylation of GZMB rather than clinical stage. Comparisons of tissues with high or low GZMB expression significantly associated the DEGs with natural killer-mediated cytotoxicity, cytokine–cytokine receptor interactions, and chemokine signaling pathways. From among the 10 epigenetic biomarkers, GZMB might serve as a tumor suppressor and function in several immune-related pathways in CC. Prognostic models based on GZMB expression and/or methylation would be significant for patients with CC.
Introduction
Colorectal cancer (CRC) is the third most common cancer worldwide with significant morbidity and mortality (Bray et al., 2018). The prognosis is dismal, with approximately half of patients dying from this cancer (Rawla et al., 2019). Deeper understanding of the molecular mechanisms is critical to improve CRC diagnosis and prognosis. CRC is the result of accumulative mutations in genes and epigenetic modifications of several genes (Sameer, 2013).
The methylation of DNA is an important epigenetic modification that plays vital roles in regulating genome expression; DNA methylation in promoters results in gene silencing, whereas demethylation in gene bodies leads to the downregulation of genes (Yang et al., 2014; Sameer and Nissar, 2016a). The methylation of DNA is modified in cancer cells (Delpu et al., 2013), and many DNA methylation markers have prognostic value for CRC (Sameer and Nissar, 2016b; Verma and Kumar, 2017; Draht et al., 2018). Direct evidence supports the notion that DNA methylation anomalies (such as low LINE1 methylation) characterize distinct subgroups of colon cancer (CC) and that DNA methylation can predict recurrence in resected stage III proximal CC (Ahn et al., 2011). A prognostic methylation-based classifier for patients with nonmetastatic CRC, determined using principal component analysis, has improved prognostic accuracy (Gündert et al., 2017), and a novel DNA methylation panel involving MGMT, RASSF1A, and SEPT9 can detect CRC irrespective of molecular pathways (Freitas et al., 2018).
Here, we focused on genes that were differentially expressed and methylated in CC samples that significantly correlated with cytosine-phosphate-guanine (CpG) methylation and mRNA expression in The Cancer Genome Atlas (TCGA). Subsequently, prognostic epigenetic biomarkers that were significantly associated with overall survival (OS) at the levels of DNA methylation and mRNA expression were identified using univariate Cox regression analysis. We created and compared prognostic models based on DNA methylation, mRNA expression, and clinical characteristics. The present findings might help to identify prognostic epigenetic biomarkers for CC and offer a theoretical foundation for personalized approaches to treating CC.
Materials and Methods
Data acquisition
All RNASeqV2 normalized count, DNA methylation, and clinical data files for CC samples were downloaded from TCGA using TCGAbiolinks (Colaprico et al., 2015). Normalized RNASeqV2 count data for 521 CC samples were included. Genes with missing expression values in >20% of samples were deleted to maintain quality control. Missing values for the remaining genes were estimated using KNNimpute (Troyanskaya et al., 2001) followed by log2 transformation. Thereafter, 22,607 genes remained. Probes with >20% missing data or data that corresponded to single nucleotide polymorphisms were deleted from the DNA methylation data (n = 353), leaving 393,790 probes. Clinical data files (n = 459) included 75 features such as the demographic factors of gender (male vs. female), race, and age at initial diagnosis (continuous variable) and clinical features (clinical stage, histological type, and follow-up duration). TCGA dataset served as the training set. A total of 293 CC samples had RNASeq, DNA methylation, and clinical data. This article extracted data from TCGA database and did not involve animal experiments, thus no ethical review or informed consent was required.
The GSE39582 dataset comprising 566 CC and 19 nontumoral colorectal mucosal tissues served as the validation set (Marisa et al., 2013) samples. Probes were annotated based on the GPL570 platform. Expression values of multiple probes for each gene were averaged. Table 1 shows the demographic and clinical characteristics of the patients.
Clinical Variables of Patients in The Cancer Genome Atlas Set
AD, adenocarcinoma; NA, data unavailable; SD, standard deviation.
Differential gene analysis of CC and nontumor samples
We found 42 CC and nontumor samples with matched RNASeq data in TCGA set. The fold change (FC) of genes from each sample was calculated using the formula:
FC = RNASeq value (tumor)/RNASeq value (nontumor),
followed by log2 transformation. The median FC per gene across all samples was also calculated. Differences in log-transformed RNASeq data across 22,607 genes between tumor and nontumor samples were assessed by analyses of covariance (ANCOVA) using the aov function of the stats package, (Crawley, 2007), controlling for gender, age at initial diagnosis, pathological type, smoking status, and race. Differentially expressed genes (DEGs) with false discovery rates (FDRs) of q < 0.05 and a median absolute FC of ≥|2.0| were considered significant.
Differential methylation analysis of CC and nontumor samples
Data about DNA methylation were available for 38 matched CC and nontumor samples in TCGA set. Variations in DNA methylation beta-values across all CpG sites were assessed using ANCOVA, controlling for the same four features described for the differential gene expression analysis.
The Infinium HumanMethylation 450 BeadChip array annotated each probe to one of six intragene sites of a gene (Tilley et al., 2017). Beta differences across all CpG sites in tumors were calculated as follows:
beta-value (tumor) − beta value (nontumor).
The median beta difference of a gene in the Infinium HumanMethylation450 BeadChip array was computed across all CpG sites in all samples and within each of the six intragene sites. Significant differentially methylated genes (DMGs) were considered when at least one probe had an FDR of q < 0.05 and a median beta difference of ≥|0.10|.
Analysis of associations between CpG methylation and mRNA expression in CC tissues
TCGA set included 308 CC samples with both RNASeq data and DNA methylation data. Genes that were both differentially expressed and methylated between colon adenocarcinoma and nontumor samples were assessed by Spearman rank correlation analysis using the cor function of the stats package. A Spearman rank correlation of p < 0.05 indicated genes with a significant correlation between methylation and mRNA expression. Genes that were both differentially expressed and methylated between matched CC and nontumor tissues with CpG methylation and significantly correlated with mRNA expression in tumor tissues were considered promising epigenetic biomarkers of CC.
Pathway enrichment analysis
We investigated the biological processes in which these epigenetic biomarkers might be involved by applying overrepresentation analyses based on right-tailed Fisher exact tests using pathway information from the Reactome (Croft et al., 2014) database by ConsensusPathDB (Herwig et al., 2016) tool. Pathways with p < 0.05 that were enriched with at least five genes were regarded as significant.
Survival analysis
Associations between CpG methylation and mRNA expression in the potential epigenetic biomarkers with OS in TCGA set were assessed by univariate Cox regression analysis using the coxph function of the survival package. Significant genes with p < 0.05 were validated in GSE39582 and then selected as potential prognostic indicators for CC.
According to the methylation or expression level of each potentially prognostic gene, all samples in TCGA set were stratified according to having high (top two-thirds) or low (bottom third) expression, and high (top two-thirds) or low (bottom third) methylation. Differences in OS between groups were assessed by Kaplan–Meier analysis and log-rank tests using the survfit function of the survival package.
Development and evaluation of prognostic models
We constructed prognostic models based on the mRNA expression and CpG methylation data of potentially prognostic genes, and the clinical stages of samples using Cox proportional hazards models and the coxph function of the survival package. Prognostic models were created as follows: model 1, clinical stage; model 2, gene expression; model 3, DNA methylation; model 4, integrated gene expression and DNA methylation; and model 5, integrated gene expression, DNA methylation, and clinical stage. The predictive accuracy of the five models was assessed using a concordance statistic (C index) (Harrell et al., 1996; Yuan et al., 2014), followed by Monte Carlo cross-validation (Xu et al., 2004). Specifically, 80% of samples in TCGA set were randomly selected to train the prognostic models, and the remaining 20% served as a test set for calculating C indexes. This process was replicated 100 times. The optimal prognostic model was determined based on the median C index.
Investigation of underlying molecular mechanisms
TCGA set was partitioned according to expression levels of selected prognostic genes into groups with high and low expression, then DEGs between the groups were screened using the limma package (Smyth, 2011), with the cutoffs, |logFC| > 1 and q < 0.05. We applied the Kyoto Encyclopedia of Genes and Genomes pathway enrichment analysis and identified DEGs using the ClusterProfiler package (Yu et al., 2012). Pathways with p < 0.05 were considered significant.
Results
DEGs and DMGs identified between CC and nontumor tissues
We found 1007 DEGs between paired CC and nontumor samples (n = 41), of which 687 (68.22%) and 320 (31.78%) were downregulated and upregulated, respectively, in tumor versus nontumor tissues. We identified 8944 DMGs between matched tumor and nontumor tissues (n = 38). Data analysis of the intragenic region revealed 4340 (48.52%) and 2295 (25.66%) DMGs in the transcription start sites (TSS) in the 1500 and TSS200 regions, respectively. Both regions were predicted to comprise gene promoters. Moreover, 1500 and 1195 genes, respectively, were hypermethylated in these regions. These findings suggest that gene promoters are more prone to hypermethylation than other intragenic sites (chi-square test, p = 7.353e−16). Furthermore, 454 genes were common in both the DMG and DEG lists. Figure 1 shows that the mRNA expression and CpG methylation profiles of these genes varied between tumor and normal samples.
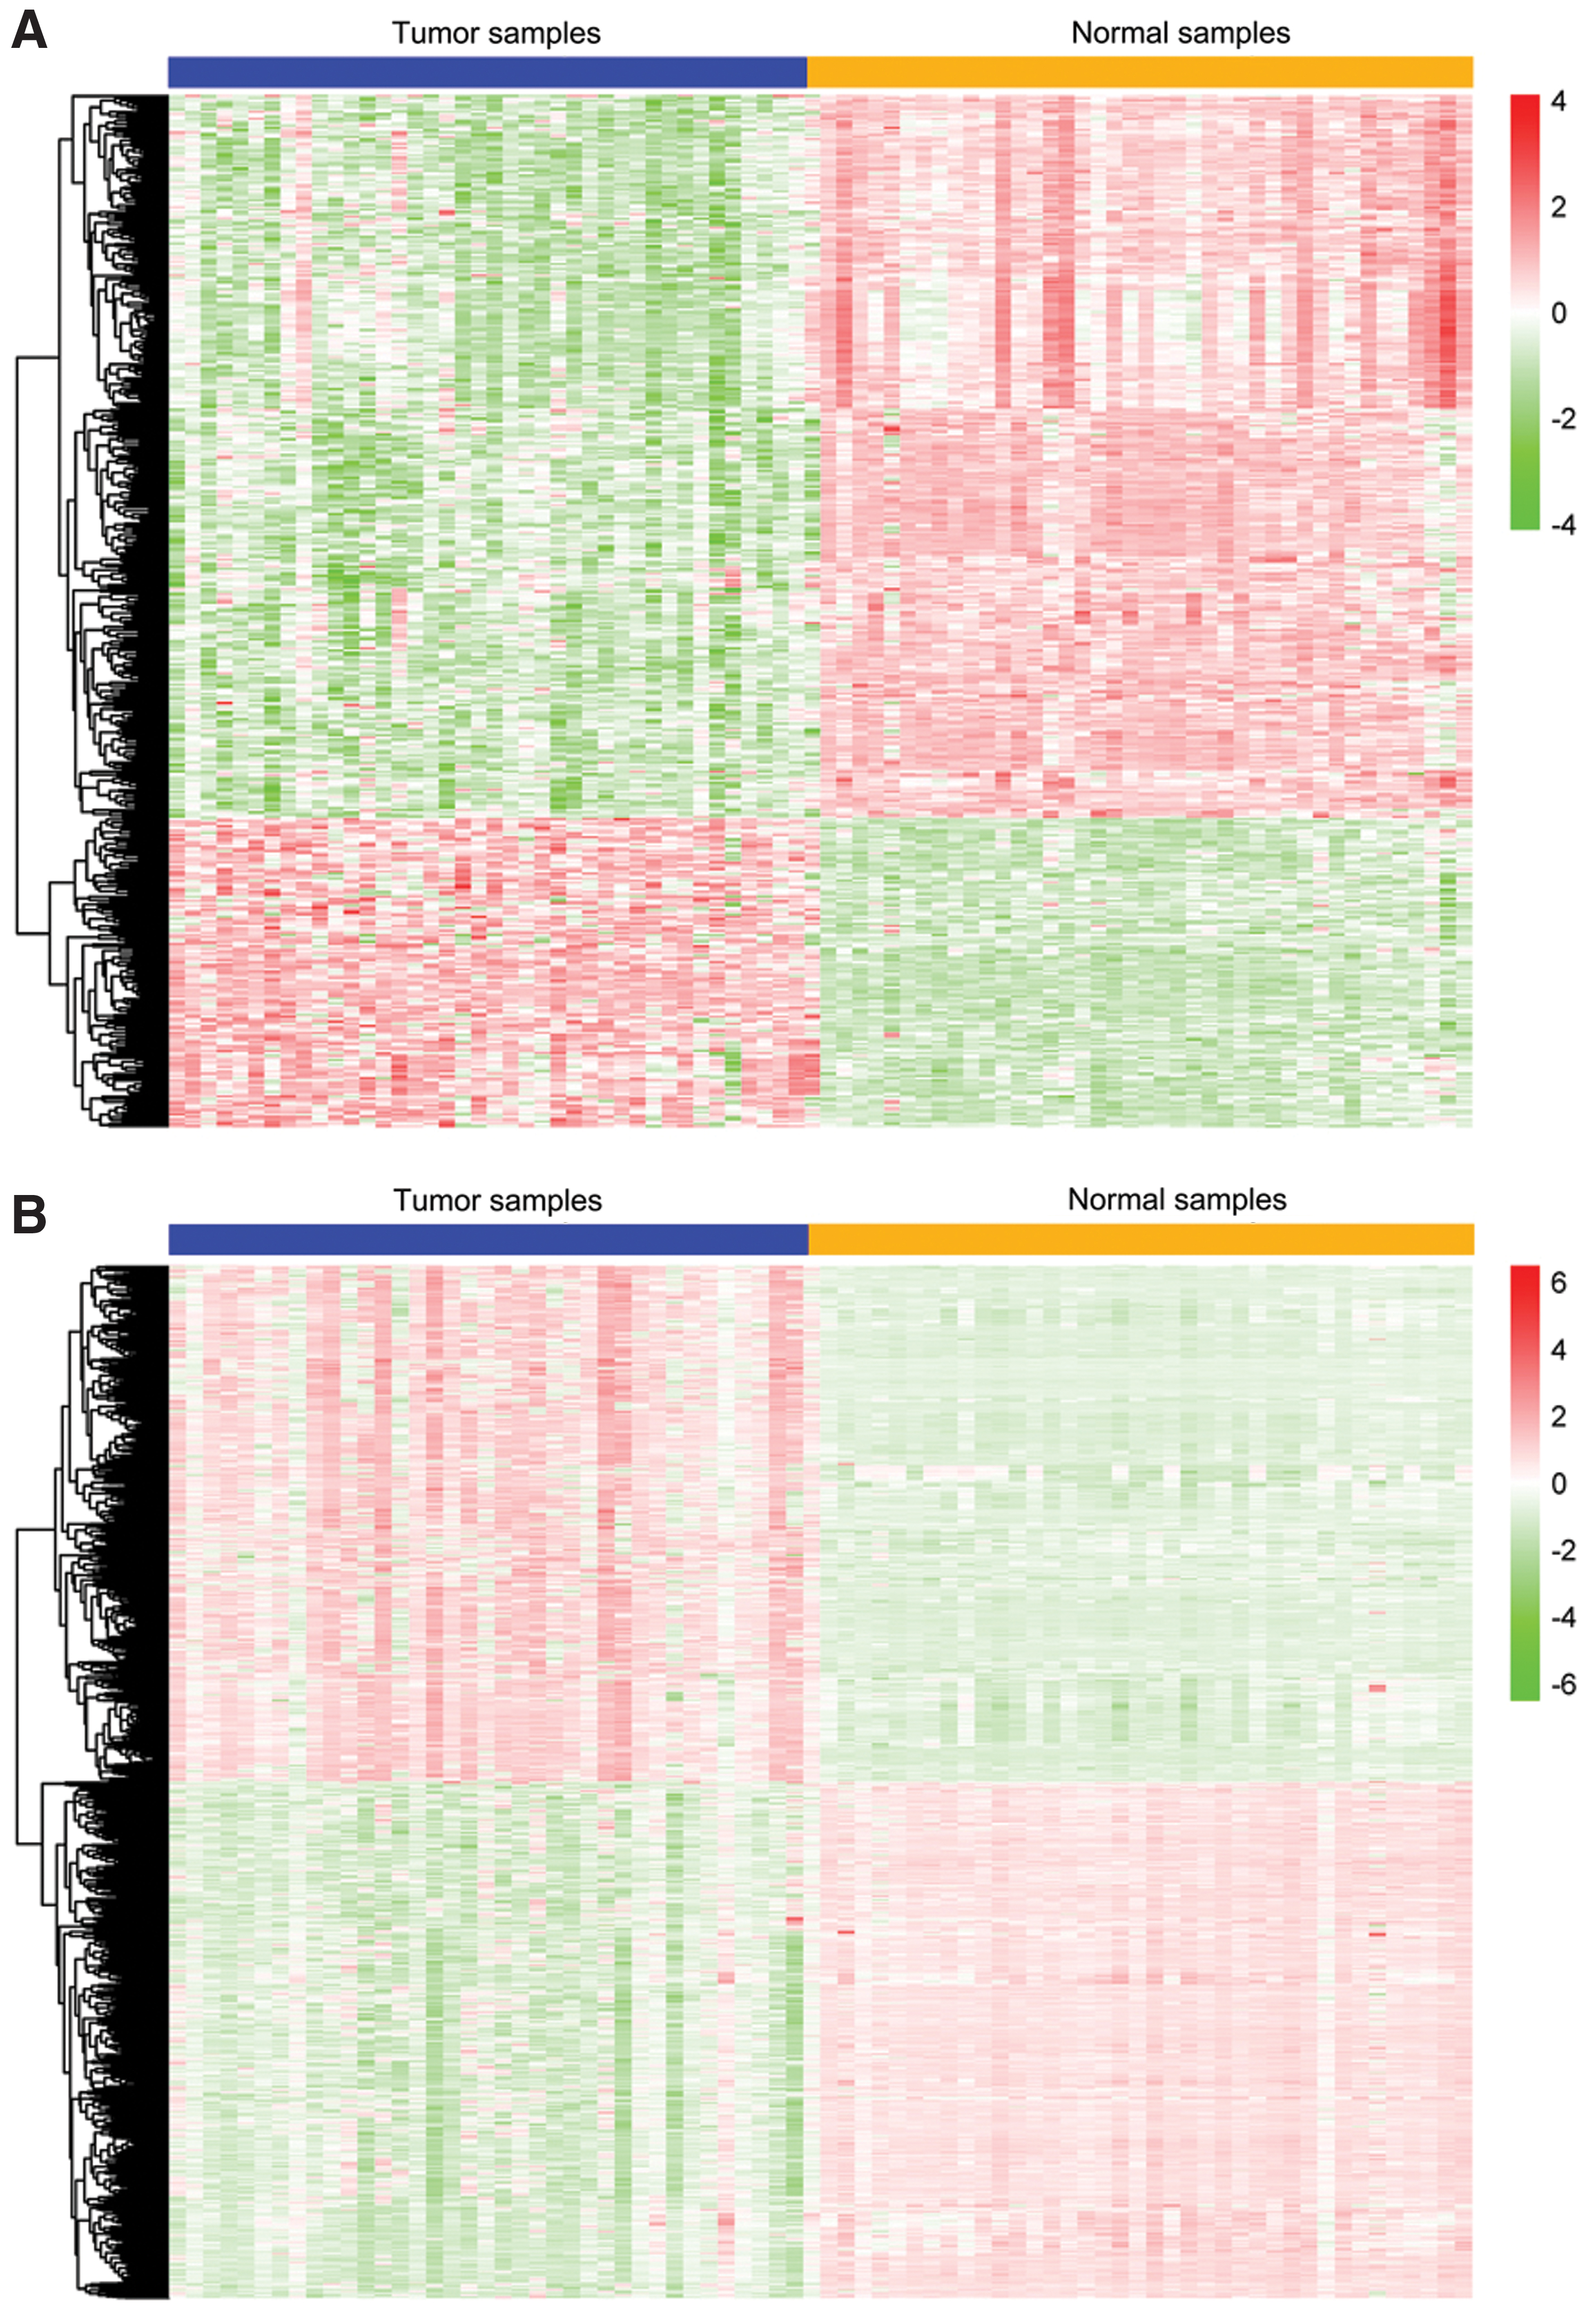
Heatmap shows mRNA expression
Identification of genes with significant relationships between methylation and expression
We evaluated associations between CpG methylation and mRNA expression in the 454 common genes to determine whether CpG methylation influences mRNA expression in CC tissues. We found significant correlations between DNA methylation and gene expression in 415 genes, of which 288 (69.38%) were downregulated in tumor tissues. These 415 genes were considered as epigenetic biomarkers of CC.
Genes were silenced by hypermethylation primarily in TSS1500, TSS200, the 5′ untranslated region (5′UTR), and the first exon, and by hypomethylation predominantly in the body and the 3′UTR (Fig. 2). These results showed that methylation status in various intragenic regions plays different roles in regulating gene expression. Proximal promoter hypermethylation (TSS1500, TSS200, 5′UTR, and the first exon) led to gene suppression, whereas loss of methylation at nucleotides distal to the promoter (body and 3′UTR) inhibited gene expression in tumor tissues.
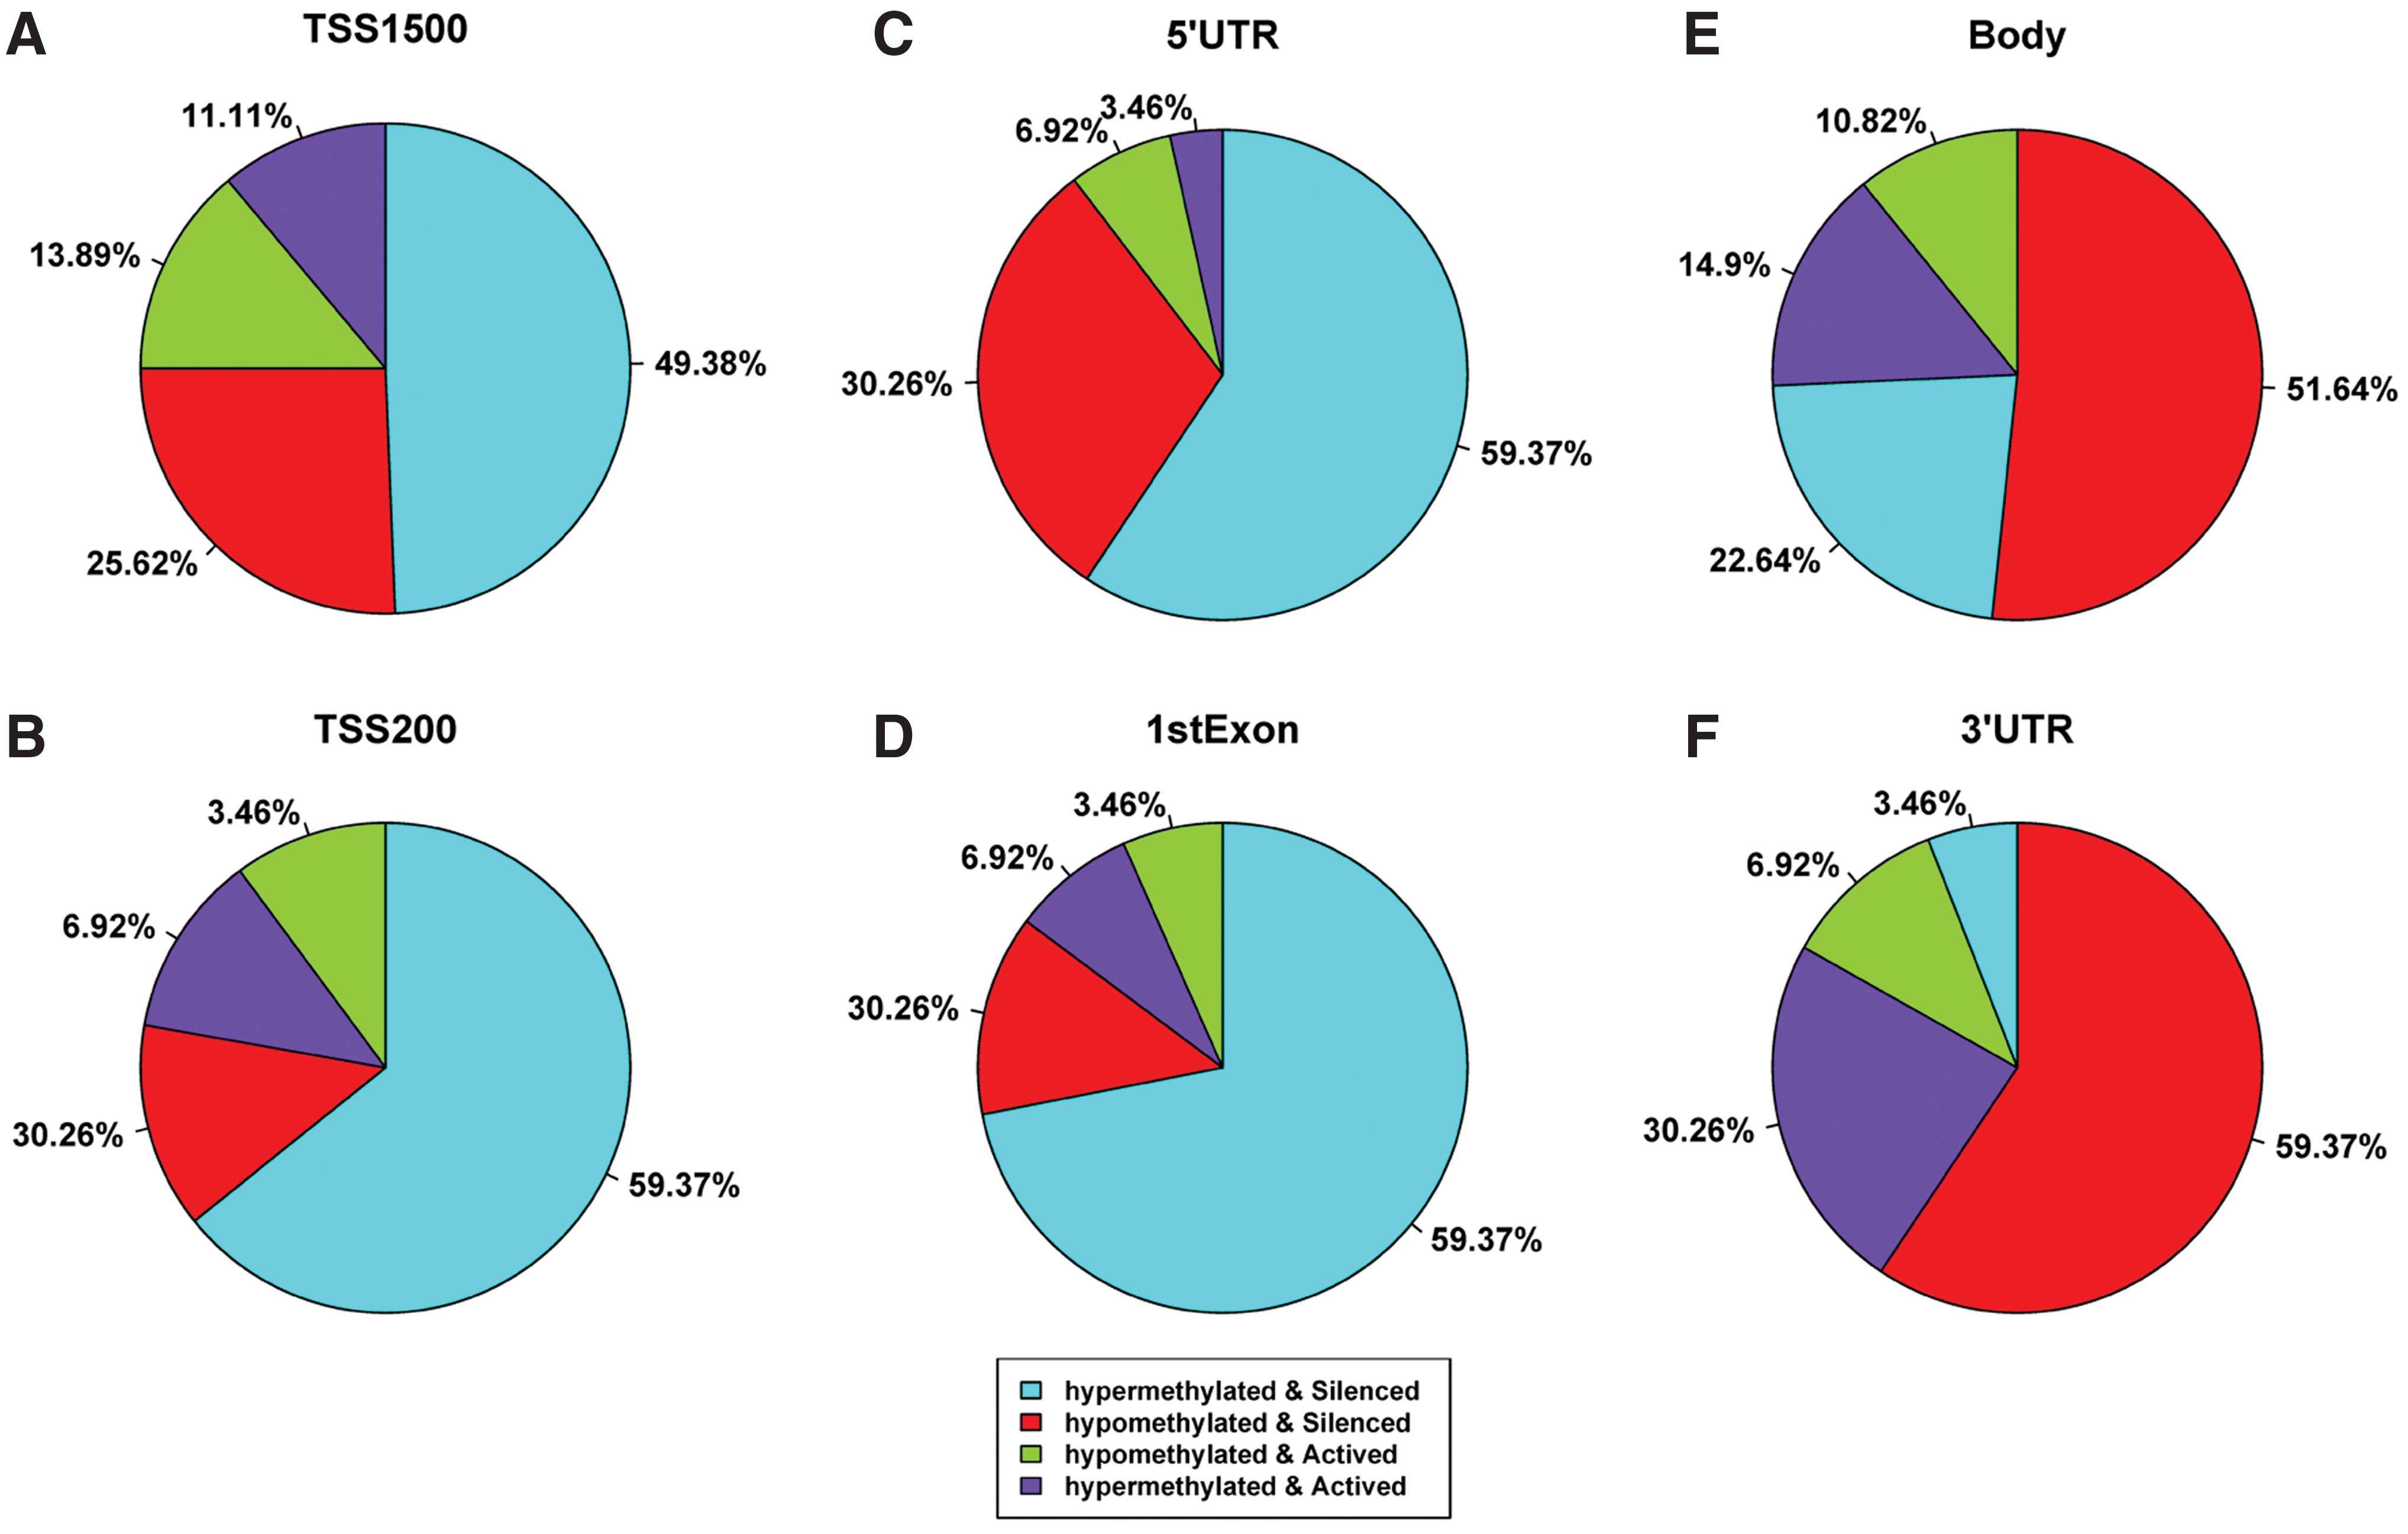
The percentages of gene silencing or activation by hypermethylation or hypomethylation in TSS1500
Functional annotation of epigenetic biomarkers
We investigated the biological functions of the 415 epigenetic biomarkers using overrepresentation analysis. These genes were associated with several cancer-related pathways, such as extracellular matrix organization (p = 4.19 × 10⁻⁸), mitogen-activated protein kinase (MAPK) family signaling cascade (p = 2.64 × 10⁻²), and hedgehog signaling (p = 4.56 × 10⁻²) pathways. The most significant pathway was the extracellular matrix organization pathway, which was enriched with 25 genes.
Identification of prognostic epigenetic biomarkers
We investigated the prognostic value of the 415 epigenetic biomarkers using univariate Cox regression analyses of TCGA set. Ten genes with CpG methylation and mRNA expression levels that were significantly associated with OS (p < 0.05) and validated in GSE39582 comprised unc-5 netrin receptor C (UNC5C), solute carrier family 35 member F (SLC35F)1, Ly6/Neurotoxin (LYNX)1, stathmin (STMN)2, slit guidance ligand (SLIT)3, cell adhesion molecule L1 like (CHL1), CAP-Gly domain containing linker protein family member 4 (CLIP4), transmembrane protein (TMEM) 255A, granzyme B (GZMB), and brain expressed X-Linked (BEX)1 (Table 2).
Prognostic Epigenetic Biomarkers
DE, differentially expressed; DM, differentially methylated.
We compared OS between high and low expression and methylation of each of the 10 prognostic genes using Kaplan–Meier analysis. The GZMB gene possessed a differentially methylated site (cg18118198) in its coding region. Figure 3A and B shows that the OS of patients was significantly longer when tumors had high, rather than low methylation status (p = 0.11) in TCGA set. Figure 3C–F shows that survival was better for patients with tumors that expressed high, rather than low GZMB in TCGA (marginally significant; log-rank p = 0.059) and GSE39582 (log-rank p < 0.0001) sets. These results supported the notion that GZMB is a potential tumor-suppressor gene. Among the 10 prognostic genes, only GZMB was associated with the relationship between mRNA expression and OS in both TCGA and GSE39582 sets (Fig. 3). Therefore, we further analyzed GZMB.
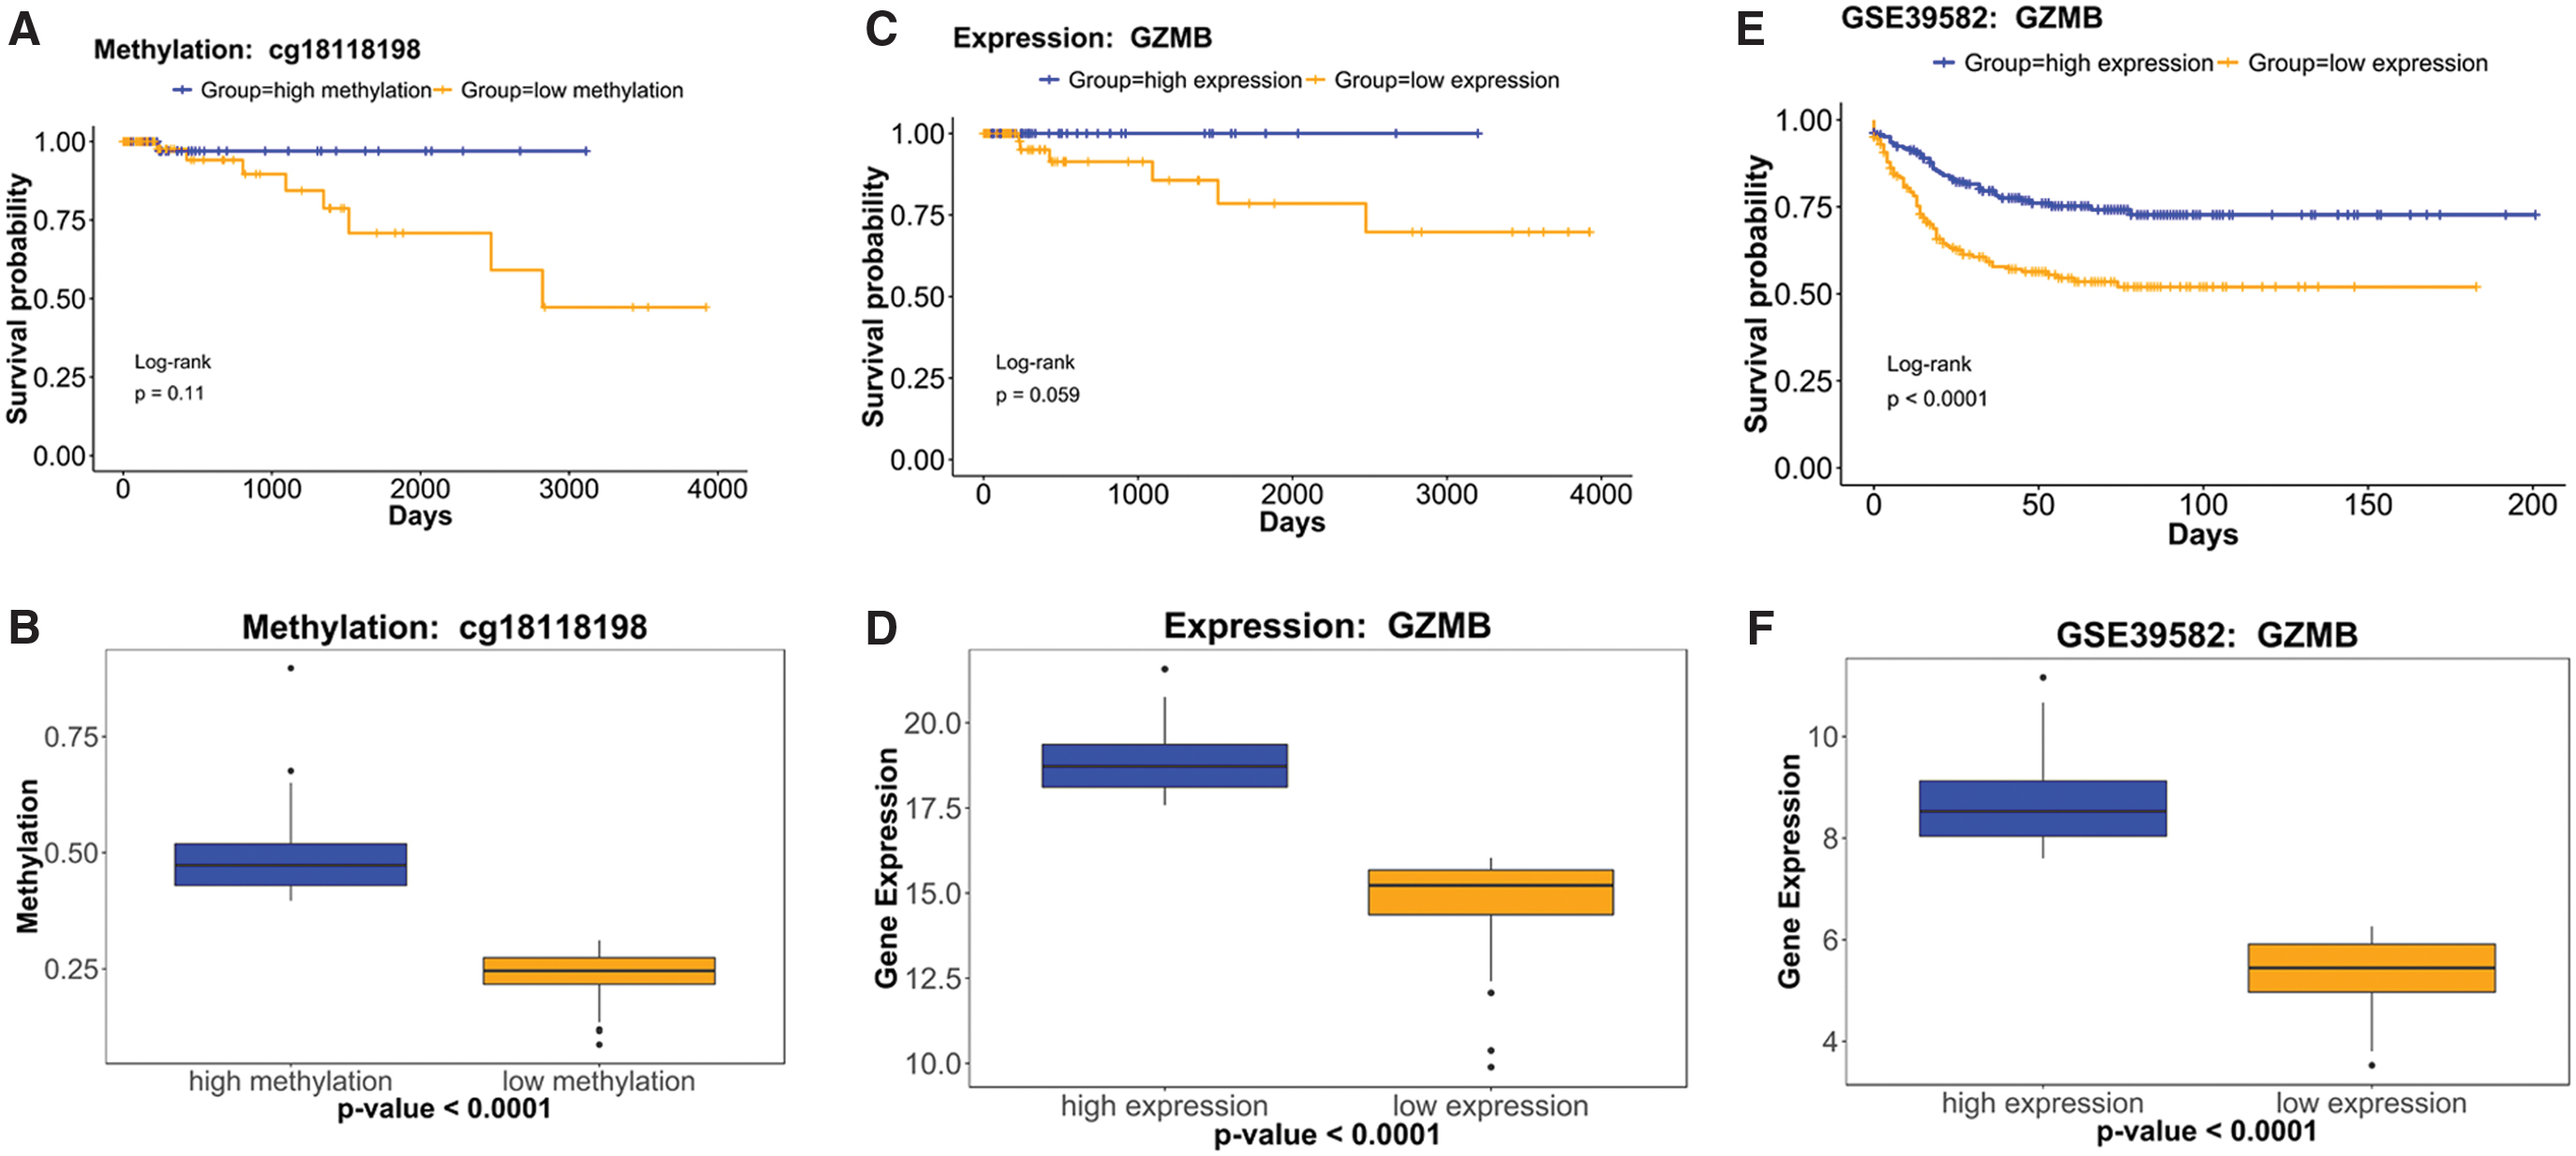
Associations between survival of patients according to GZMB expression and methylation.
Identification of optimal prognostic models associated with GZMB
We created the following prognostic models of GZMB expression and methylation from TCGA data and clinical stages of tumors: model 1, clinical stage; model 2, GZMB expression; model 3, GZMB methylation; model 4, GZMB expression and methylation; model 5, GZMB expression, methylation, and clinical stage. The C indices of the models 1–5 were 0.56, 0.76, 0.67, 0.73, and 0.75, respectively. The prognostic performance of the models was validated by 100 Monte Carlo cross-validations. Figure 4 shows that the median C indices of models 1–5 were 0.33, 0.74, 0.67, 0.68, and 0.70, respectively. The results of Wilcox rank-sum tests showed that the median C index was significantly lower for model 1 than for models 2, 3, 4. and 5 (p = 1.72 × 10−09, 1.91 × 10⁻¹⁰, 7.96 × 10⁻¹¹, and 8.38 × 10⁻¹², respectively). Among these, models 2, 4, and 5 were more accurate, indicating that GZMB expression and methylation is prognostically significant for CC.
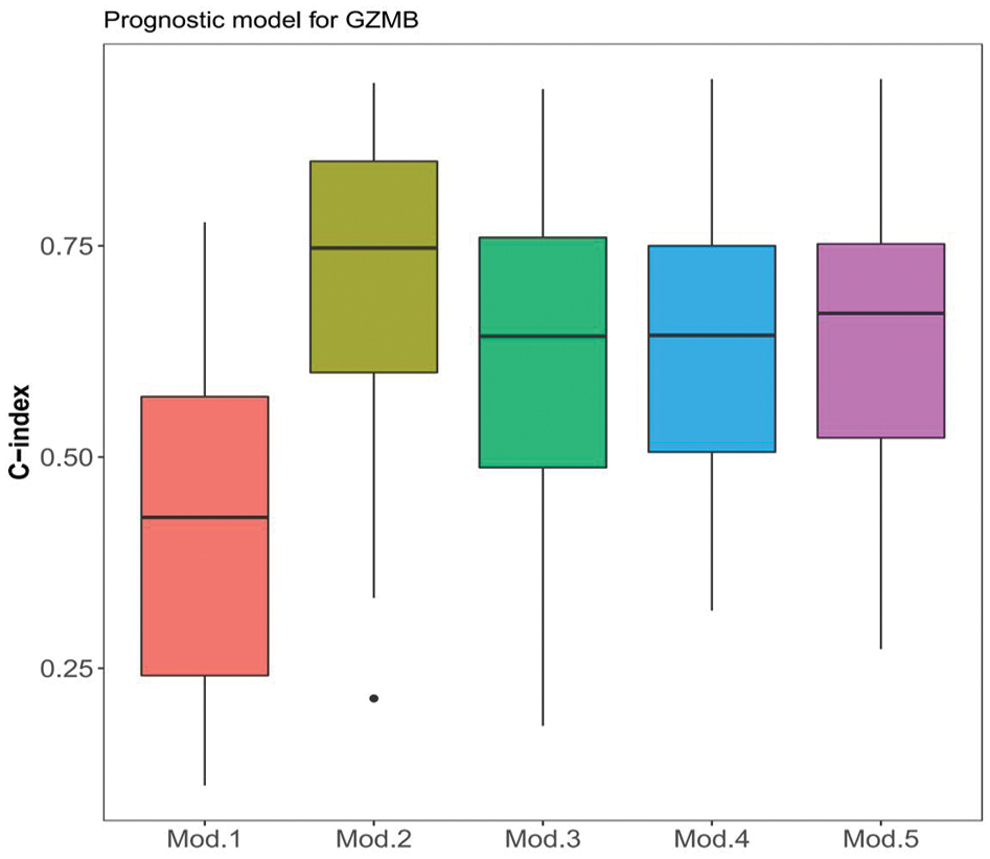
C indexes for five prognostic models. Prognostic models are marked in different colors. Color images are available online.
Several signaling pathways might be associated with GZMB in CC
We found 202 DEGs between groups with high and low GZMB expression in TCGA set. These genes were significantly involved in natural killer (NK) cell-mediated cytotoxicity, cytokine–cytokine receptor interaction, and chemokine signaling pathways (Fig. 5).
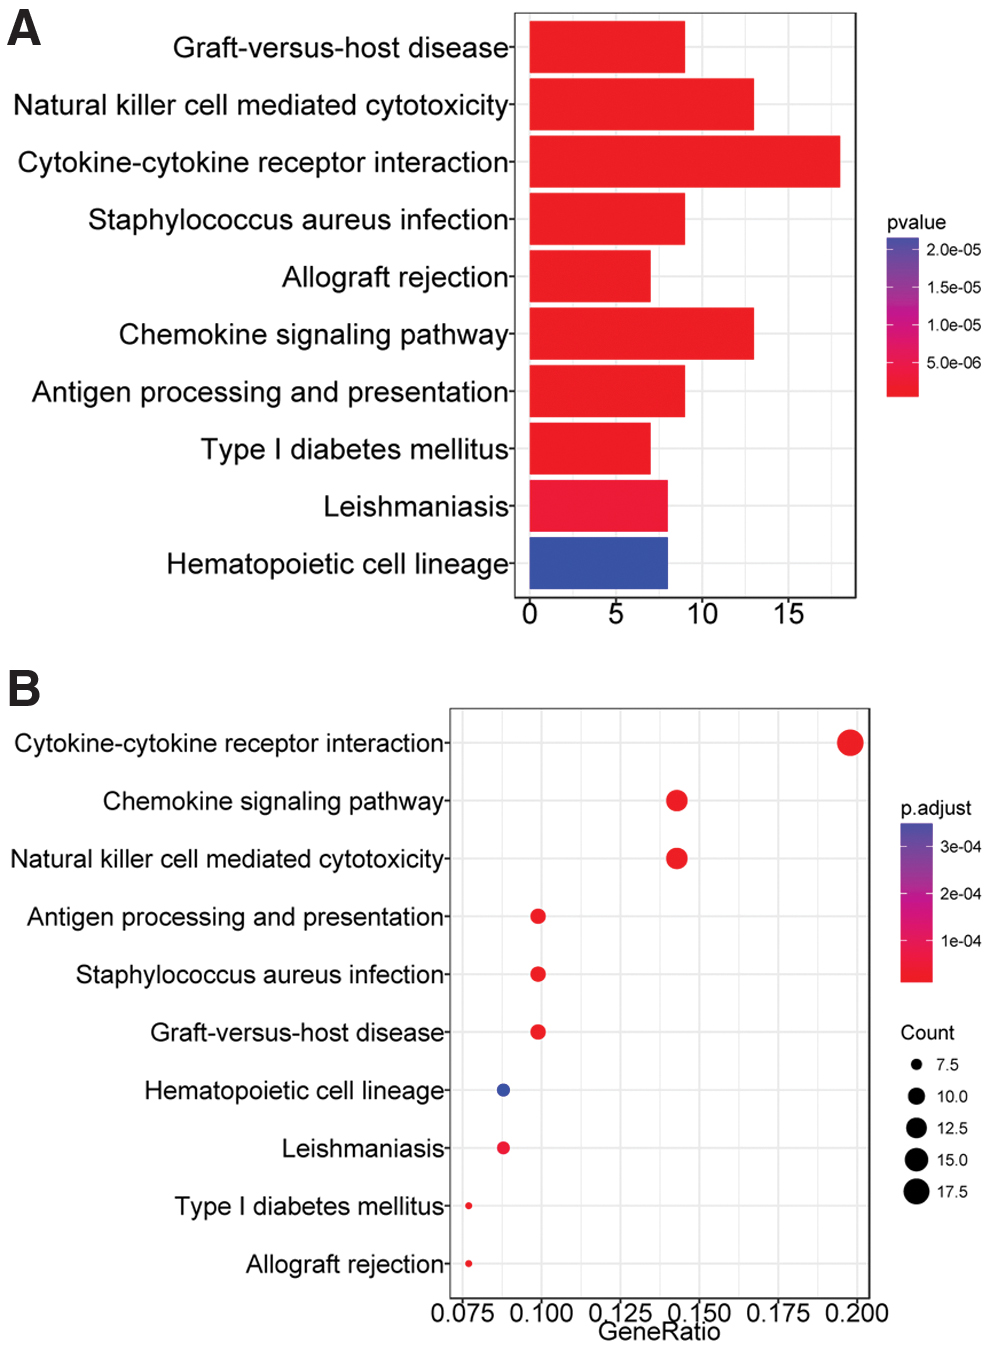
Significant signaling pathways associated with DEG between high and low GZMB expression groups in TCGA set. Top 10 most significant signaling pathways
Discussion
Epigenetic alterations are emerging as cancer biomarkers that facilitate the development of new assays to assist with patient management (Costapinheiro et al., 2015). Promoters are hypermethylated in various tumor suppressor genes (Min et al., 2016). We found 8944 DMGs among which 2750 had hypermethylated promoters (TSS1500+TSS200). This study focused on genes that were not only differentially expressed and methylated, but also significantly associated with CpG methylation and mRNA expression. We found 415 DEGs and DMGs with this significant relationship and considered then epigenetic biomarkers of CC. These genes were functionally related to extracellular matrix organization, MAPK family signaling cascades, and hedgehog signaling pathways. These pathways are critical for carcinogenesis. Moreover, hedgehog pathway activation is reportedly associated with worse survival among patients with CRC (Papadopoulos et al.,
The present study associated the UNC5C, SLC35F1, LYNX1, STMN2, SLIT3, CHL1, CLIP4, TMEM255A, GZMB, and BEX1 genes with the prognosis of CC at the methylation and expression levels. Notably, UNC5C, which belongs to the UNC5H family of transmembrane receptors, is abnormally methylated in CRC, and it might serve as a tumor suppressor gene (Hibi et al., 2009). Furthermore, UNC5C methylation negatively correlates with expression; thus UNC5C might be a prognostic biomarker of CRC (Wu et al., 2017). Methylation profiling based on BeadChip arrays has revealed aberrant SLIT3 and CHL1 methylation in CRC (Kim et al., 2011). The CHL1 gene encodes cell adhesion molecule L1-like protein that is differentially expressed in CC (Senchenko et al., 2011), and BEX1 is methylated in >80% of CRC cell lines (Lind et al., 2011). Despite these significant findings, the roles of SLC35F1, LYNX1, STMN2, CLIP4, and TMEM255A in CRC remain obscure as far as we can ascertain. The present findings suggested that the 10 genes described herein can serve as prognostic epigenetic biomarkers of CRC, and thus as candidate therapeutic targets.
Notably, only GZMB among these 10 genes had the same correlative trends between gene expression and prognosis in TCGA and GSE39582 validation sets. The serine protease granzyme B, encoded by the GZMB gene, is expressed in cytotoxic T lymphocytes and NK cells (Lord et al., 2003), and is implicated in cytotoxic lymphocyte-mediated apoptosis and inflammation (Rousalova and Krepela, 2010; Hiebert and Granville, 2012). Moreover, GZMB might be a promising tumor-suppressor gene in CRC, because OS was significantly longer for patients when tumors had high expression or high methylation. Prognostic predictions were more accurate in models based on GZMB gene expression and/or methylation than clinical stage. These findings further confirmed the prognostic value of GZMB for CRC. Tumor-infiltrating T cells are prognostically significant in CRC (Deschoolmeester et al., 2010; Frey et al., 2010) and increased tumor infiltration by cells expressing GZMB is a predictor of survival for patients with CRC (Prizment et al., 2017). Furthermore, according to the results of pathway enrichment analysis, the DEGs identified between groups with high and low GZMB expression in TCGA set were functionally implicated in various signaling pathways associated with immune processes such as NK cell-mediated cytotoxicity, cytokine–cytokine receptor interaction, and chemokine signaling pathways. The present findings indicate that GZMB functions in CC progression by regulating these immune-related signaling pathways.
Conclusions
Ten prognostic epigenetic biomarkers for CC were identified and validated via an in-depth analysis of DNA methylation and mRNA expression in CC tissues. The GZMB gene is a potential tumor suppressor in CC that might participate in CC development via the modulation of immune-related pathways. Prognostic models based on GZMB gene expression and/or methylation accurately predicted survival. The 10 epigenetic biomarkers might serve as promising targets for the diagnosis and personalized treatment of CC. A major limitation of this study was the low number of experiments. Therefore, our results require further validation based on far more CC tissue samples.
Authors' Contributions
Y.Y.W. and X.Y.W. participated in the design of this study, and they both performed the statistical analysis. G.L.J., Z.H.X., and Y.M.T. carried out the study and collected important background information. Z.Y.S. and T.H.D. drafted the article. All authors read and approved the final article.
Footnotes
Disclosure Statement
No competing financial interests exist.
Funding Information
No funding support was received for this study.