




Abstract
Neuroblastoma (NB) has the highest incidence of all extracranial solid tumors in children and is highly lethal. This study aims to establish a prognostic model of NB with MYCN-related genes. We determined the gene expression profiles of 900 NB samples from the UCSC database and four Gene Expression Omnibus (GEO) data sets, and performed a comprehensive bioinformatics analysis and clinical sample verification. After univariate Cox regression, least absolute shrinkage and selection operator (Lasso), and multivariate Cox regression analyses, four (AKR1C1, CHD5, PDE4DIP, and PRKACB) genes were finally selected and used to construct a risk score prognostic model. In the UCSC data set, the high-risk group exhibited a significantly worse prognosis than the low-risk group. In addition, the nomogram, which includes prognostic markers and clinical factors, demonstrates high prognostic value. Finally, the differential expression of the four genes in the model was verified by quantitative real-time PCR in clinical tissues. These findings of MYCN-related genes provide a new and reliable prognostic model for NB related to MYCN.
Introduction
Neuroblastoma (NB) is the most common extracranial solid tumor in children, as it accounts for ∼15% of childhood cancer deaths (Coughlan et al., 2017). NB shows obvious heterogeneity in terms of its biological and clinical characteristics, and the prognosis of patients with NB is diverse. For example, NB tumors in children who are younger than 12 months at onset usually undergo spontaneous regression or maturation into benign ganglioneuromas. In contrast, NBs present in most patients >18 years of age exhibit an aggressive phenotype and are associated with a poor prognosis (Maris et al., 2007). Multiple treatment modalities have been established for NB, including surgical resection, multidrug chemotherapy, radiotherapy, autologous hematopoietic stem cell transplantation, and immunotherapy. With the development of multimodal treatment strategies, the treatment effects on patients with low-grade NB have significantly improved. However, the 5-year survival rate of high-risk NB patients is still <50% (Maris, 2010; Park et al., 2013; Irwin and Park, 2015). For individual patients, the survival benefits of these treatments, which also have side effects, are questionable. NB should be managed through individualized systemic therapy, which can prolong survival and improve quality of life. Therefore, the development of new prognostic models for NB patients with a poor prognosis is urgently needed. This way, effective treatments can be selected to balance the side effects and survival benefits, and health care professionals can elect whether to administer more aggressive treatments. Presently, although some pathological indicators of NB, such as Children's Oncology Group (COG) risk stratification, MYCN amplification status, and International NB Staging System (INSS) stage, have been used to predict the prognosis of patients, they have not been able to fully meet the needs of personalized treatment for NB (Brodeur et al., 1993).
Advances in tumor molecular biology have promoted the development of new prediction tools based on prognosis-related genes. These prognostic markers that reflect tumor progression at the molecular level may help to better achieve personalized survival prediction. Progress in gene chip and high-throughput sequencing technology has revealed that prognostic gene markers at the mRNA level can predict the overall survival rate of NB patients. Zhong et al. proposed a four-gene signature based on clinicopathological and gene expression data that can accurately predict the overall survival rate of patients in the GSE16476 and GSE45480 data sets (Zhong et al., 2018). Wang et al. (2020a) proposed the prognostic significance of certain genes related to N-myc in NB using the TARGET and Gene Expression Omnibus (GEO) data sets. Therefore, in-depth exploration of public data sets (e.g., GEO, The Cancer Genome Atlas [TCGA]) may reveal other N-myc-related and prognosis-related genes and establish reliable prognostic gene characteristics. This combined with clinicopathological parameters may be a powerful tool that can be used to predict the prognosis of NB patients and to determine individualized treatment strategies.
In this study, we have integrated four NB data sets from the GEO database to identify differentially expressed genes (DEGs). Univariate and Lasso-Cox regression analyses were used to determine DEGs related to overall survival, and prognostic gene signatures were proposed based on gene expression and clinical data from the UCSC data set. A multivariate Cox survival analysis was used to determine independent prognostic factors for overall survival. A prognostic nomogram consisting of prognostic gene characteristics and clinical prognostic factors was established to predict the overall survival rate. Finally, the expression of the prognostic gene signature was verified in clinical tissues using quantitative real-time PCR
Materials and Methods
Acquisition of gene expression and clinical data
The mRNA expression and clinical data of the NB patients were searched and downloaded from the GEO using the keyword “NB.” The results were screened for the terms “Homo sapiens” and “Expression profiling by array.” The terms “Cell line” and “Mus musculus” were excluded from the search. The gene expression microarray data sets GSE49710, GSE73517, GSE16237, and GSE3960 were selected and downloaded for DEG analysis. The data sets met the following criteria: (1) Human NB tissue samples (without chemotherapy); (2) MYCN amplification status available for all samples; (3) ≥50 samples. Probes were matched to the gene symbols using the annotation files provided by the manufacturer. The median ranking value accounted for the expression value if multiple probes matched a single gene. Robust multiarray average-normalized data were log2-transformed for further analysis.
In all, data of 150 samples with accompanying clinical information were downloaded from the UCSC Xena (June 20, 2020) database for the establishment of prognostic models. This data set contained 150 samples with corresponding tumor tissue and clinical information.
DEG identification and bioinformatic DEG analysis
DEGs between MYCN-amplified and MYCN-nonamplified tissues were identified using Limma package in R. |Log2FC| > 1.5, p < 0.05, and a false discovery rate <0.05 were set as the cutoffs for the DEGs. We then used web tools to calculate their intersection. GO enrichment and Kyoto Encyclopedia of Genes and Genomes (KEGG) pathway analysis were used to explore the potential biological processes, cellular components, and molecular functions of the DEGs. The Database for Annotation, Visualization, and Integrated Discovery (DAVID) was used to identify important signaling pathways, and p < 0.05 was considered statistically significant (Huang da et al., 2009). The STRING database was used to explore potential interactions between DEGs with a confidence score ≥0.4 (Szklarczyk et al., 2015). The protein–protein interaction (PPI) network of the DEGs was constructed and visualized using Cytoscape v. 3.7.1. The Cytoscape plug-in cytoHubba was used to identify hub nodes by the maximal clique centrality (MCC) method. Densely connected clusters in the PPI network were identified with the Cytoscape plug-in MCODE using the default parameters. GO enrichment analysis was performed on DEG clusters.
Identification of survival-related DEGs and establishment of prognostic gene signatures
The UCSC data set was used to identify DEGs associated with overall survival. The expression levels of the DEGs identified by integrated analysis of GEO data sets were analyzed using a univariate Cox proportional hazards regression model. DEGs with p < 0.05 were considered statistically significant and were included in subsequent analyses. Lasso-penalized Cox regression analysis was performed to further reduce the number of DEGs in the selected panel with the best predictive performance using 10-fold cross-validation based on the glmnet package in R. A prognostic gene signature of NB patients was constructed based on a linear combination of the regression coefficients (β) derived from the Lasso-Cox regression model (Lambda 1se) multiplied by the mRNA expression level.
Verification of the predictive ability of the prognostic gene signature
To verify the independence and superiority of the prognostic gene signature, a univariate survival analysis was performed on the prognostic genes in the UCSC data set, and the predictive ability of the prognostic gene signature combined with the clinicopathological parameters, including INSS stage and COG risk stratification, was determined. The relationship between AKR1C1, CHD5, PDE4DIP, and PRKACB gene expression and prognosis was queried using the UCSC web tool.
Development and validation of the nomogram
After the multivariate analysis and PH test were performed to eliminate inappropriate factors, the predictive factors, including gender, INSS stage, COG risk stratification, and the DEG score, were all used to construct the nomogram. The consistency index and calibration curve were then used to evaluate the discrimination and accuracy of the nomogram.
Preparation of human NB samples
This study was approved by the Institutional Review Board of the Children's Hospital of Chongqing Medical University. After patients provided informed consent, the tissue was obtained from NB patients and immediately stored at −80°C until use. Seven MYCN-amplified tissue samples and 23 MYCN-nonamplified tissue samples were collected.
Verification of the expression of the prognostic gene signature in tissues
Total RNA was extracted using TRIzol reagent (Servicebio, Wuhan, China). Reverse transcription into cDNA and qRT-PCR were performed using 2 × SYBR Green qPCR Master Mix (High ROX) (Servicebio) according to the protocol provided with the Servicebio®RT First Strand cDNA Synthesis Kit (Servicebio). The relative expression levels were obtained by normalizing the values to those of glyceraldehyde phosphate dehydrogenase (GAPDH). Each reaction was performed in triplicate. The primers used are listed in Table 1. CBioPortal was used to query the relationship of the expression of the AKR1C1, CHD5, PDE4DIP, and PRKACB genes with MYCN status, INSS stage, and COG risk stratification.
Primer Sequences
CHD5, chromodomain, helicase DNA-binding protein 5; GAPDH, glyceraldehyde phosphate dehydrogenase; PDE4DIP, phosphodiesterase 4D interacting protein; PRKACB, a member of the Ser/Thr protein kinase family.
Statistical analysis
All statistical analyses were performed using R software (version 4.0.2). Statistical tests were all two-sided.
Results
Identification of DEGs
This study was performed according to the flowchart illustrated in Figure 1. Details of the GEO data sets in this study are shown in Supplementary Table S1. Four sets of DEGs (from the GSE49710, GSE73517, GSE16237, and GSE3960 data sets) were identified between MYCN-amplified tissue and MYCN-nonamplified tissue and each data set consisted of 3424, 2942, 1185, and 524 DEGs (Supplementary Fig. S1A–D). After the intersection of the Venn diagrams, 133 DEGs were identified, including 19 upregulated genes and 114 downregulated genes (Fig. 2A–B and Supplementary Table S2).

Flowchart of this study. GEO, Gene Expression Omnibus; UCSC, University of California Santa Cruz; NB, neuroblastoma.

Screening of DEGs.
Functional enrichment and PPI network analysis of the DEGs
The GO and KEGG pathway enrichment analyses were used to determine the functions of the DEGs (Table 2 and Fig. 3A–B). The results showed that these genes were mainly enriched in signal transduction, cell adhesion, and negative regulation of cell proliferation (Supplementary Fig. S2A). This is consistent with the metastatic and aggressive nature of NB. Moreover, most of the proteins encoded by these genes are located in the plasma membrane or extracellular exosomes (Supplementary Fig. S2B). The molecular functions of the DEGs were mostly enriched in protein binding and receptor binding, as shown in Supplementary Figure S2C. The KEGG pathway analysis showed that the enriched pathways were mainly related to cocaine addiction, dopaminergic and serotonergic synapse, axon guidance, Parkinson's disease, and cell adhesion molecules (Fig. 3B).


The Enriched Gene Ontology Terms
BP, biological process; CAMs, cell adhesion molecules; CC, cellular component; GO, Gene Ontology; KEGG, Kyoto Encyclopedia of Genes and Genomes; MF, molecular function.
A PPI network of DEGs that included 132 nodes and 177 interactions was constructed to identify gene interactions (Fig. 3C). Node degree and betweenness were calculated by the MCC method to obtain hub nodes. The top 30 candidate hub genes that were identified may play a central role in this network (Fig. 3D). A module analysis identified significant clustering modules in the PPI network. One clustering module with the highest score was obtained (Fig. 3E). Functional enrichment analysis showed that the module's score of 5.778 is related to cocaine addiction, Parkinson's disease, and synapses. The PPI network analysis showed that the DEGs are involved in NB progression, especially cell differentiation and neurodevelopment.
Identification of survival-related DEGs and establishment of the four-gene prognostic signature
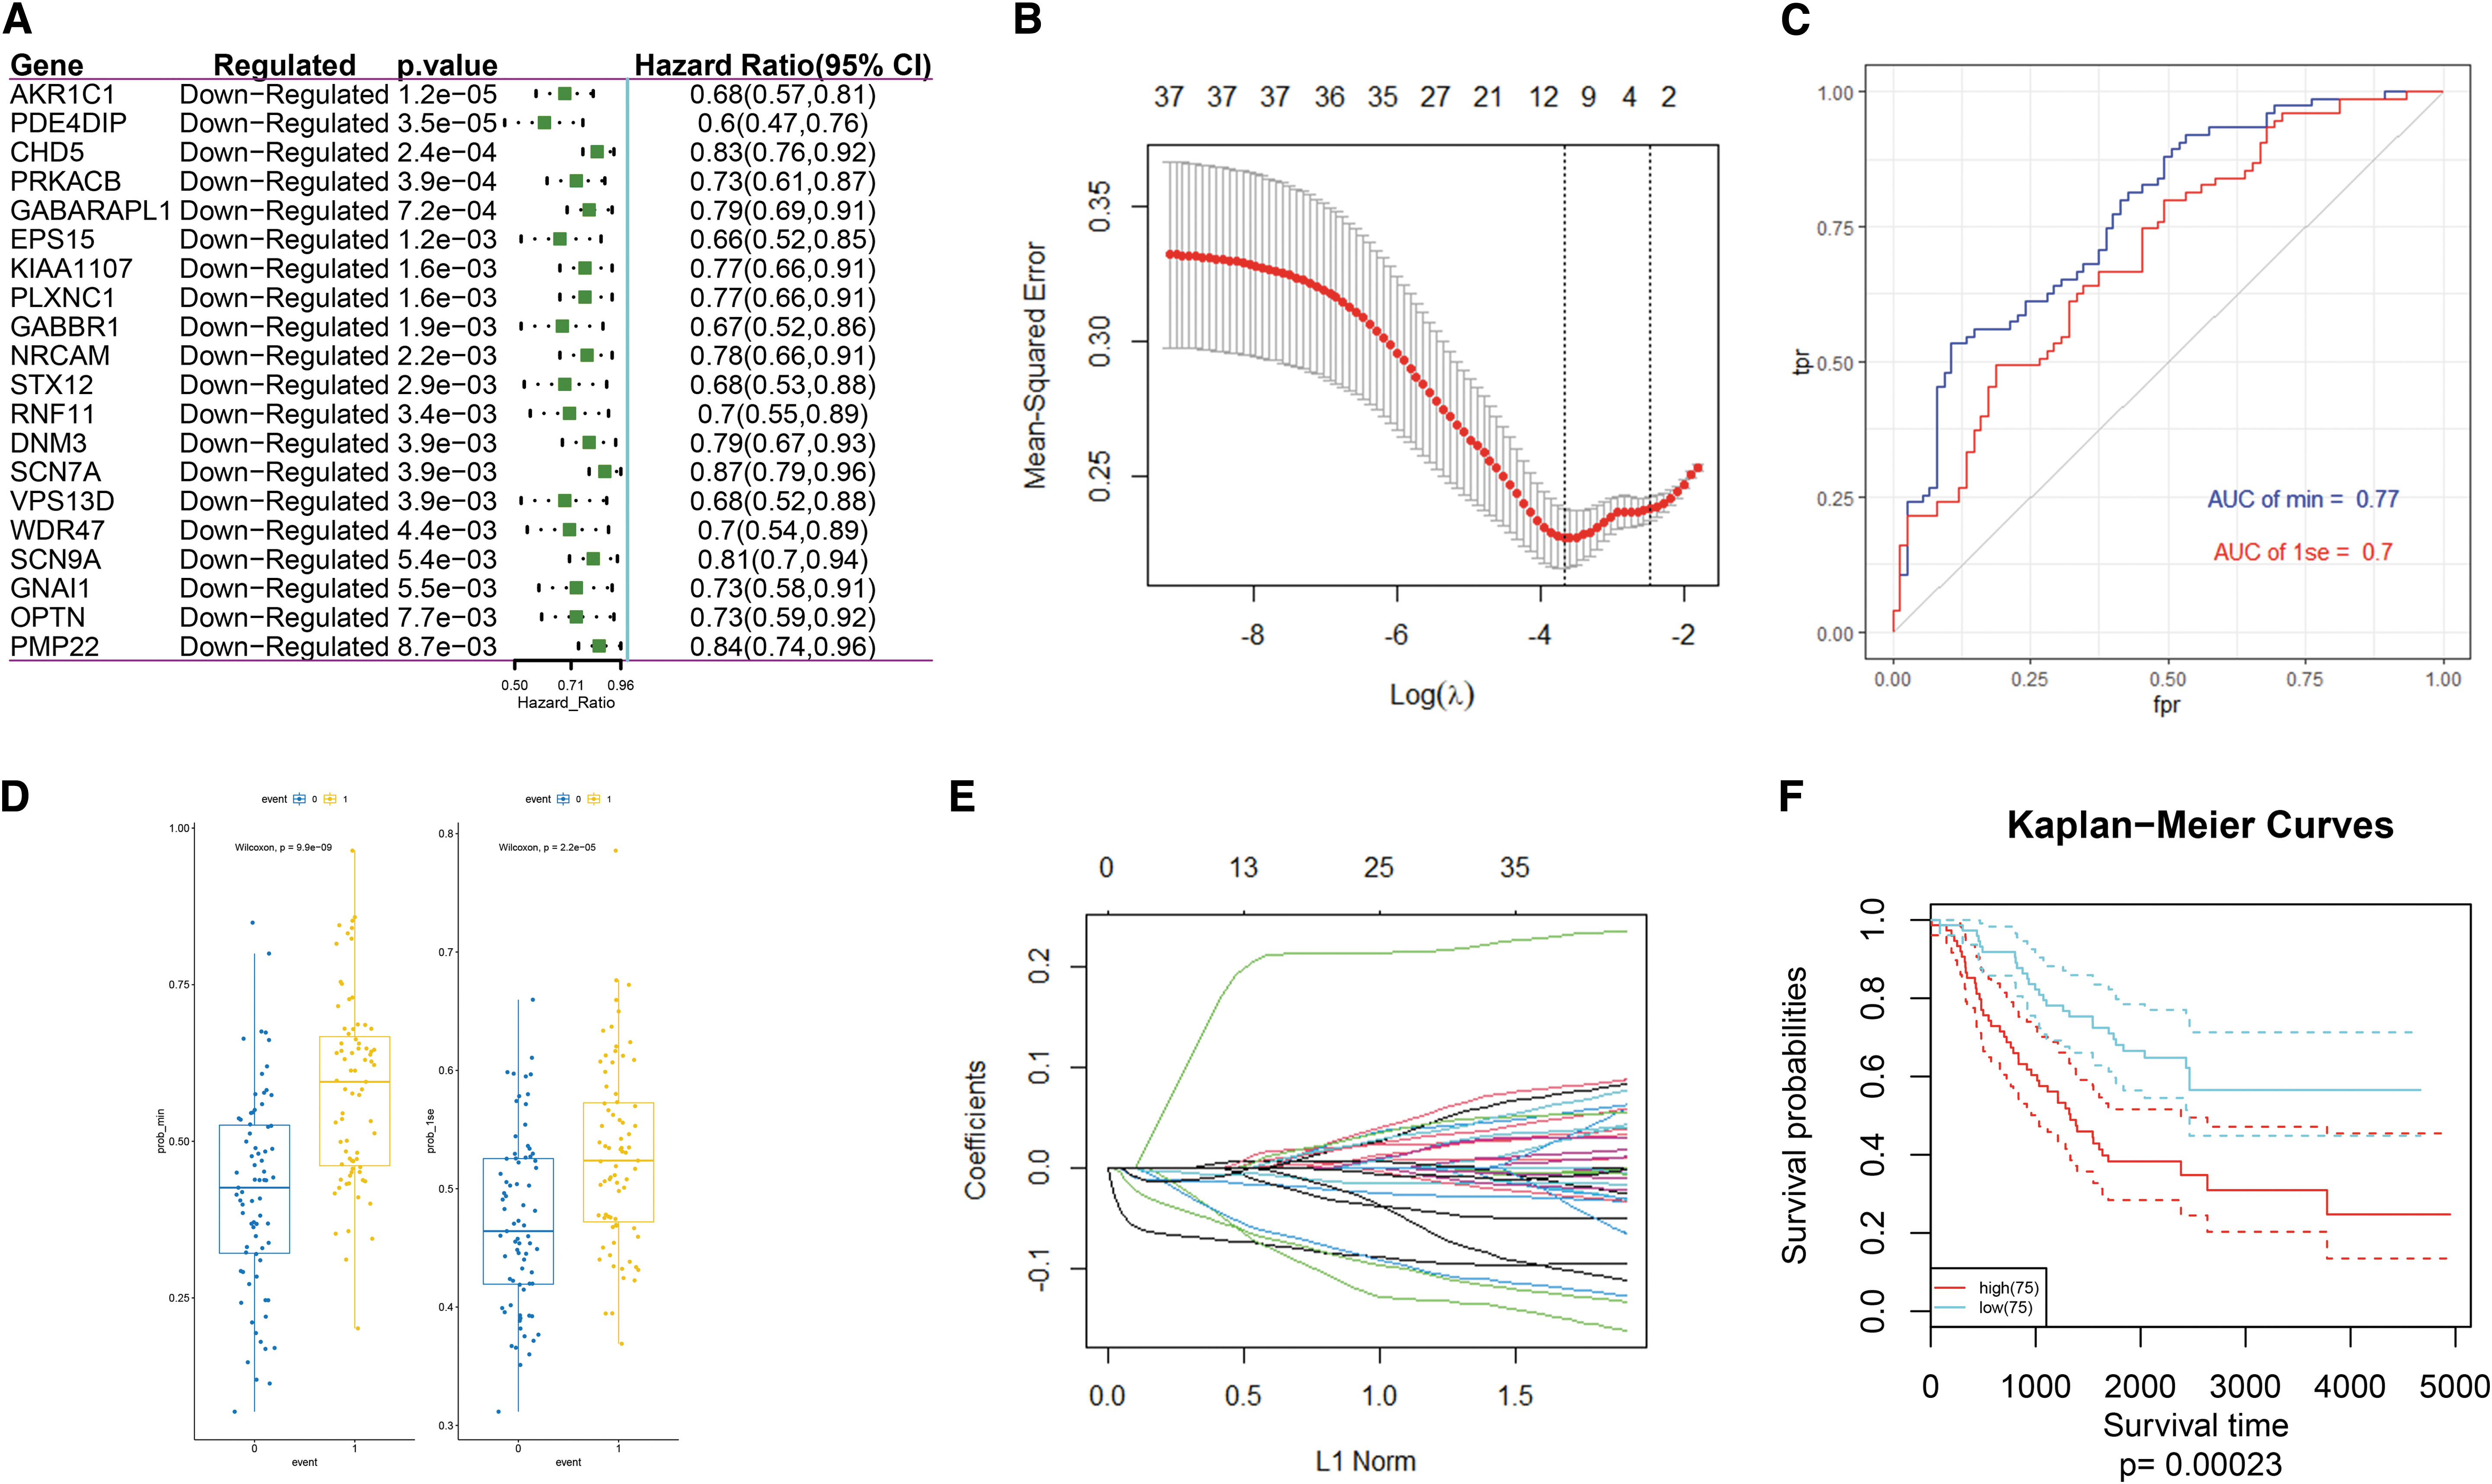
The subsequent survival analysis included 150 patients with accompanying clinical information from the UCSC data set (Supplementary Table S3). In all, 37 DEGs were found to be significantly associated with overall survival based on the univariate Cox regression model (p < 0.05, Fig. 4A and Supplementary Table S4). A survival model with AKR1C1, ATP6V0B, CHD5, EPS15, GABARAPL1, HK2, PDE4DIP, PLXNC1, and PRKACB (lambda min = 0.02522769) and AKR1C1, CHD5, PDE4DIP, and PRKACB (lambda 1se = 0.08455319) as prognostic genes was established by Lasso analysis (Fig. 4B). Through a comparison of the receiver operating characteristic (ROC) curve and box plot, the model with a lambda min = 0.02522769 was shown to have better predictive performance than the model with a lambda 1se = 0.08455319 (Fig. 4C, D), but the former requires more genes; however, both models are effective for predicting the overall survival. The predictive effect in terms of the survival rate is very good (Area Under roc Curve [AUC] >0.7), and thus, the model of lambda 1se = 0.08455319 was used (Fig. 4E). The Kaplan–Meier survival curves that were used to divide the samples into the high- and low-risk groups according to the risk score formula were used to evaluate the predictive ability of the lambda = 0.08455319 survival model (Fig. 4F). A risk score calculation formula, as follows, was established based on the risk factor:
Verification of the predictive power of four prognostic genes
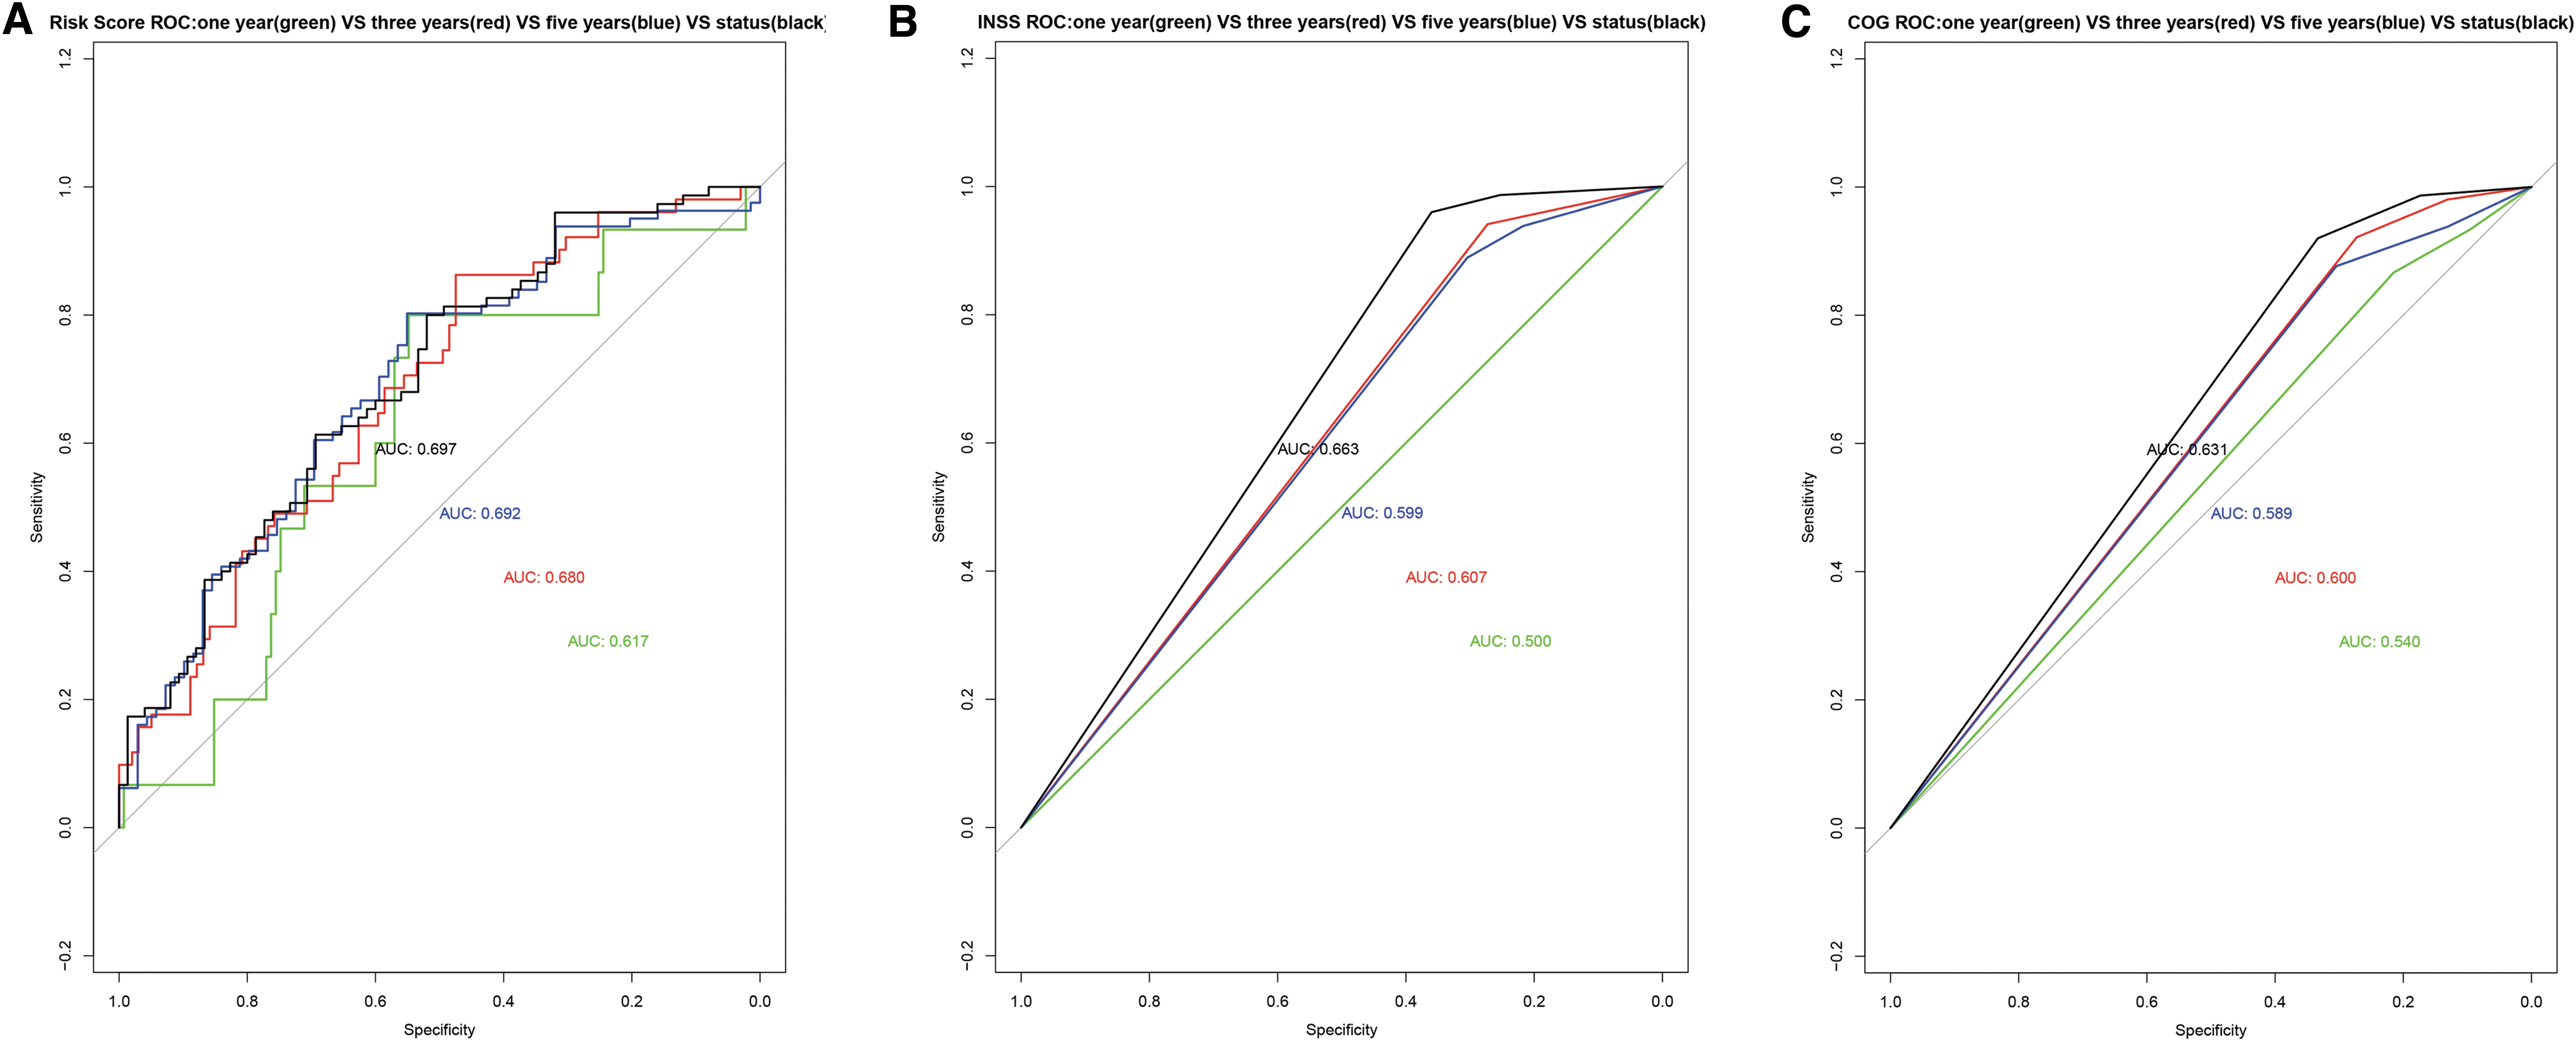
Time-dependent ROC was used to evaluate the predictive power of the gene signature, INSS stage, and the COG risk stratification in terms of patient prognosis. The AUCs of the risk score for the prediction of the 1-, 3-, and 5-year survival as well as the overall survival were 0.617, 0.618, 0.692, and 0.697, respectively. The AUCs of the INSS stage for the prediction of the 1-, 3-, and 5-year survival as well as the overall survival were 0.500, 0.607, 0.599, and 0.633, respectively. The AUCs of the COG risk stratification for the prediction of the 1-, 3-, and 5-year survival as well as the overall survival were 0.504, 0.600, 0.589, and 0.631, respectively (Fig. 5A–C). This means that for the predictions of the 1-, 3-, 5-year, and overall survival, the AUC value of the risk score is better (Supplementary Fig. S3A–D).
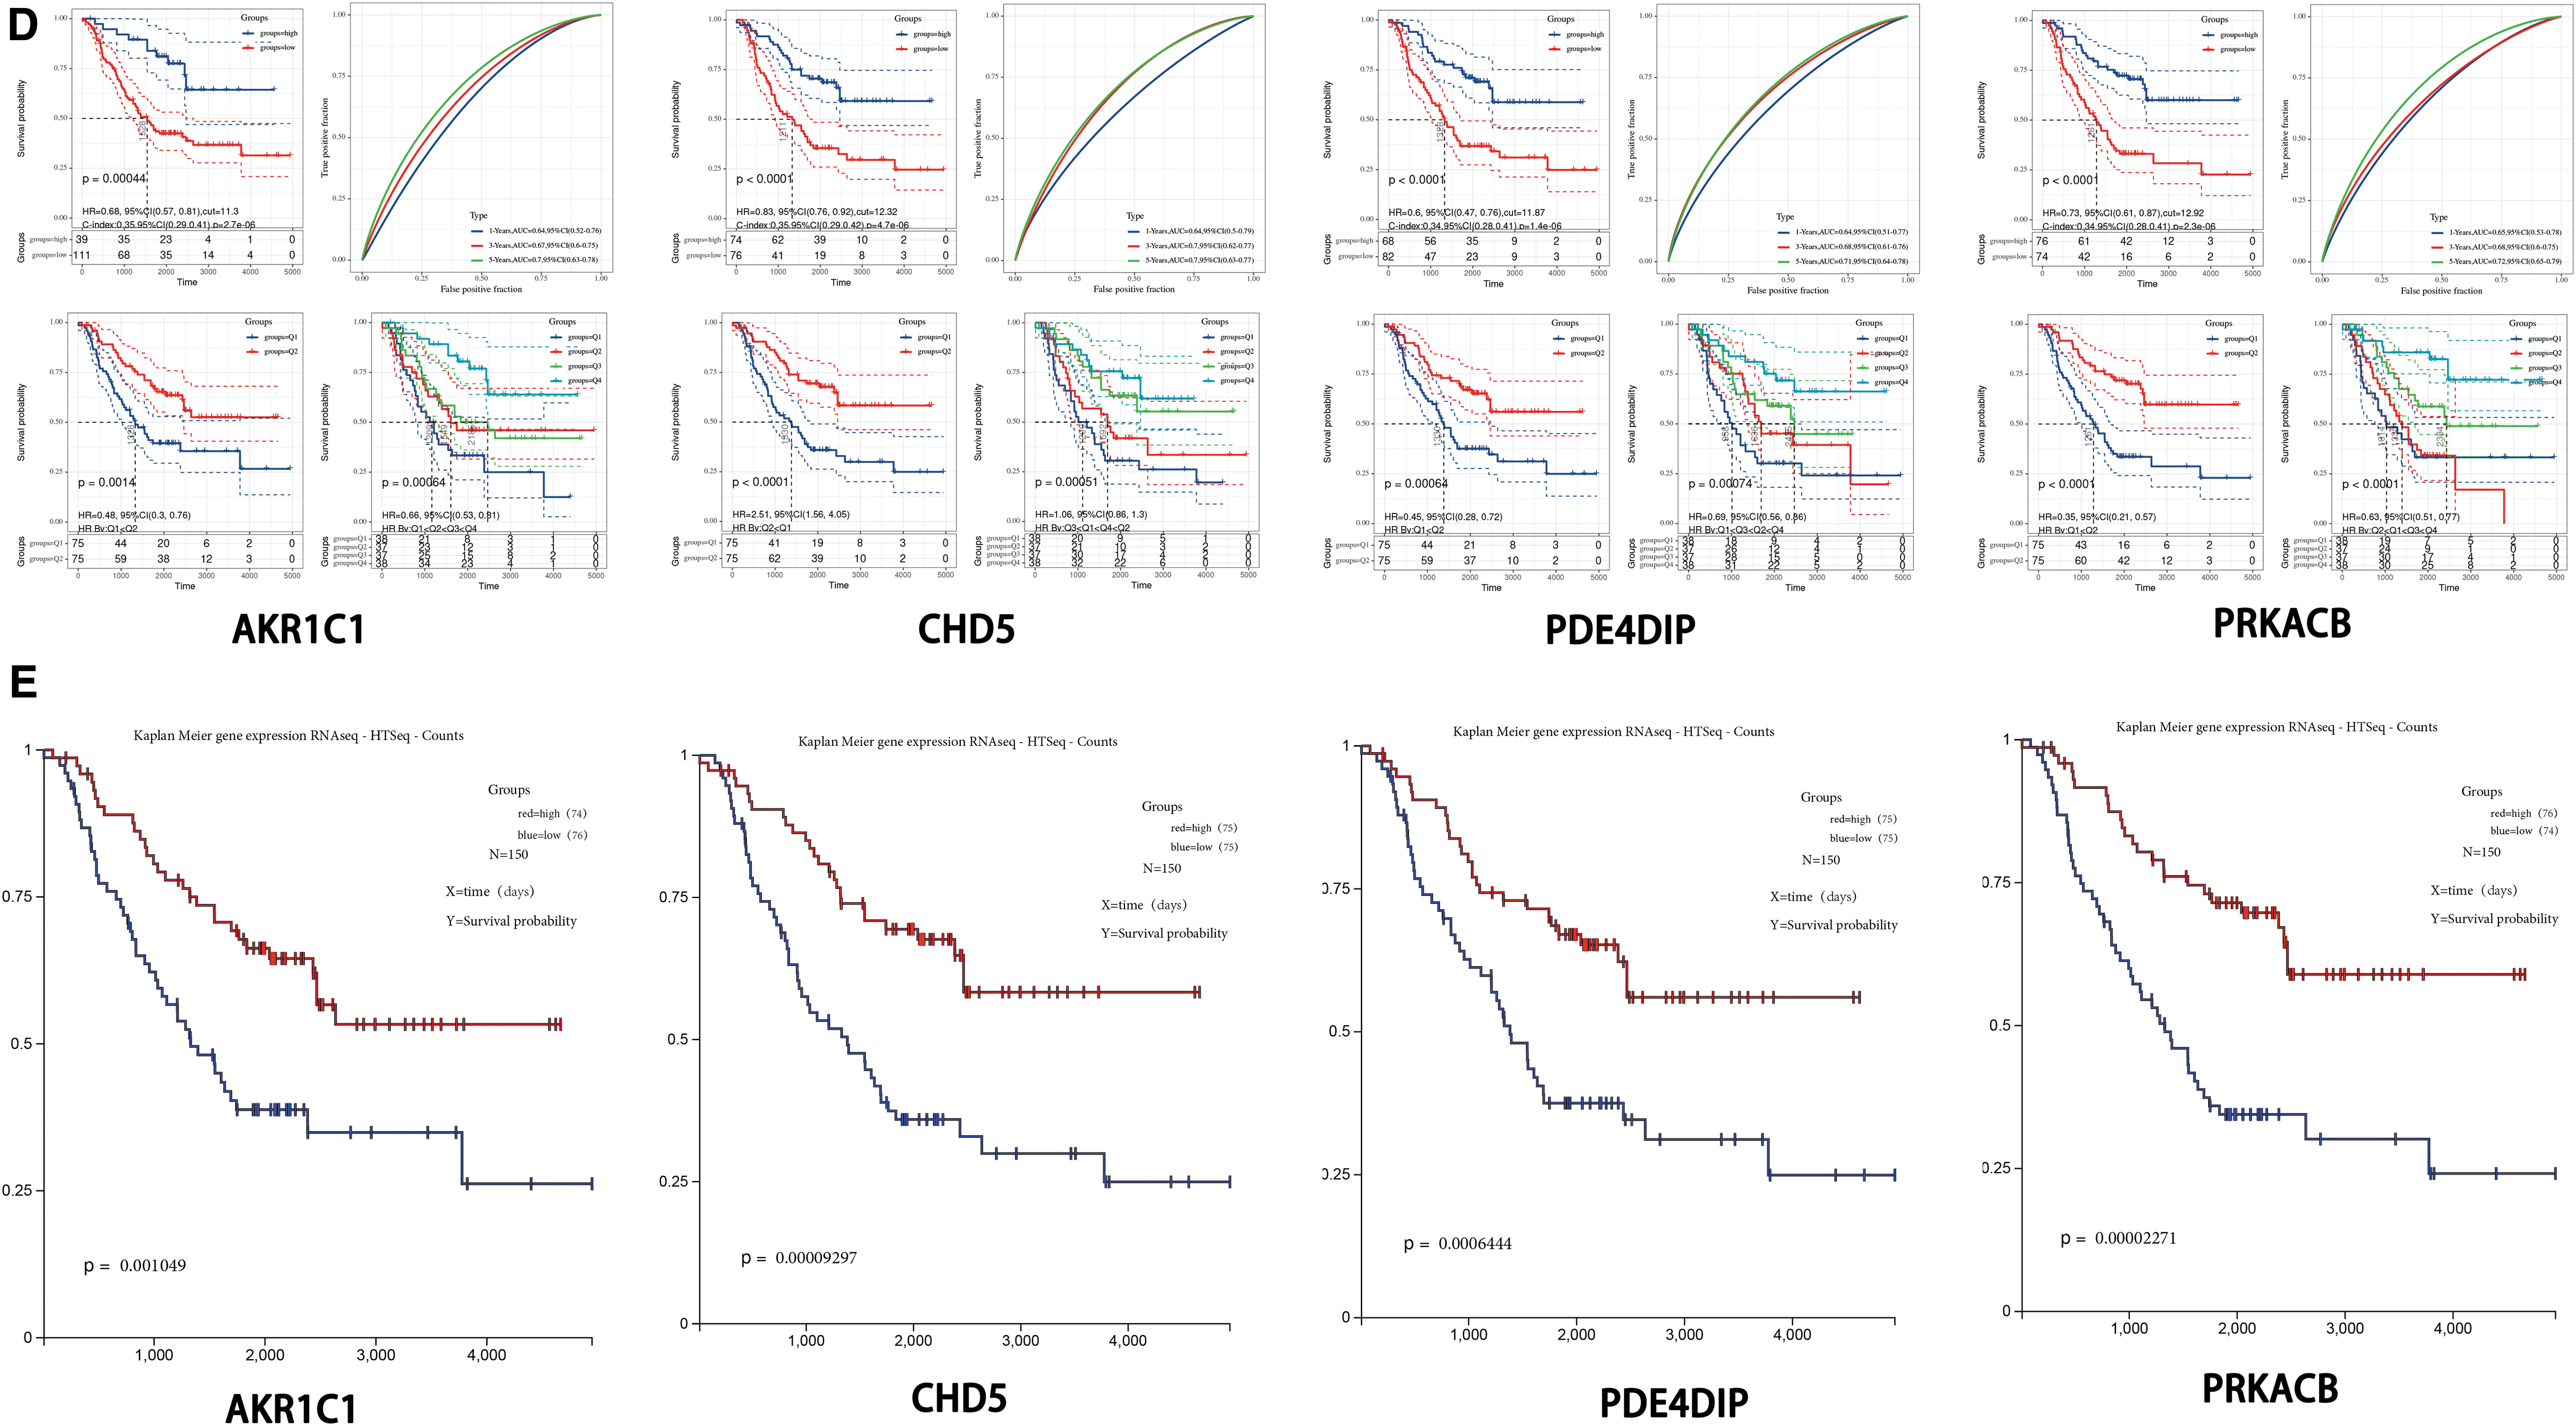
A single factor prognostic analysis was performed on AKR1C1, CHD5, PDE4DIP, and PRKACB. The patients were divided into a high-risk group and a low-risk group based on the optimal cutoff value, median, or quartile, and the Kaplan–Meier survival curves were used to evaluate the predictive ability of the nomogram for the overall survival rate. The results showed that the four genes have good independent predictive ability (Fig. 5D).
The results of the Kaplan–Meier survival curves queried on the UCSC webpage also showed that AKR1C1, CHD5, PDE4DIP, and PRKACB have good prognostic grouping capabilities (Fig. 5E).
Predictive nomogram construction
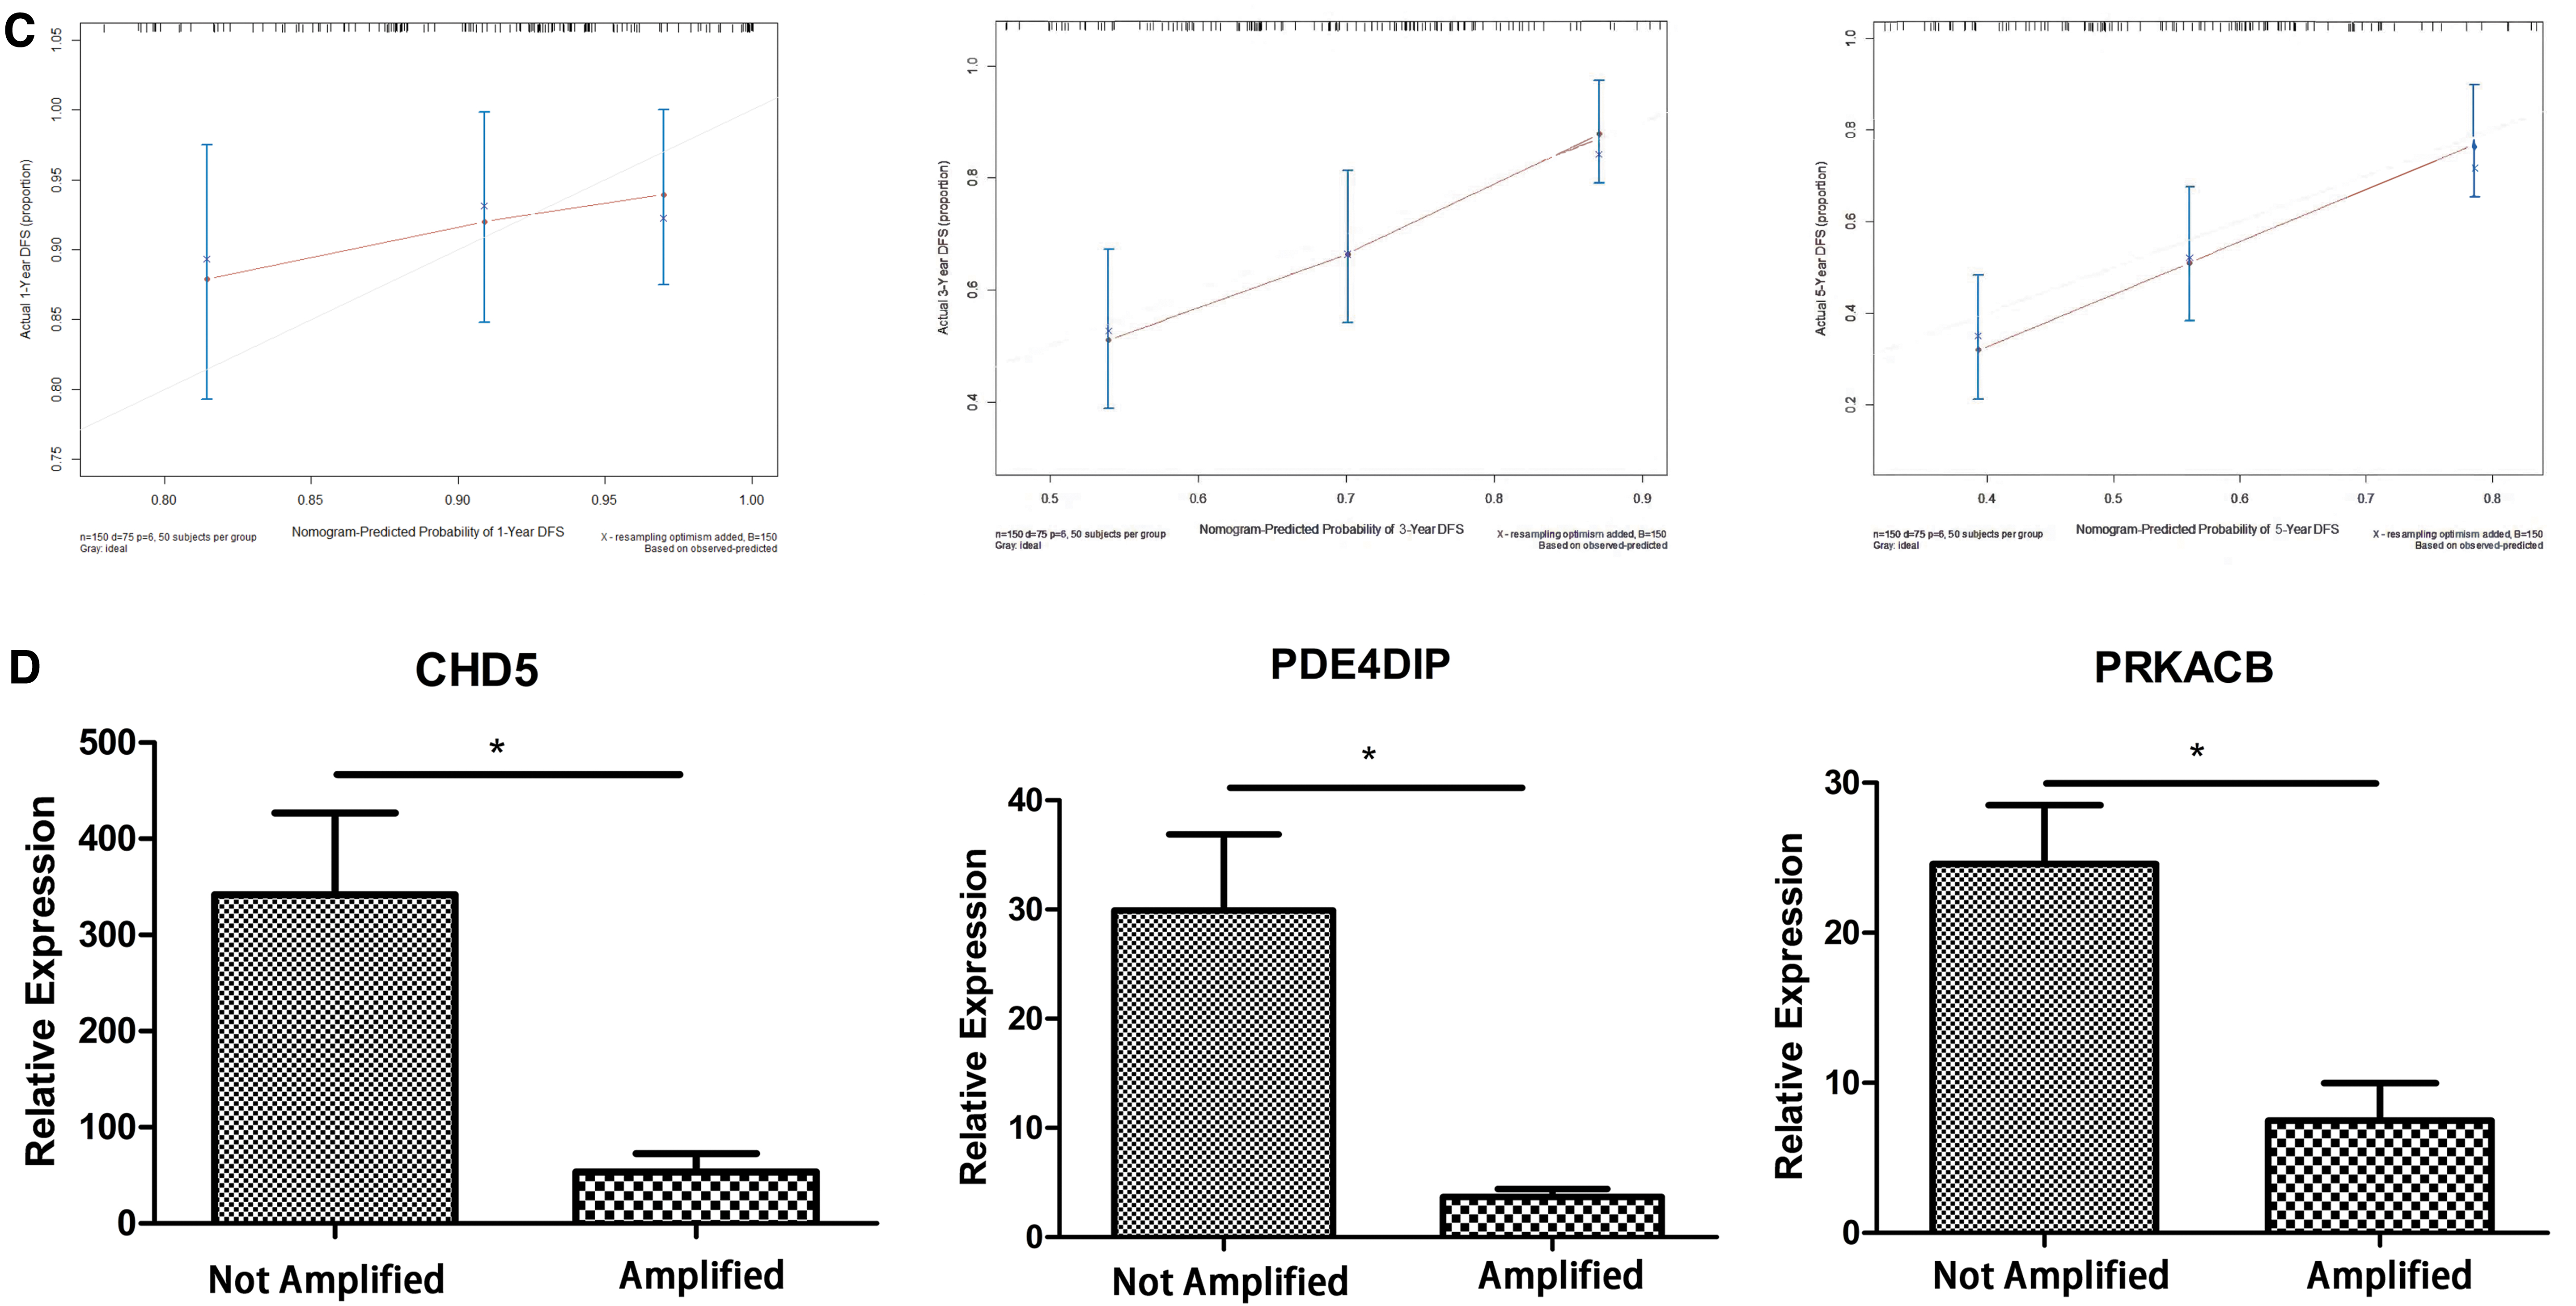
A Cox proportional hazard regression model that incorporated the risk score, gender, INSS stage, COG risk stratification, age at first diagnosis, and MYCN status as prognostic factors was established. The effective prognostic factors of the Cox proportional hazard model were determined by PH test. The results are shown in Figure 6 (factors with p < 0.05 were excluded). After removing the unqualified factors (MYCN status and age at first diagnosis), the model was re-established, and the effectiveness of the PH test was used to determine the prognostic factors again (Fig. 6A). Subsequently, a prognostic nomogram was established to predict the 1-, 3-, and 5-year overall survival and the median final survival time (Fig. 6B). The C-index of the prognostic model was 0.676 (95% confidence interval: 0.612–0.740). The calibration curve shows that the prediction of the 1-year survival rate by the prognostic model will overestimate the actual risk in the low-risk population and that the 3-year survival rate prediction effect is good. However, the prognostic model will also underestimate the risk when predicting the 5-year survival rate, especially in low-risk populations (Fig. 6C).

The relationship between the expression of AKR1C1, CHD5, PDE4DIP, and PRKACB and clinical characteristics
cBioPortal analysis results showed that the expression of AKR1C1, CHD5, PDE4DIP, and PRKACB was negatively correlated with poor prognostic factors (Supplementary Fig. S4A–C). The expression of signature genes in clinical tissues was further verified by qRT-PCR. As shown in Figure 6D, compared with MYCN-amplified tumor tissues, the relative expression levels of signature genes in MYCN-nonamplified tumor tissues were significantly higher (p < 0.05), which is consistent with the results of the bioinformatics analysis.
Discussion
NB is a pediatric solid tumor that is highly heterogeneous in its clinical and biological features. NB is the third most common malignant disease, as it accounts for ∼7% of all malignant tumors in children <14 years of age, and the incidence rate in 1-year-olds is close to 60/100,000 individuals (Maris et al., 2007; Sausen et al., 2013; Ward et al., 2014). Multiple studies have found that the NB and MYCN genes and MYCN-related genes are involved in the development of NB, including LIN28B, LMO1, CLU, FLCN, AMHR2, and AKR1C1–3 (Huang and Weiss, 2013; Liu and Thiele, 2017; Bellamy et al., 2020). Patients in the MYCN-amplified group can be stratified into a high-risk group according to COG risk of NB, and the long-term survival rate of patients in the high-risk group is <40–50% (Maris et al., 2007; Pinto et al., 2015; Salazar et al., 2016). Accurate prognostic predictions can identify patients who will benefit from more thorough treatments, including neoadjuvant therapy, more extensive surgery, chemotherapy, radiation therapy, targeted molecular therapy, and immunotherapy. Therefore, the treatment plan can be tailored to individual patients to improve their prognosis.
INSS stage and COG risk stratification are effective predictive tools that have been used to reflect and predict the progression and prognosis of NB. In addition, molecular prognostic markers can be used as a useful supplement to the INSS stage and COG risk stratification to further improve the prognostic accuracy. Molecular prognostic markers that can be quantified by standardized detection procedures change as a tumor progresses, and thus, they can dynamically reflect the prognosis of patients and serve as new therapeutic targets (Bosse and Maris, 2016). Detection of molecular markers can also be combined with the detection of tumor-related exosomes and circulating tumor cells to achieve real-time detection of disease recurrence and treatment response in patients after surgical resection. These molecular prognostic markers may also have potential value in the early diagnosis of NB, as disease progression involves a complex network of multiple signaling pathways. To overcome the barrier of heterogeneity, a set of molecular markers may be more accurate than a single molecular marker in predicting the prognosis of patients with NB. Nomograms are widely used in clinical oncology to assess prognosis (Balachandran et al., 2015), as they can integrate several prognostic determinants, including molecular and clinicopathological parameters. The numerical probability of clinical events can be calculated and visualized through relatively simple output. Compared with conventional staging, a nomogram can effectively improve the prognostic prediction, which is beneficial for clinical decision-making and personalized treatment.
In this study, using a comprehensive analysis of multiple data sets, we identified 133 reliable DEGs in NB. Functional enrichment analysis showed that the DEGs are closely related to the invasiveness and metastasis of NB and that cocaine addiction is the most abundant signal transduction pathway. The survival analysis showed that 37 DEGs were related to overall survival. Through Lasso-Cox regression, a new four-gene signature that predicts the overall survival rate of NB was established. AKR1C1, CHD5, PDE4DIP, and PRKACB were downregulated and identified as protective genes associated with good survival. A univariate analysis confirmed and verified that the four genes in the signature are effective and independent prognostic markers of NB. The relationship between the expression of the four genes and the clinical characteristics of the patients was confirmed by qRT-PCR analysis and web tools. According to the risk scoring formula of the genetic signature, patients can be divided into a high-risk group and a low-risk group. We found that the prognosis of patients in the low-risk group was significantly higher than that of patients in the high-risk group. A nomogram that integrates risk score and clinical characteristics was established, and the overall survival rate was accurately predicted. The AUC, C index, and calibration curve confirmed that these four genetic risk scores are better than the INSS stage and COG risk stratification for the prediction of the 1-, 3-, and 5-year overall survival. As a supplement to the INSS stage and COG risk stratification, the four-gene signature and the nomogram can be used as indicators of progression and predictors of overall survival.
Two of the four genes in the signature were previously reported to be associated with NB. AKR1C1 belongs to a 4-member (AKR1C1–4) family of 15 aldose ketone reductase enzymes. These four AKR1Cs have a high degree of sequence similarity and function as ketosteroid reductases and hydroxysteroid oxidases (Fluck et al., 2011). AKR1C1 is reactivated by inhibition of the histone methyltransferase G9a in an MYCN-amplified cell line and acts as a tumor suppressor gene (Bellamy et al., 2020). AKR1C1 expression is positively correlated with cisplatin resistance in head and neck squamous cell carcinoma (Chang et al., 2019). However, Zhu et al. (2018) also reported that AKR1C1 promotes the metastasis of non-small cell lung cancer through STAT3 pathway activation. Moreover, Zhao et al. (2019) revealed that AKR1C1–3 is associated with a lower overall survival rate in patients with liver cancer, which may be caused by tumor heterogeneity.
CHD5 belongs to the CHD gene family. This gene is the most homologous to CHD3 and CHD4, and its encoded protein is part of the nucleosome remodeling and histone deacetylation complex. CHD5 is a neuron-specific protein that is located in a small deleted area of 1p36.3 in NB. CHD5 is not expressed in glial cells and is differentially expressed among neuron types (Garcia et al., 2010). Methylation of the CHD5 promoter is common in high-risk tumors and is usually related to 1p deletion and MYCN amplification. Low CHD5 expression is highly correlated with 1p deletion, MYCN amplification, late stage, and poor histology (Thompson et al., 2003). Koyama et al. (2012) also reported that the high expression of CHD5 is a powerful predictor of good prognosis, regardless of whether MYCN is amplified or whether 1p36 and/or 11q is deleted. These findings indicate that this gene may play an important role in nervous system development and is a powerful predictor of NB.
The roles of PDE4DIP and PRKACB in NB have not been reported. The gene product phosphodiesterase 4D (PDE4D) is anchored at the centrosome-Golgi cell region by phosphodiesterase 4D interacting protein (PDE4DIP). PDE4D is a member of a family of phosphohydrolyases. These enzymes are involved in signal transduction and hydrolyze 3′ cyclic phosphate bonds in 3′,5′-cyclic guanosine monophosphate (cGMP) and 3′,5′-cyclic adenosine monophosphate (cAMP) to catalyze several reactions in the cell (Shapshak, 2012). A significant correlation was found between PDE4DIP and the survival time of patients with glioblastoma. In addition, patients with lung adenocarcinoma with high expression of PDE4DIP and THBS1 have a higher survival rate than patients with low expression (Weng et al., 2016; Du et al., 2019). In addition, many articles have reported mutations in PDE4DIP in various tumors and other diseases, such as pancreatic cancer, leukemia, neuroendocrine Merkel cell carcinoma, malignant peritoneal mesothelioma, parathyroid carcinoma, familial gastroschisis, and pedigree segregating asthma (DeWan et al., 2012; Graves et al., 2015; Lai et al., 2016; Ma et al., 2020; Yao et al., 2020a; Hu et al., 2020; Salinas-Torres et al., 2020). Based on the earlier findings, we speculate that PDE4DIP may influence the biological effects of PDE4D through its own mutations, and thus, affects NB.
The PRKACB gene is located on chromosome 1p31.1 and encodes the β catalytic subunit of 3,5-cAMP-dependent protein kinase A (PKA). PRKACB protein is a member of the Ser/Thr protein kinase family and is a key effector of cAMP/PKA-induced signaling pathways and is involved in many cellular processes, including cell proliferation, apoptosis, gene transcription, metabolism, and differentiation (Skalhegg and Tasken, 2000). Mutations in PRKACB and PRKACB gene fusion can lead to adrenal gland, bile duct, liver, and pancreatic cancers (Loilome et al., 2011; Espiard et al., 2018). PRKACB mRNA and protein are downregulated in human NSCLC tissues and play a key role in the occurrence and invasion of NSCLC (Chen et al., 2013). The downregulation of PRKACB expression in colorectal cancer is associated with decreased overall survival of colorectal cancer patients (Yao et al., 2020b). Wang et al. (2020b) reported that miR-384 serves as a tumor suppressor in the progression of papillary thyroid cancer by directly targeting the 3′-UTR of the PRKACB gene. In addition, Wu et al. (2018) indicated that circRNA-DLEU2 promotes human acute myeloid leukemia by inhibiting miR-496 and promoting PRKACB expression. The aforementioned studies indicate that PRKACB may inhibit NB through cAMP/PKA-induced signaling or through miRNA/circRNA regulation.
In the validation of our clinical samples, the qRT-PCR results of CHD5, PDE4DIP, and PRKACB expression revealed a significant correlation between the expression levels of CHD5, PDE4DIP, and PRKACB and the patient's MYCN gene amplification status. The expression levels of CHD5, PDE4DIP, and PRKACB in patients with an amplified MYCN gene are lower. On the one hand, this verifies that the expression of CHD5, PDE4DIP, and PRKACB is indeed consistent with the differential expression shown by the original chip data. On the other hand, this also shows that low expression of CHD5, PDE4DIP, and PRKACB is related to a poor prognosis in patients with NB. In the most recent NB clinical staging system, patients with amplified MYCN are included in the high-risk group, which has a long-term survival rate of <30–50%. Unfortunately, we could not verify the expression level of AKR1CA in our clinical samples because after two primer redesigns, the melting curve was still unstable. To maintain scientific objectivity, we abandoned the verification of the AKR1CA expression level, although our research is incomplete without these data.
Our prediction model is based on the expression levels of genes in the selected panels, and thus, our method is more economical and clinically practical than whole-genome sequencing. In addition, our nomogram combines the characteristics of four genes and clinicopathological parameters and allows clinicians to determine the prognosis of each patient. The graphical scoring system is easy to understand and helps to personalize treatment and medical decisions. To our knowledge, the four-gene signature described in this article and the nomogram based on these markers have not been previously reported. In this study, INSS stage and COG risk stratification were used as controls. Zhong et al. (2018) determined a four-gene signature (ERCC6L, AHCY, STK33, and NCAN) and developed a prognostic nomogram. Wang et al. (2020a) identified N-myc-related genes associated with prognosis from two GEO data sets but did not develop a prognostic nomogram. First, no overlap was observed between the prognostic signatures of the four genes we found and the prognostic signatures previously defined by Zhong et al. Second, the DEGs obtained in this study were derived from a comprehensive analysis of four data sets. Finally, our prognostic gene signature has been verified in clinical samples and, therefore, it has higher reliability. Our research provides new insights into the molecular mechanism and prognostic prediction of NB. Before this study, two genes of the four genes in the signature had not been previously reported to be associated with NB. These DEGs may be potential molecular targets in the treatment of NB.
However, this study has certain limitations. The main source of our clinical information is the data set from the UCSC database, and because the included sample size is small, internal and external verification could not be performed when the nomogram was constructed. Therefore, in the future, it is necessary to use external data sets with complete clinical information and gene expression data for verification. Regrettably, due to technical reasons, we were unable to verify AKR1C1 expression in clinical tissue samples, but we verified AKR1C1 expression using other public databases.
Conclusion
Our study identified a four-gene signature and a prognostic nomogram that combines genetic and clinical characteristics to predict the overall survival rate of patients with NB. The four genetic markers are closely related to the metastasis, aggressiveness, and prognosis of NB, and their protein products are potential therapeutic targets. The prognostic nomogram reliably predicts the overall survival rate of patients with NB and may help with personalized treatment and medical decisions, but caution must be exercised if the nomogram is extended to large-scale applications.
Footnotes
Acknowledgments
The authors thank the staff members of GEO, and UCSC xena databases.
Disclosure Statement
No competing financial interests exist.
Funding Information
This study was supported by the Key Project of “Research on Prevention and Control of Major Chronic Non-Communicable Diseases,” Ministry of Science and Technology of the People's Republic of China (2018YFC1313004), Chongqing Science and Technology Commission (cstc2019jscx-msxmX0220); General Clinical Medical Research Program of Children's Hospital of Chongqing Medical University (YBXM-2019-003).
Supplementary Material
Supplementary Table S1
Supplementary Table S2
Supplementary Table S3
Supplementary Table S4
Supplementary Figure S1
Supplementary Figure S2
Supplementary Figure S3
Supplementary Figure S4
References
Supplementary Material
Please find the following supplemental material available below.
For Open Access articles published under a Creative Commons License, all supplemental material carries the same license as the article it is associated with.
For non-Open Access articles published, all supplemental material carries a non-exclusive license, and permission requests for re-use of supplemental material or any part of supplemental material shall be sent directly to the copyright owner as specified in the copyright notice associated with the article.
