




Abstract
Radiotherapy is the most important adjuvant treatment for glioma; however, radioresistance is the major cause for inevitable recurrence and poor survival of glioma patients. Thus, this study aims to investigate the effect of astrocyte elevated gene-1 (AEG-1) on the radiosensitivity of glioma cells. Immunohistochemistry assay found that AEG-1 was generally overexpressed in glioma tissues and was correlated with poor clinicopathological features of glioma patients. AEG-1 knockdown inhibited proliferation of glioma cells. And γ-H2AX foci assay, colony formation assay, and flow cytometry analysis demonstrated that AEG-1 depletion enhanced radiosensitivity and promoted apoptosis as well as cell cycle arrest in G2 phase of glioma cells treated by ionizing radiation. Moreover, replication factor C5 (RFC5) was screened as the target of AEG-1 by using Affymetrix human gene expression array, and RFC5 expression was downregulated in AEG-1 knockdown glioma cells. Mechanistically, AEG-1 knockdown impaired homologous recombination repair activity induced by radiation through inhibiting RFC5 expression. Furthermore, the Kaplan–Meier analysis and multivariate Cox regression analysis indicated that high levels of AEG-1 and RFC5 were related to poor prognosis of glioma patients treated with radiotherapy. Taken together, our findings indicate that AEG-1 may serve as a reliable radiosensitizing target for glioma radiotherapy.
Introduction
Glioma, the most common malignant tumor in the central nervous system (Davis, 2018), is mainly classified into grades I to IV by the World Health Organization (WHO) based on molecular genetics and epigenetic characteristics (Gandia-Gonzalez et al., 2019). To date, the standard therapies for glioma are surgery combined with chemoradiotherapy, and radiotherapy plays an indispensable role in comprehensive treatments (Aghi et al., 2015; Cabrera et al., 2016; McDuff et al., 2020). Unfortunately, the prognosis of glioma patients is still frustrating. Evidence reported that the most optimistic prediction of the 5-year survival rate of glioma patients who received combined therapy was only ∼1%–2% (Ryu et al., 2014). As radioresistance of glioma cells hinders the efficacy of radiotherapy (Cho et al., 2020), it is urgent to explore key molecular targets and mechanisms that act on the radiosensitivity of glioma cells.
Astrocyte elevated gene-1 (AEG-1), also known as MTDH, was first discovered in primary cultured human fetal astrocytes infected with human immunodeficiency virus-1 (HIV-1) or treated with tumor necrosis factor-α (TNF-α) (Lee et al., 2013). Previous studies showed that AEG-1 was abundantly expressed in multiple types of cancers, including breast cancer, liver cancer, nonsmall cell lung cancer (NSCLC), and esophageal squamous cell carcinoma (Shi and Wang, 2015). And AEG-1 was involved in tumorigenesis, angiogenesis, metastasis, and chemoresistance by regulating oncogenic signaling pathways such as PI3K/AKT, NF-κB, MAPK, and Wnt/β-catenin pathways (Yu et al., 2014; Li et al., 2015; McCubrey et al., 2016; Dhiman et al., 2019; El-Ashmawy et al., 2019; Zhu et al., 2020). In addition, several reports indicated that AEG-1 also mediated radiosensitivity of tumor cells (Zhao et al., 2012; Gnosa et al., 2014; Li et al., 2020). In a recent research, for instance, it was found that silencing AEG-1 inhibited proliferation, migration, and invasion, and promoted apoptosis and radiosensitivity of human ovarian cancer SKOV3 cells (Chen et al., 2018). However, the role of AEG-1 in sensitizing glioma cells to radiation remains unknown.
Replication factor C (RFC) is a protein complex composed of five subunits (RFC1–5) widely found in eukaryotes, which plays a vital role in DNA replication and DNA damage repair (Sakato et al., 2012). The RFC5 gene is located at human chromosome 12q24.2-q24.3 and encodes a 36 kDa subunit (Li et al., 2018). Recently, increasing evidence revealed that the aberrant expression of RFC5 was closely correlated with proliferation, invasion, and drug resistance in multiple malignancies. For instance, Wang et al. (2018) found that RFC5 expression was upregulated in lung cancer tissues than in paracancerous tissues, and its increased expression was associated with higher T staging, regional lymph node metastasis, and higher recurrence rate of lung cancer. Peng et al. (2017) demonstrated that RFC5 promoted resistance to temozolomide in glioma cells by targeting forkhead box M1 (FoxM1). Nevertheless, the specific mechanism of RFC5 on the radioresistance of glioma is still poorly defined.
Therefore, in this study, we aim to investigate the underlying effect of AEG-1 on radiosensitivity of glioma cells, and to explore the interaction mechanism between AEG-1 and RFC5 in this process. In general, our research suggested that AEG-1 functioned as a crucial factor for mediating radiosensitivity of glioma cells, and provided a therapeutic target for glioma treatment.
Materials and Methods
Study tissues
Paraffin-embedded glioma tissues (n = 52) were collected from the pathologically confirmed glioma patients who received surgery and chemoradiotherapy at the First Affiliated Hospital of Xi'an Jiaotong University from 2014 to 2018. During the same period, 10 cases of paraffin-embedded benign intracranial brain tumor tissues were collected as the control group. This research was approved by the Ethics Committee of the First Affiliated Hospital of Xi'an Jiaotong University (Approval No. XJTU1AF2018LSK-108). The detailed clinical data of glioma patients are supplied in Supplementary Tables S1 and S2.
Cell culture and transfection
Human glioma U373 cell line was purchased from Shanghai Gaining Biological Technology Co., Ltd. (Shanghai, China). Human glioma U251, U87, and LN229 cell lines were acquired from FENGHUISHENGWU Biological Technology Co., Ltd. (Changsha, China). And human microglia HMC3 cell line was obtained from Procell Life Science&Technology Co., Ltd. (Wuhan, China). Cells were cultured in DMEM (HyClone) containing 10% FBS (Gibco, Rockville, MD) and 1% penicillin–streptomycin (HyClone) in a 5% CO2 incubator at 37°C. To obtain AEG-1 stable knockdown glioma cells, specific AEG-1 short hairpin RNA (sh1-AEG-1 and sh2-AEG-1) and negative control shRNA (sh-NC), both of which were synthesized by Shanghai JiKai Gene Chemical Technology Co., Ltd, were transfected into glioma cells by using Lipofectamine 2000 reagent (Invitrogen). Puromycin (5 μg/mL) was used to screen the stable transfected glioma cells. Human RFC5 cDNA was cloned into the CMV-MCS-3FLAG-SV40-Neomycin plasmid with a lentiviral packaging kit (GENECHEM, Shanghai, China), then glioma cells with RFC5 overexpression were obtained by lentiviral transduction. Western blot was conducted to verify the transfection efficiency.
Western blot
The total proteins were extracted by using radioimmunoprecipitation (RIPA) lysis buffer (Pioneer, China) supplemented with phosphatase inhibitors and protease inhibitors, and the protein concentration was quantitatively detected by using BCA Protein Assay Kit (Roche, Switzerland). The proteins were separated by sodium dodecyl sulfate-polyacrylamide gel electrophoresis (SDS-PAGE), and then diverted onto polyvinylidene fluoride (PVDF) membranes (Millipore). Then, the membranes were incubated overnight at 4°C with primary antibodies, including AEG-1 (1:1000, 13860-1-AP; Proteintech), RFC5 (1:1000, NBP1-87137; Novus), RAD9A (1:2000, 13035-1-AP; Proteintech), RAD51 (1:1500, 14961-1-AP; Proteintech), as well as GAPDH (1:5000, 10494-1-AP; Proteintech) and β-Tubulin (1:1000, 10094-1-AP; Proteintech). Subsequently, the membranes were incubated with the secondary antibody, and then were visualized by using the electrochemiluminescence reagent kit (Millipore).
Cell counting kit-8 assay
To assess the proliferation of glioma cell lines, cell counting kit-8 (CCK-8) (AbMole) was used according to the manufacturer's protocol. Glioma cells were plated into 96-well plates for 24 h incubation, and each well was then added with 10 μL CCK-8 reaction solution every 24 h followed by incubation for 2 h. Then, the optical density (OD) values at 450 nm were recorded.
Immunofluorescence assay
Glioma cells were seeded on glass sides into six-well plates and exposed to 10 Gy X-ray. After 12 h of culture, cells on the slides were fixed with 4% paraformaldehyde before treating with Triton X-100 (5%) to permeate cells, and BSA solution to block nonspecific binding. Then, cells were incubated at 4°C overnight with primary antibodies, including AEG-1 (1:50, 13860-1-AP; Proteintech) and γ-H2AX (1:400, 20E3; CST). Cells were then incubated with PE-conjugated secondary antibody for 1 h at 37°C. DAPI was added to the slides for nuclear staining, and glycerin was used to block the slides. Finally, images of the slides were obtained under a confocal microscope.
Colony formation assay
Glioma cells were seeded into the six-well plates at the gradient concentration of 500 cells per well, 1000 cells per well, 2000 cells per well, 5000 cells per well, and 8000 cells per well, which were exposed to X-ray at a dose of 0, 2, 4, 6, and 8 Gy, respectively. After 2 weeks of incubation, cells were fixed with methanol and then stained with Giemsa. The colonies containing ≥50 cells were counted, and the survival fraction (SF) was then calculated. Finally, GraphPad Prism 7.0 software was used to fit the survival curve according to the Single-hit multi-target model [SF = 1 − (1 − e−kD) N ].
Cell apoptosis assay
Annexin V-PE/7AAD double Kit (BD Bioscience) was used to detect the apoptosis rate of glioma cells. Glioma cells were plated onto the six-well plates, then irradiated with doses of 10 Gy X-ray. After washing with ice-cold PBS, cells were suspended in 100 μL 1 × binding buffer, and supplemented with 5 μL annexin V-PE and 5 μL 7AAD after incubation at room temperature in the dark for 15 min. Finally, 400 μL 1 × binding buffer was added, and the cell apoptosis rate was analyzed by flow cytometry (ThermoFisher Scientific).
Cell cycle analysis
To detect cell cycle alterations, glioma cells were cultured in the six-well plates, and then treated with ionizing radiation (IR) at 10 Gy. Then, cells were digested by trypsin and fixed with 70% precooled ethanol at 4°C overnight. Subsequently, cells were centrifuged and resuspended, and then added with 10 μL RNase and 10 μL propidium iodide for incubation in the dark at room temperature for 30 min. The flow cytometry (ThermoFisher Scientific) was performed to analyze cell cycle distribution.
Microarray experiment
TRIzol reagent (Invitrogen) was used to extract total RNA from AEG-1 knockdown and negative control glioma cells. Then, cDNA was synthesized by using High-Capacity cDNA reverse transcription kit (Thermo Fisher, China). Subsequently, the labeled and fragmented cDNA was hybridized with GeneChip PrimeView Human Gene Expression Array (Affymetrix). Then, the microarray chip was eluted and stained with GeneChip Fluidics Station 450 according to the manufacturer's protocol. Finally, the chip was scanned by using GeneChip Scanner 3000 (Affymetrix), and data analysis was performed with GeneChip operating software.
Immunohistochemistry staining
Paraffin-embedded tissue sections were routinely dewaxed and hydrated, and boiled with citrate acid buffer (Hutt Biotechnology, Xi'an, China), then incubated with 3% H2O2. Then, primary antibodies were added to the slides, including AEG-1 (1:400, 13860-1-AP; Proteintech) and RFC5 (1:200, NBP1-87137; Novus). Subsequently, the HRP-labeled secondary rabbit antibody (Zhongshan Golden Bridge, Beijing, China) was added, followed by the addition of HRP-labeled streptavidin reagent. In addition, sections were stained with diaminobenzidine, and then photographed and analyzed under microscopy (Leica, Heidelberg, Germany). The final immunoreactive score was defined by staining index (SI), which was calculated as the product of the percentage of positive cells and the staining intensity.
Statistical analysis
All data were processed and visualized by using the SPSS 18.0 software and the Graphpad Prism 7.0 software, and all results presented were expressed as mean ± standard deviation. Specifically, a paired t-test was conducted to evaluate the difference between two paired groups. One-way ANOVA was applied to contrast the differences among multiple groups. In addition, the χ 2 test was used to analyze the correlation between AEG-1 expression and clinicopathological factors. Survival analysis was performed using Kaplan–Meier and multivariate Cox regression. Each assay in this work was independently repeated at least three times. A p-value of <0.05 was considered to suggest statistically significant difference.
Results
AEG-1 expression was increased in glioma tissues
To investigate the potential functions of AEG-1 in glioma, we first examined AEG-1 expression based on Gene Expression Profiling Interactive Analysis (GEPIA), and noticed that AEG-1 was highly expressed in glioma tissues than in normal tissues (Fig. 1A). Then, immunohistochemistry staining results showed that AEG-1 expression was significantly higher in glioma tissues than in benign brain tumor tissues (Fig. 1B, C and Table 1). Furthermore, high expression of AEG-1 was correlated with high WHO pathological grade and grade grouping of glioma patients, while no obvious association with pathological type, gender, age, and epileptic seizure was observed (Table 2). These results suggested that AEG-1 was a potentially powerful biomarker for malignancy of glioma.

AEG-1 expression was increased in glioma tissues.
The Expression of Aeg-1 In Glioma Tissues And Benign Brain Tumor Tissues
AEG-1, astrocyte elevated gene-1.
The Correlation Between Aeg-1 Expression And Clinicopathological Features of Glioma
Bold p-values are statistically significant (p < 0.05).
WHO, World Health Organization.
AEG-1 knockdown inhibited proliferation of glioma cells
Further, Western blot analysis indicated that AEG-1 expression was significantly higher in glioma cell lines, especially in U251 and U373 cell lines, than in human microglia HMC3 cell lines (Fig. 2A). Besides, the confocal imaging showed that AEG-1 was mostly located in the cytoplasm of glioma cell lines (Fig. 2B). To further explore the effect of AEG-1 on the tumorigenicity of glioma, we next downregulated AEG-1 in U373 and U251 cell lines by using the specific shRNA. Western blot results identified that the expression of AEG-1 was remarkably inhibited in glioma cells, which was termed sh1-AEG-1 (Fig. 2C). Then, CCK-8 assay was performed to detect cell viability of glioma cells. The results showed that proliferation of sh1-AEG-1 group was significantly inhibited compared with that of blank group and sh-NC group (Fig. 2D). These results indicated that AEG-1 knockdown significantly restrained proliferation of glioma cells.
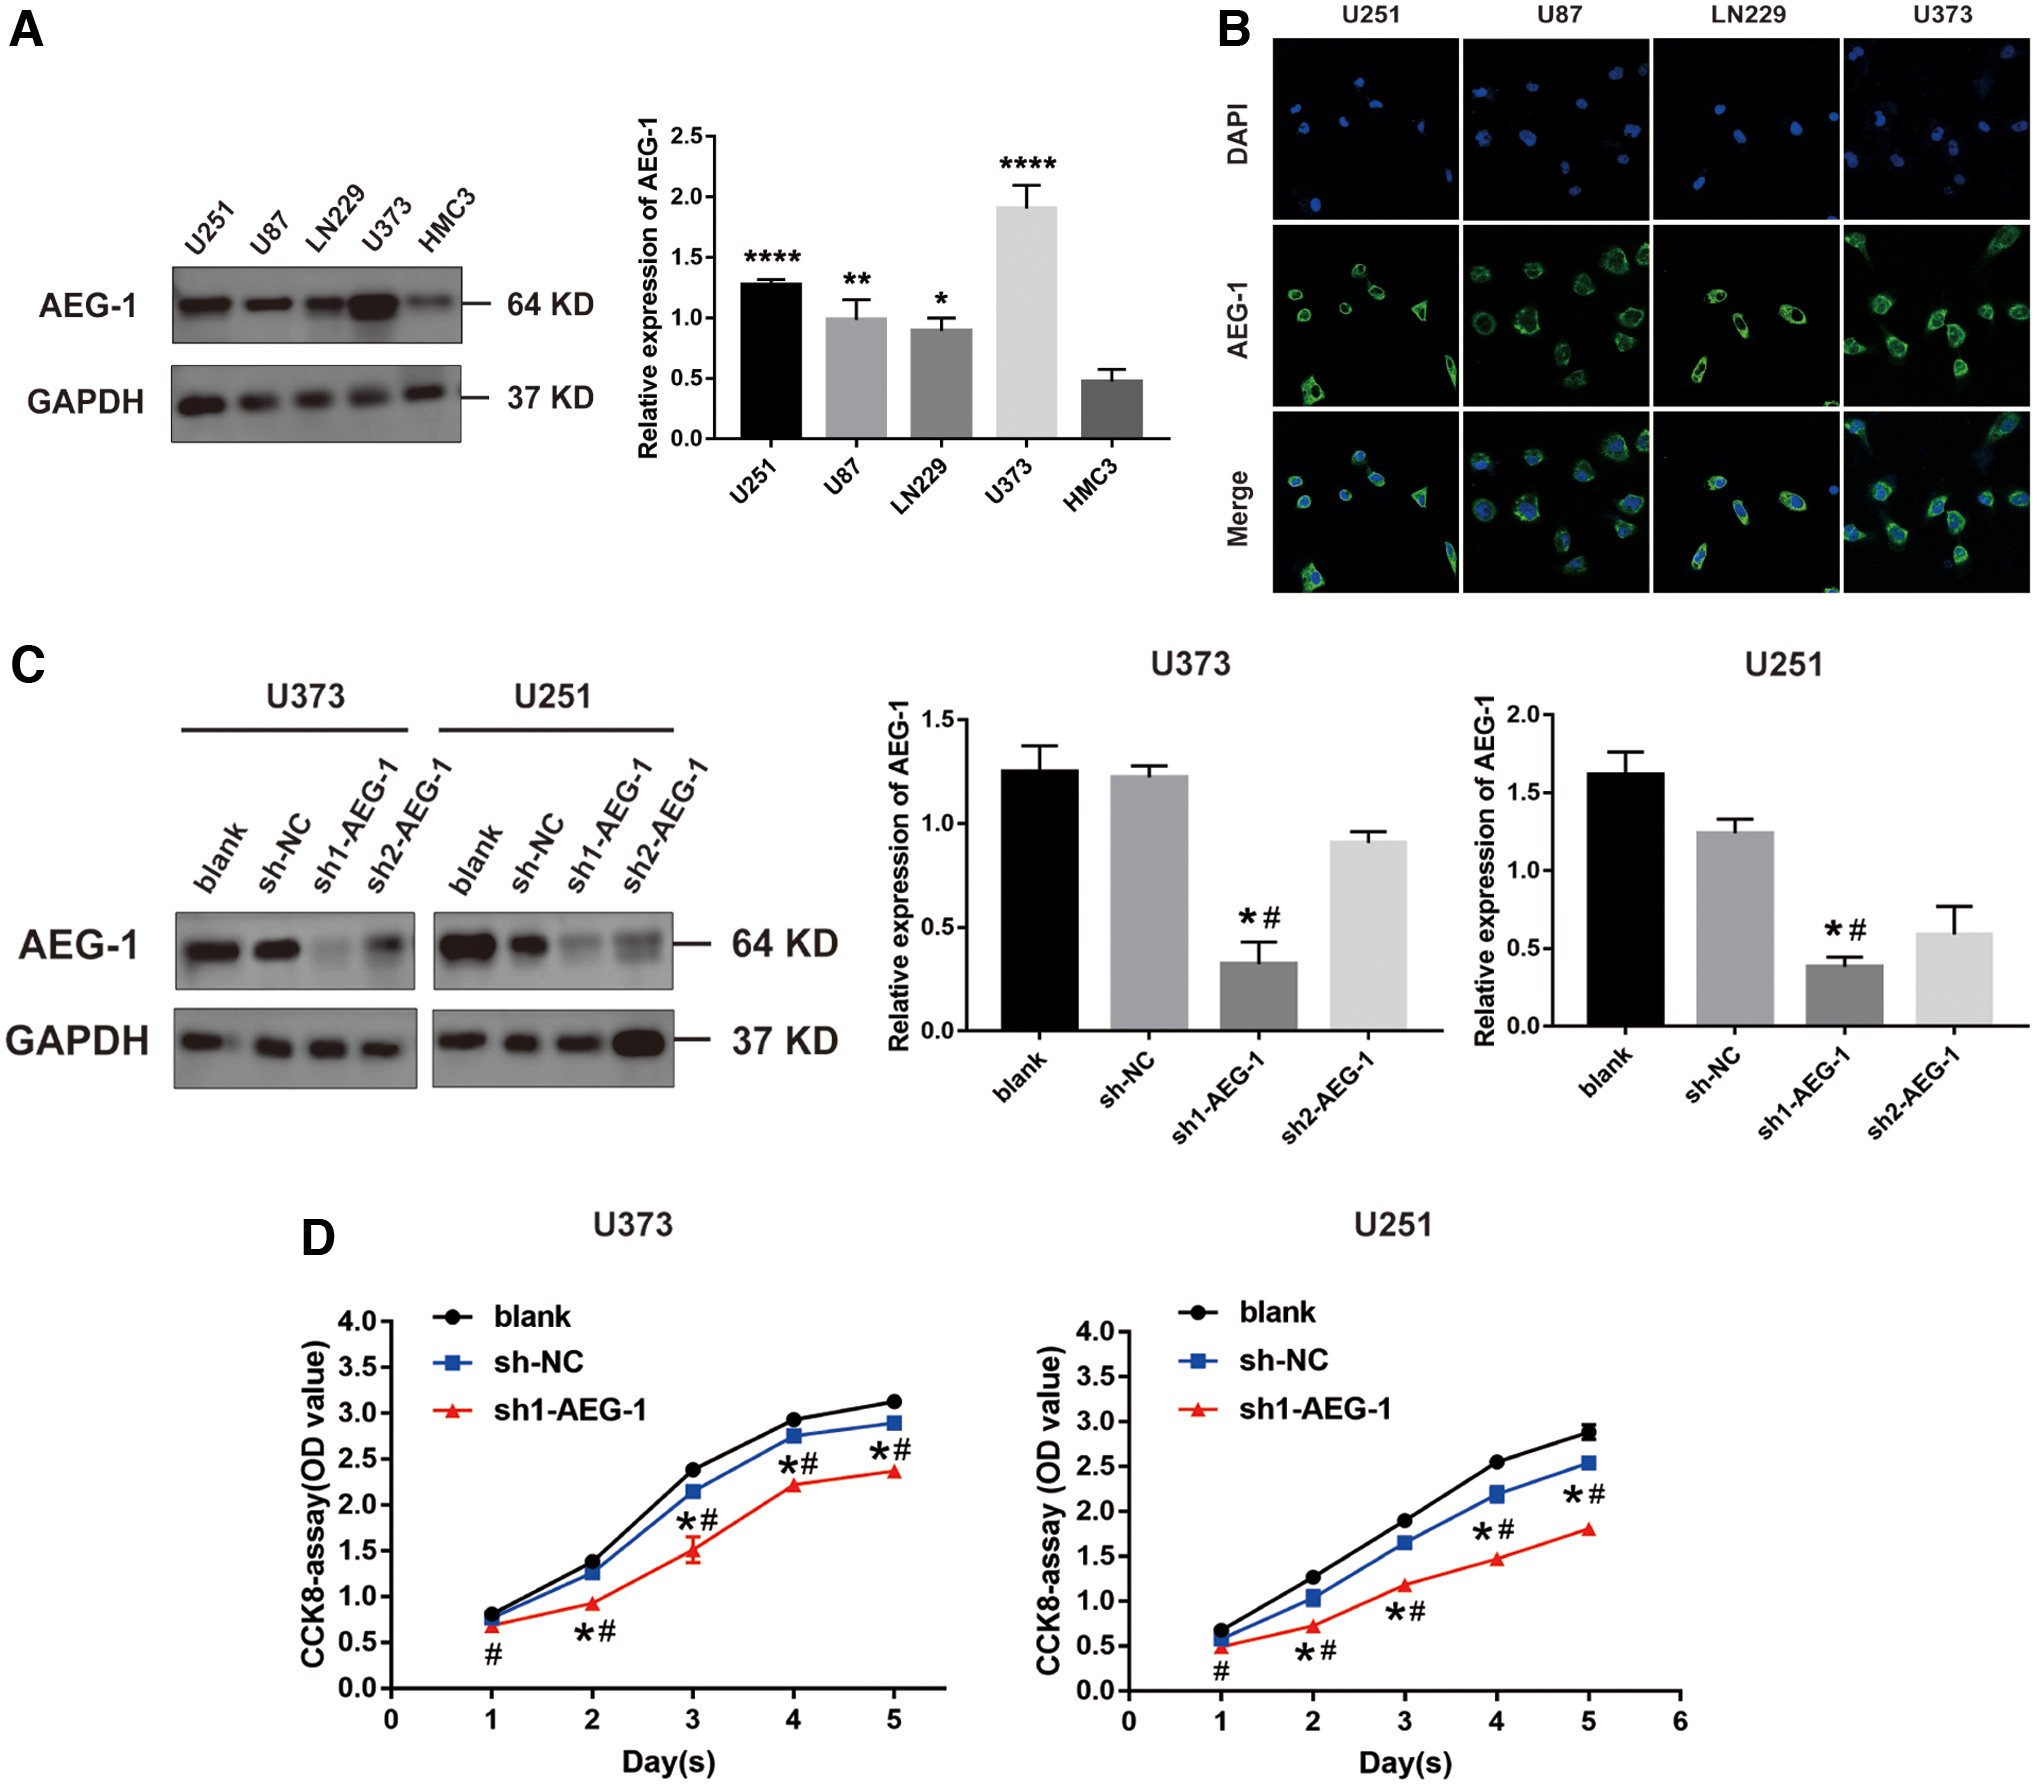
AEG-1 knockdown inhibited proliferation of glioma cells.
Knockdown of AEG-1 enhanced radiosensitivity of glioma cells
To estimate the effect of AEG-1 on radiosensitivity of glioma cells, we investigated the influence of AEG-1 knockdown on γ-H2AX foci formation in glioma cells treated with IR by immunofluorescence analysis. The results showed significantly more γ-H2AX foci in sh1-AEG-1 group than in blank group and sh-NC group at 12 h post-treatment with 10 Gy X-rays (Fig. 3A). Then, we performed colony formation assay. After exposure to radiation, cell survival fraction of sh1-AEG-1 group was dramatically lower than that of sh-NC group, and AEG-1 knockdown restrained the colony formation ability of glioma cells (Fig. 3B and Supplementary Fig. S1A). These results revealed that knockdown of AEG-1 enhanced radiosensitivity of glioma cells.
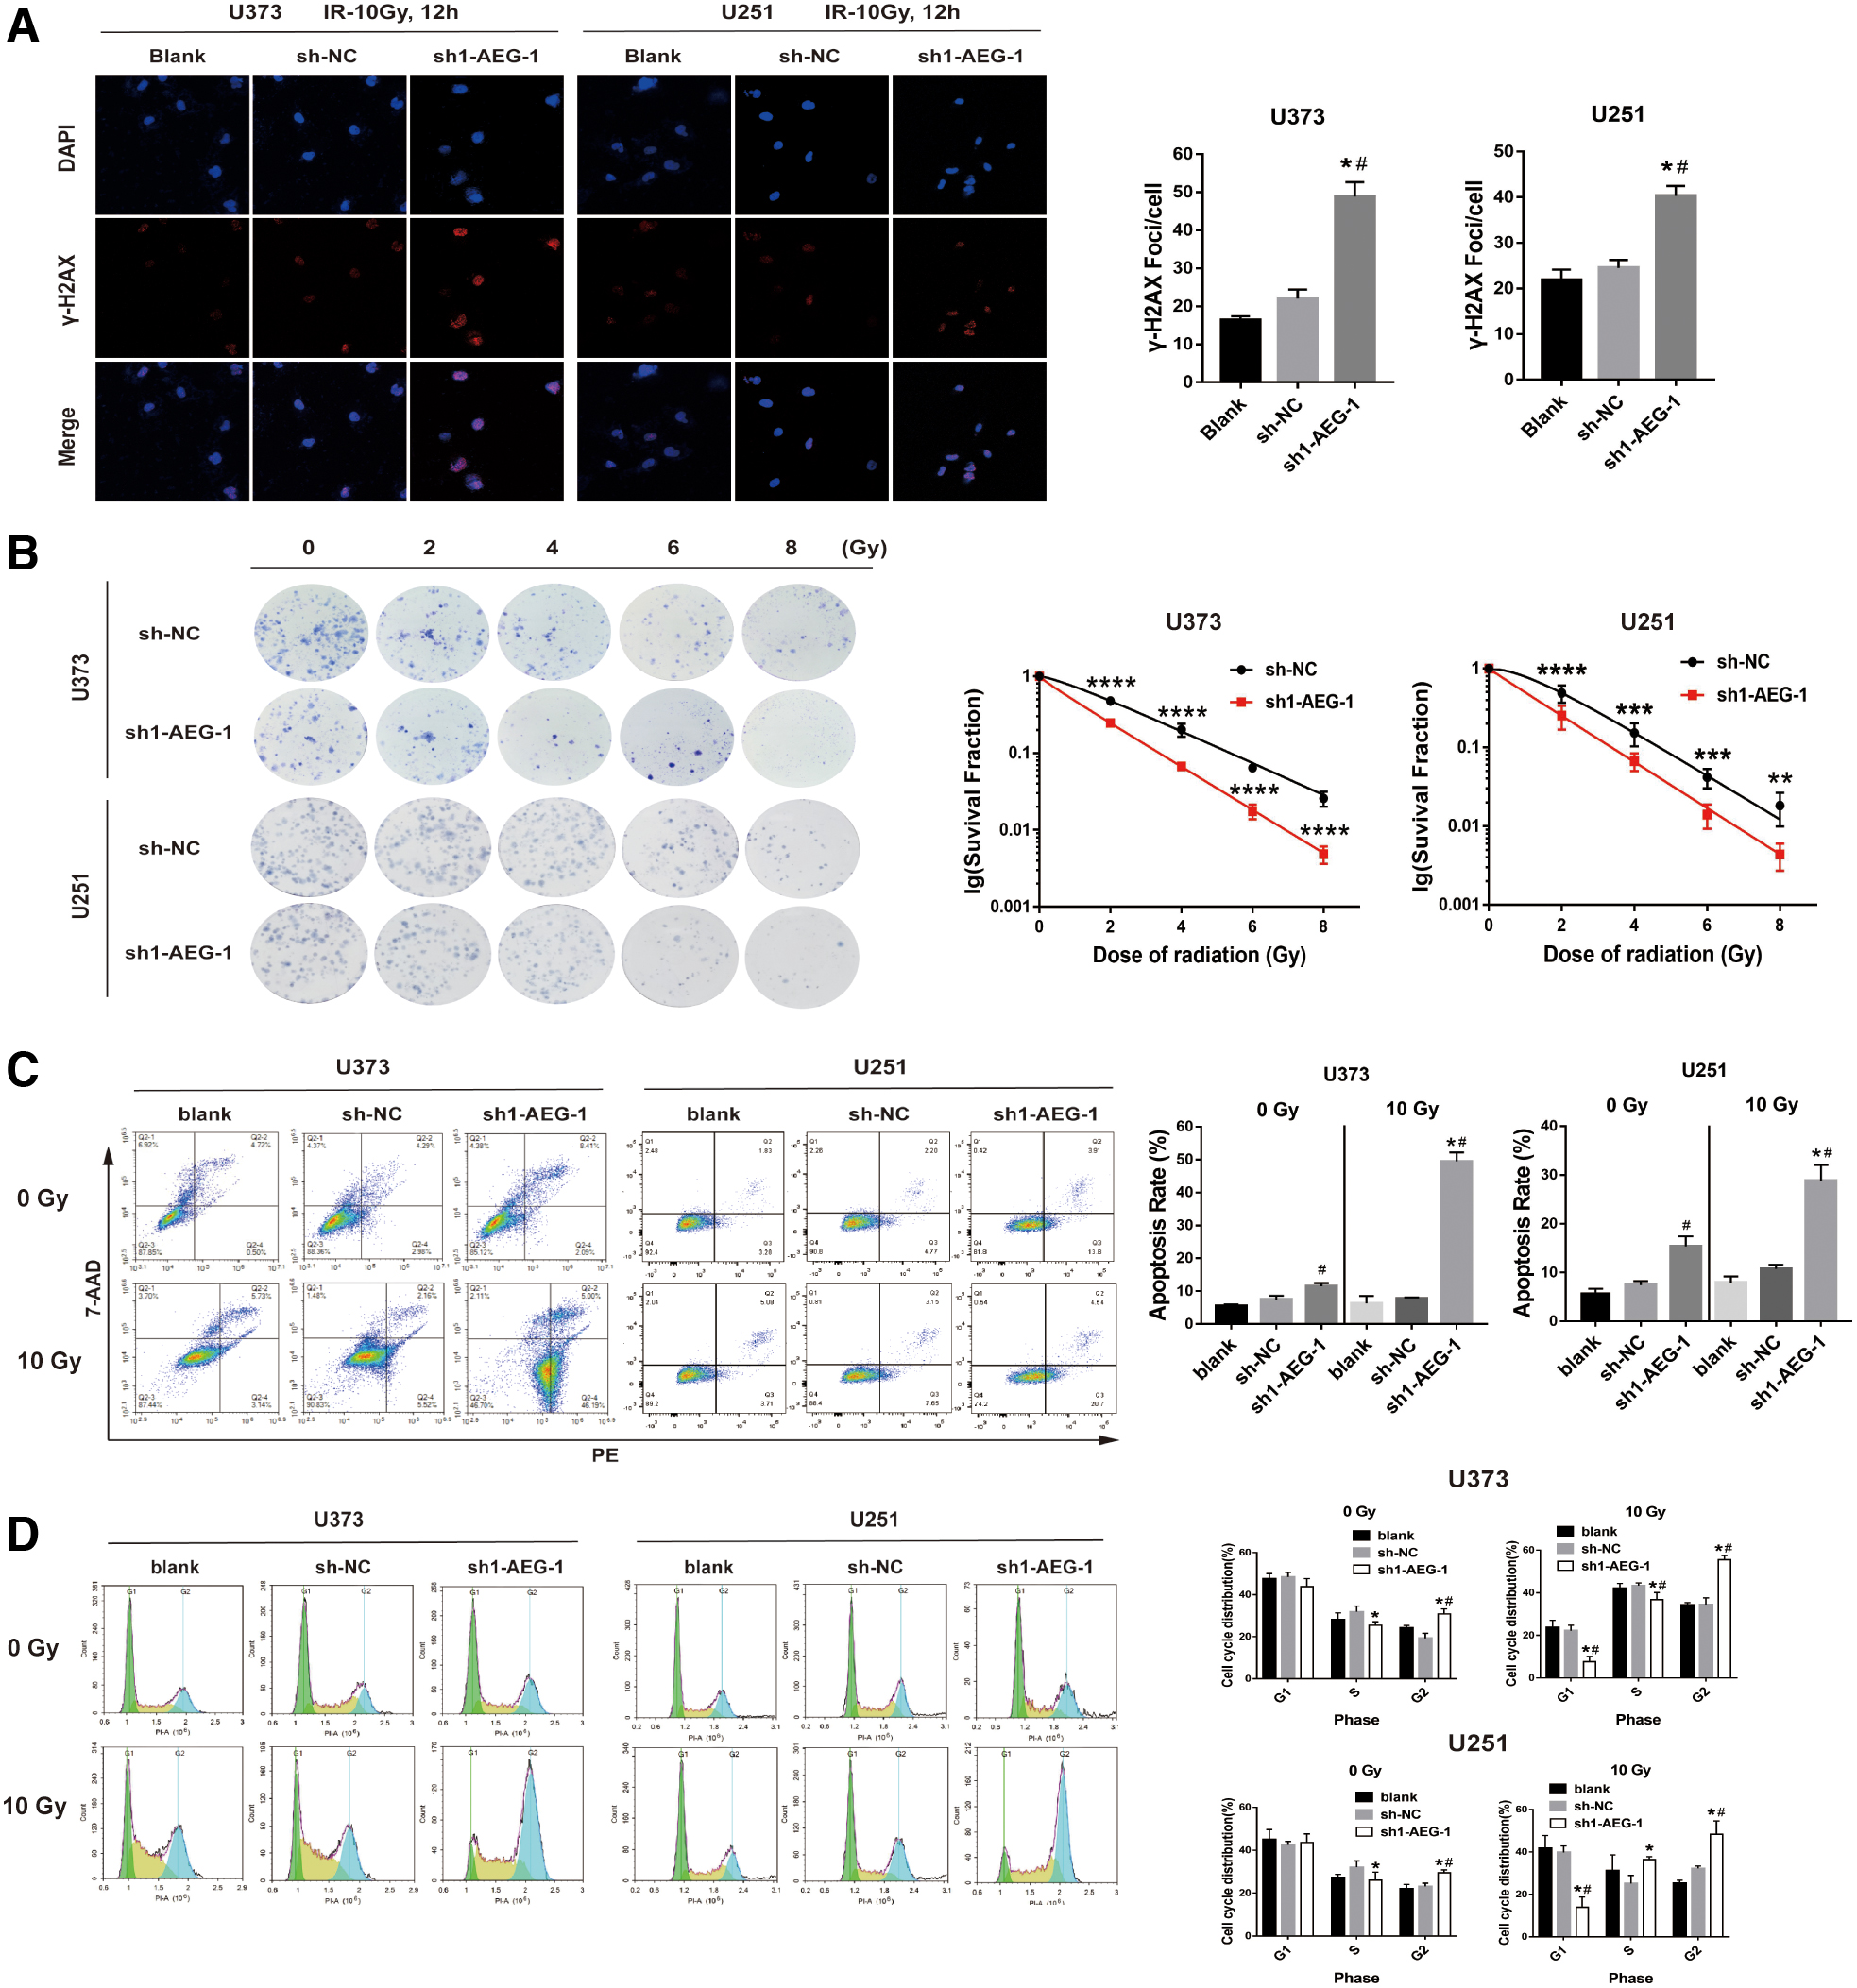
Knockdown of AEG-1 enhanced radiosensitivity of glioma cells.
We further detected the apoptotic rate of glioma cells treated with or without irradiation by flow cytometry. As is shown in Figure 3C, the apoptotic rate of sh1-AEG-1 group was higher than that of blank group without radiation. After receiving a dose of 10Gy X-ray, the apoptotic rate of sh1-AEG-1 group was significantly increased compared with blank group and sh-NC group (Fig. 3C). The above results suggested that AEG-1 knockdown promoted apoptosis of glioma cells induced by radiation.
Then, we explored the potential effect of AEG-1 depletion on cell cycle distribution of glioma with or without IR. Without radiation, sh1-AEG-1 group of U373 and U251 cells showed a higher proportion in G2 phase than those of blank group and sh-NC group. Yet after receiving radiation, all the three groups of U373, U251, and LN229 cells exhibited an increasing proportion in G2 phase, and a much higher proportion of cells in sh1-AEG-1 group were arrested in G2 phase (Fig. 3D and Supplementary Fig. S1B). These findings demonstrated that AEG-1 downregulation remarkably promoted G2 phase arrest of glioma cells in combination with IR.
Knockdown of AEG-1 impaired homologous recombination repair by impeding RFC5 expression
To further identify the mechanism of AEG-1 knockdown in promoting radiosensitivity of glioma cells, we performed an Affymetrix microarray to detect differentially expressed genes (DEGs) between sh1-AEG-1 and sh-NC glioma cells. With the cutoff standard of |logFC| > 1.5 and p-value <0.05, a total of 1702 genes were identified, including 750 upregulated genes and 952 downregulated genes (Fig. 4A). Then, we screened the top 50 DEGs and produced a heat map (Fig. 4B). We further selected the target genes from the heat map, and revealed a positive correlation between RFC5 levels and AEG-1 levels in glioma tissues by using GEPIA (Fig. 4C). Then, Western blot results confirmed that RFC5 was downregulated in sh1-AEG-1 group (Fig. 4D). As homologous recombination and nonhomologous end joining (NHEJ) were two major DNA double-strand breaks (DSBs) repair pathways induced by IR (Iliakis et al., 2019), we first determined the pathway in which RFC5 was involved by performing protein–protein interaction (PPI) analysis based on String database. Interestingly, the results showed that RFC5 had a strong interaction with RAD9A and RAD51 (Fig. 4E). RAD9A was a cell cycle checkpoint regulator, which mainly initiated DNA damage response and repair process (Pang et al., 2016), and RAD51 was an essential factor in homologous recombination pathway (Southgate et al., 2020). Therefore, we subsequently tested the expression of RFC5, RAD9A, and RAD51 in AEG-1 knockdown glioma cells treated with irradiation. The results showed that the expression of RFC5, RAD9A, and RAD51 in sh1-AEG-1 group was significantly downregulated after receiving IR (Fig. 4F). Then, we overexpressed RFC5 in glioma cells, and found that AEG-1 expression in sh1-AEG-1 group was not obviously affected by RFC5 overexpression (Fig. 4G). Furthermore, the expression levels of AEG-1, RAD9A, and RAD51 in sh1-AEG-1 group were partially resorted by overexpression of RFC5 in AEG-1 knockdown glioma cells treated with IR (Fig. 4H). Taken together, these results indicated that AEG-1 knockdown impaired radiation-induced HR repair activity by suppressing RFC5 expression.

Knockdown of AEG-1 impaired homologous recombination repair by impeding RFC5 expression.
High levels of AEG-1 and RFC5 were associated with poor prognosis in glioma patients treated with radiotherapy
Since AEG-1 and RFC5 were related to radiosensitivity of glioma cells, we continued to investigate their association with the prognosis of glioma patients receiving radiotherapy. The Kaplan–Meier survival analysis showed that overall survival (OS) and disease-free survival (DFS) of AEG-1 high-level group were significantly shorter than those of AEG-1 low-level group (Fig. 5A), and patients with high levels of RFC5 had an apparently worse OS and DFS (Fig. 5B). Furthermore, multivariate Cox regression analysis indicated that levels of AEG-1 and RFC5, as well as WHO grade, grade grouping, and pathological type, served as the independent prognostic factors of glioma patients (Table 3). Therefore, these findings suggested that AEG-1 and RFC5 could be used to predict the poor prognosis of glioma patients receiving radiotherapy.
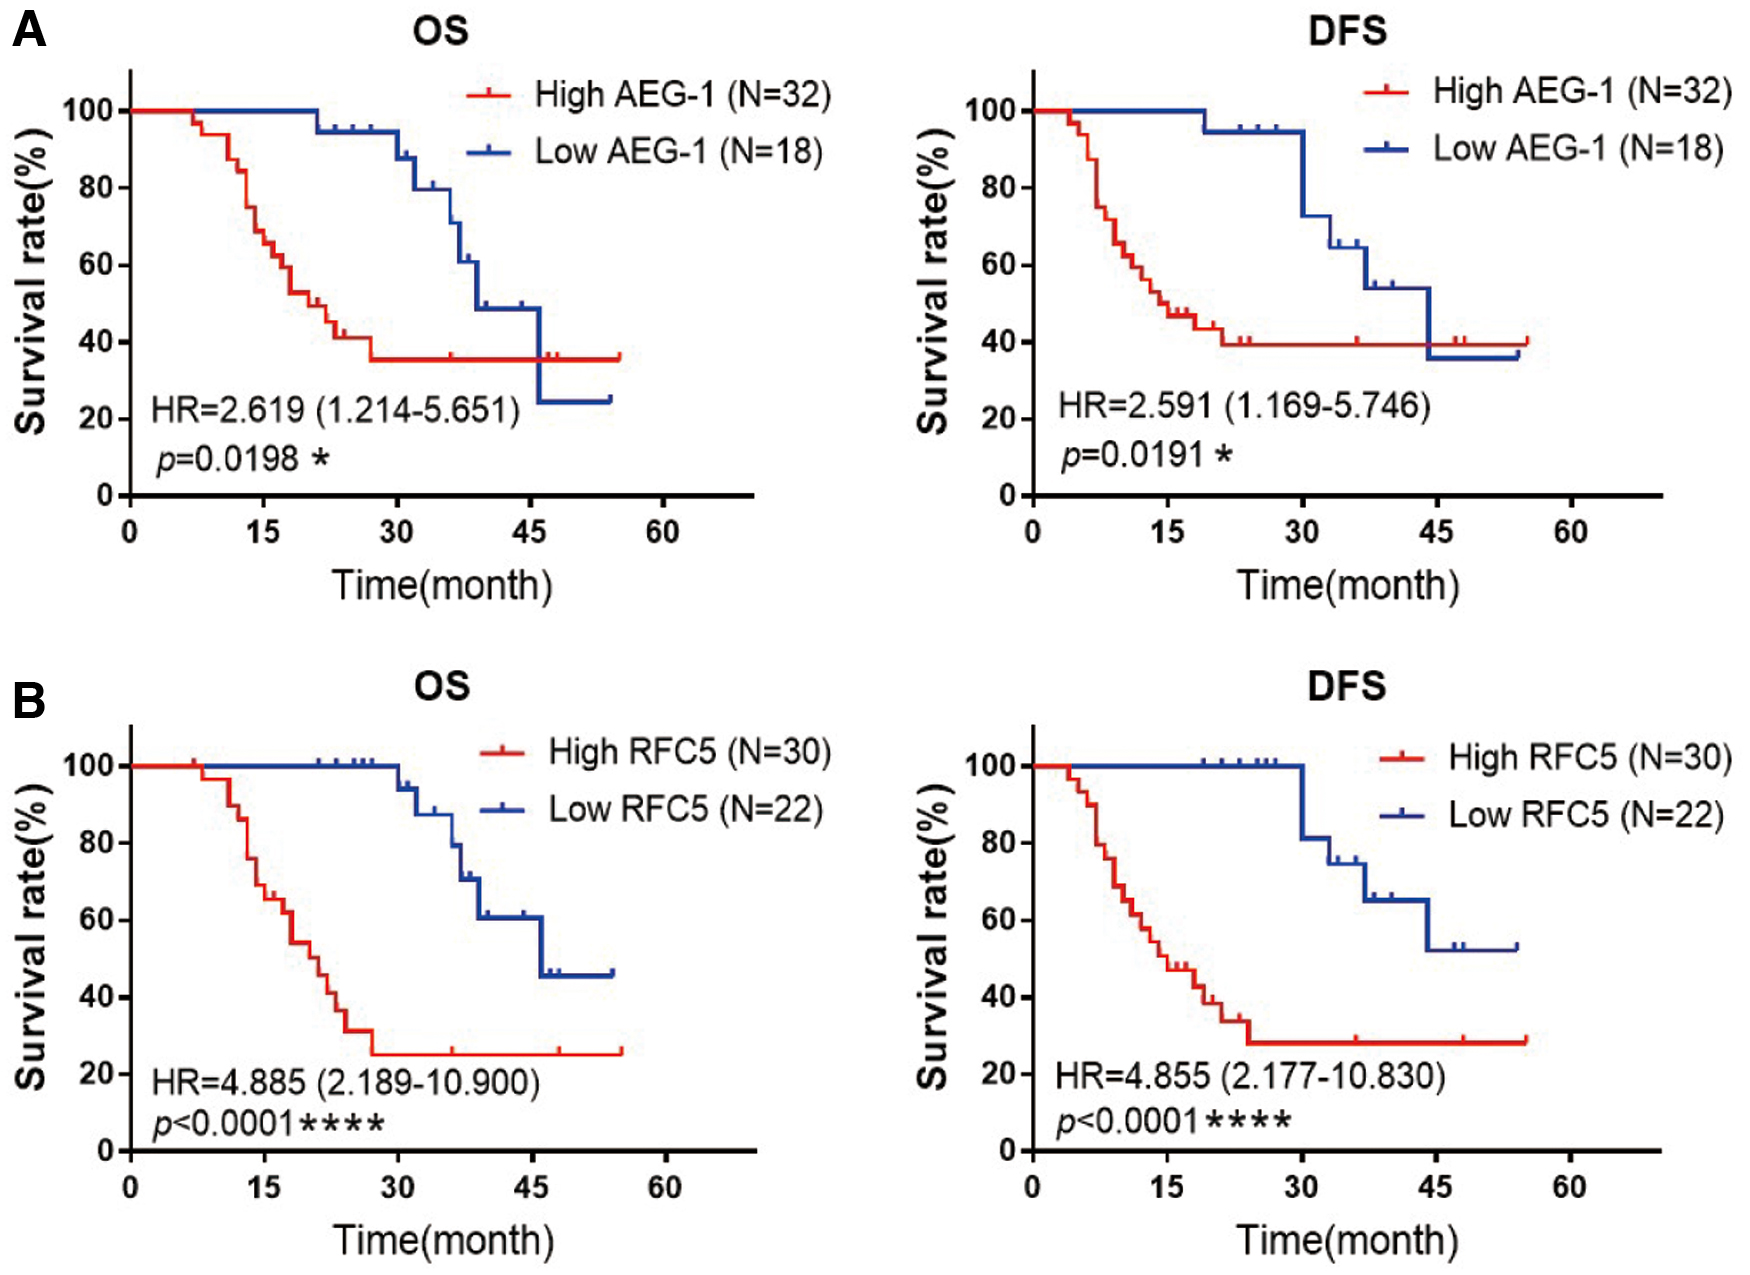
High levels of AEG-1 and RFC5 were associated with poor prognosis in glioma patients treated with radiotherapy.
Multivariate Cox Regression Analysis of Factors Influencing Prognosis of Glioma Patients
Bold p-values are statistically significant (p < 0.05).
CI, confidence interval; DFS, disease-free survival; HR, hazard ratio; OS, overall survival; RFC5, replication factor C5.
Discussion
At present, the main treatments of glioma are based on maximum surgical resection combined with adjuvant chemoradiotherapy (Stupp et al., 2017). However, most patients inevitably experienced recurrence after receiving radiotherapy due to general radioresistance of glioma cells (Xiong et al., 2019). Therefore, it is urgent to carry out research on the mechanism of resistance to radiation in glioma cells. AEG-1 was known to be located at chromosome 8q22, with the full length composed of 3611 nucleotides (Kang et al., 2005). Several recent reports confirmed that AEG-1 functioned as an oncogene to promote malignant glioma progression and invasion through interacting with several critical signaling molecules, such as Ha-ras, C-myc, p53, MDM2, and GSK3β, highlighting the potential therapeutic role of AEG-1 in glioma treatment (Ding et al., 2019; Osama et al., 2020). In the present research, our results showed that AEG-1 expression was higher in glioma tissues, and was closely correlated with high WHO pathological grade and grade grouping of glioma patients. Furthermore, AEG-1 was generally highly expressed in glioma cells and was significantly decreased after transfecting with specific shRNA. The result of CCK-8 assay found that knockdown of AEG-1 suppressed cell proliferation of glioma. Consistent with this result, Zhang et al. (2017) revealed that silencing AEG-1 evidently restrained proliferation of melanoma A375 cells. Wang et al. (2017) also found that AEG-1 attenuation inhibited cell growth in ovarian cancer. The above results suggested that AEG-1 served as an oncogene to promote tumor growth and progression.
By investigating the capabilities of γ-H2AX foci and colony formation in glioma cells upon IR treatment, we revealed that AEG-1 knockdown remarkably enhanced radiosensitivity of glioma cells. And flow cytometry results showed that knockdown of AEG-1 promoted glioma cell apoptosis induced by radiation. Previous reports demonstrated that the radiosensitivity of tumor cells was different at different phases in cell cycle, with relative radioresistance in G1 phase and S phase and maximum radiosensitivity in G2 phase (Qiu et al., 2018). The cell cycle dependence was attributed to the distinct functions of DNA damage repair pathways at different cell cycle phases (Goto et al., 2017). As the key regulators of checkpoints in G1 phases, such as p53, were prone to mutate in most cancers, leading to defects of DNA repair in G1 phase, thus, checkpoints in G2 phase were essential for DNA repair (Toulany, 2019). For instance, Tian et al. (2020) found that the proportion of human hepatocellular carcinoma cells HepG2 in G2/M phase significantly increased after receiving radiation. By performing flow cytometry analysis, our results also showed that AEG-1 knockdown obviously promoted glioma cells to arrest in G2 phase after exposure to IR.
The main biological effect of IR is to cause DSBs, resulting in cell death (McBride and Schaue, 2020). And NHEJ and homologous recombination are the two main pathways in DSB repair (Berthel et al., 2019). NHEJ, which includes the main proteins Ku70, Ku80, and DNA PKCs, leads to efficient but error-prone repair, while homologous recombination repair is a relatively slow but highly accurate process, which includes the core proteins BRCA1, BRCA2, and RAD51 (Morgan and Lawrence, 2015; Wang et al., 2019b; Zeng et al., 2020). In this study, RFC5 was identified as a potential target to regulate radiosensitivity of glioma cells through interacting with AEG-1. Through PPI network analysis, we found that RFC5 could interact with RAD9A and RAD51, both of which were considered the key factors to initiate and regulate homologous recombination repair pathway (Sierant and Davey, 2018). By performing Western blot, we found that AEG-1 knockdown significantly downregulated the expression levels of RFC5, RAD9A, and RAD51 in glioma cells treated with IR, while the overexpression of RFC5 partially antagonized the effects of AEG-1 depletion. Taken together, these results indicated that AEG-1 knockdown inhibited RFC5 expression to reduce radioresistance of glioma cells through inhibiting DSBs repair mediated by homologous recombination.
Recently, increasing evidence showed that AEG-1 was closely related to the poor prognosis of multiple cancers, including breast cancer (Wang et al., 2019a), NSCLC (Ding et al., 2018), hepatocellular carcinoma (Jung et al., 2015), and ovarian cancer (Yu et al., 2018). In this study, the Kaplan–Meier survival curves and multivariate Cox regression analysis proved that high levels of AEG-1 and RFC5 were significantly related to the poor survival of glioma patients treated with radiotherapy, and could serve as the independent prognostic risk factors among glioma patients.
Conclusion
In conclusion, our research discovered that AEG-1 was highly expressed in glioma tissues and was closely correlated with high pathological grade of glioma patients. Moreover, AEG-1 knockdown significantly suppressed proliferation and enhanced radiosensitivity of glioma cells, and the mechanism demonstrated that AEG-1 knockdown impaired HR-mediated DSBs repair induced by radiation through attenuating RFC5 expression. In addition, high levels of AEG-1 and RFC5 were tightly associated with poor prognosis of glioma patients treated with radiotherapy. Therefore, these findings suggested that AEG-1 could serve as a reliable therapeutic target to improve radiosensitivity and prognosis of glioma patients.
Footnotes
Acknowledgment
The results published in this study are in part based on data by GEPIA and String database.
Authors' Contributions
Xu Zhao designed and performed the experiments in this study, and completed the writing of the article. Xiaozhi Zhang supervised the progression of the study. Yuchen Sun conducted the statistical analyses. Xuanzi Sun plotted the statistic graphs. Jing Li and Xiaobo Shi helped to edit the article. Zhinan Liang and Yuan Ma contributed to the collection of glioma tissues and cell cultivation. All authors gave final approval of the version to be published and agreed to be accountable for all aspects of the work.
Disclosure Statement
No competing financial interests exist.
Funding Information
This study was financially supported by the National Natural Science Foundation of China (81272775) and the Key Research and Development Program of Shaanxi Province (2018SF-024).
Supplementary Material
Supplementary Table S1
Supplementary Table S2
Supplementary Figure S1
References
Supplementary Material
Please find the following supplemental material available below.
For Open Access articles published under a Creative Commons License, all supplemental material carries the same license as the article it is associated with.
For non-Open Access articles published, all supplemental material carries a non-exclusive license, and permission requests for re-use of supplemental material or any part of supplemental material shall be sent directly to the copyright owner as specified in the copyright notice associated with the article.
