




Abstract
In vitro generation of red blood cells has the potential to circumvent shortfalls in the global demand for blood for transfusion applications. However, cell differentiation and proliferation are often regulated by precise changes in gene expression, but the underlying mechanisms and molecular changes remain unclear. Quantitative reverse transcription–polymerase chain reaction (qRT-PCR) can be used to evaluate multiple target genes. To make the results more reliable, suitable reference genes should be used to calibrate the error associated with qRT-PCR. In this study, we utilized bioinformatics to screen 3 novel candidate reference genes (calcium and integrin binding family member 2 [CIB2], olfactory receptor family 8 subfamily B member 8 [OR8B8], and zinc finger protein 425 [ZNF425]) along with eight traditional reference genes (glyceraldehyde-3-phosphate dehydrogenase [GAPDH], β-actin [ACTB], 18S RNA, β2-microglobulin [β2-MG], peptidylprolyl isomerase A [PPIA], TATA box-binding protein [TBP], hydroxymethylbilane synthase [HMBS], and hypoxanthine phosphoribosyltransferase 1 [HPRT1]). Two software algorithms (geNorm and NormFinder) were used to evaluate the stability of expression of the 11 genes at different stages of erythrocyte development. Comprehensive analysis showed that expression of GAPDH and TBP was the most stable, whereas ZNF425 and OR8B8 were the least suitable candidate genes. These results suggest that appropriate reference genes should be selected before performing gene expression analysis during erythroid differentiation and that GAPDH and TBP are suitable reference genes for gene expression studies on erythropoiesis.
Introduction
The transfusion of red blood cells (RBCs) has become an indispensable therapeutic intervention for patients experiencing traumatic injury, undergoing surgical procedures, or suffering from chronic conditions such as chronic anemia (Lee et al., 2018; Zamani et al., 2021). However, the shortage of blood for transfusions is a global problem. Research on stem cells, specifically hematopoietic stem cells (HSCs), holds promise for large-scale generation of mature RBCs through induction of their expansion and differentiation (Rallapalli et al., 2019; Liu et al., 2021; Zamani et al., 2021).
Cord blood (CB) is an excellent source of HSCs and often shows more efficiency and plasticity in multilineage differentiation than adult bone marrow or peripheral blood (Lee et al., 2018; Zamani et al., 2021). Differentiation of stem cells involves various morphological variations as well as changes in the expression levels of several genes (Vossaert et al., 2013; Ayanoglu et al., 2020). Hence, it is important to select a reference gene that is suitable for all cell types during erythroid differentiation.
Quantitative reverse transcription–polymerase chain reaction (qRT-PCR) is a highly sensitive method for measuring alterations in gene expression (Balaji and Vanniarajan, 2020; Ho and Patrizi, 2021). Normalizing the expression level of target genes against that of a reference gene is essential to obtain accurate results (Panina et al., 2020). However, the use of commonly used reference genes such as glyceraldehyde-3-phosphate dehydrogenase (GAPDH) and β-actin (ACTB) has not been confirmed in different cell types or experimental conditions (Radonic et al., 2004; Li et al., 2015; Ayanoglu et al., 2020). Therefore, stable reference genes should be performed based on the cell type and differentiation protocol.
In the present gene expression stability analysis, we selected novel reference genes in CD34+ HSCs based on the Gene Expression Omnibus (GEO) microarray dataset (GSE66260). geNorm and NormFinder were used to analyze the expression stability of eight traditional candidate reference genes (GAPDH, ACTB, 18S RNA, β2-microglobulin [β2-MG], peptidylprolyl isomerase A [PPIA], TATA box-binding protein [TBP], hydroxymethylbilane synthase [HMBS], and hypoxanthine phosphoribosyltransferase 1 [HPRT1]) and three novel candidate reference genes (calcium and integrin binding family member 2 [CIB2], olfactory receptor family 8 subfamily B member 8 [OR8B8], and zinc finger protein 425 [ZNF425]) during erythroid differentiation using qRT-PCR.
Materials and Methods
CD34+ cell isolation and culture and erythropoietic differentiation
Human CB samples were collected from healthy pregnant women after delivery (n = 3). This study was approved by the Institutional Review Board of the Beijing Yuhe Chinese and Western Medicine Integrative Rehabilitation Hospital (ZXYEC-KT-2017-04-P01). To obtain CB CD34+ cells, we first separated low-density mononuclear cells (MNCs) from CB by Ficoll-Hypaque (1.077 g/L; TBD Science, Tianjin, China) density gradient centrifugation and then isolated CD34+ cells from MNCs through positive selection using a CD34 MicroBead Kit (Miltenyi Biotec, Bergisch Gladbach, Germany) according to the manufacturer's instructions. More than 90% of the isolated cells were CD34+, as confirmed by flow cytometry (FCM).
In vitro generation of erythrocytes comprised three steps. In the first step (days 0–7), CB CD34+ cells were seeded at a density of 2 × 10⁵/mL in expansion medium comprising a serum-free expansion medium (SFEM; StemCell Technologies, Vancouver, Canada) supplemented with 100 ng/mL human Flt-3 ligand (Flt3L; PeproTech, Rocky Hill, NJ), 100 ng/mL human stem cell factor (SCF; PeproTech), 20 ng/mL interleukin (IL)-3 (PeproTech), 10 ng/mL human thrombopoietin (PeproTech), 10 ng/mL IL-6 (PeproTech), and 1 μM StemRegenin 1 (StemCell Technologies). In the second step (days 7–19), the expansion medium was replaced with differentiation medium (DM; SFEM II [StemCell Technologies] containing 100 ng/mL SCF, 40 ng/mL IGF-1, 10 U/mL erythropoietin [PeproTech], 200 μg/mL transferrin [Sigma, St. Louis, MO], 1 μM dexamethasone [Dex; Sigma], 2 mM GlutaMAX [Gibco, Grand Island, NY], and 40 μg/mL lipid [Gibco]), which was changed every 3 days. In the third step (days 19–21), the cells were cultured in DM without Dex for improved maturation. The cultures were maintained at 37°C in a humidified atmosphere containing 5% CO2.
Flow cytometry
The cultured cells were harvested on days 0, 7, 10, 14, 19, and 21 and their immunophenotypes were determined as follows. The cells were washed and resuspended in phosphate buffer saline supplemented with 1% bovine serum albumin. Antibodies against CD34-APC (BD Bioscience, San Diego, CA) or CD235a-PE (BD Bioscience) and CD71-APC (BD Bioscience) with the appropriate isotype controls were used according to the manufacturer's instructions. The gating strategy was based on the isotype controls, and analyses were performed using FlowJo software (Version 10; TreeStar, Ashland, OR).
Assessment of cell morphology
A total of 5 × 10⁴ sorted cells on slides were spun for 3 min at 1000 rpm (CYTOPRO 7622; Wescor, Logan, UT) and air-dried before being subjected to Wright–Giemsa staining (BASO, Zhuhai, Guangdong, China) according to the manufacturer's instructions. Images of the stained cells were captured using a digital camera (Nikon Corporation, Tokyo, Japan) at 200 × magnification.
RNA samples and cDNA synthesis
Total RNA was extracted using the TRIzol reagent (Life Technologies, Carlsbad, CA). The concentration and purity of the RNA samples were determined using a NanoDrop spectrophotometer (Thermo Scientific, Waltham, MA). cDNA was synthesized from ∼0.8 mg of total RNA using the ReverTra Ace qPCR RT Master Mix with gDNA Remover (Toyobo, Osaka, Japan), following the manufacturer's instructions.
Candidate genes and primers for qRT-PCR
Novel candidate reference genes were selected from a published erythropoiesis transcriptome array dataset (GEO accession number: GSE66260) (Merryweather-Clarke et al., 2016). Briefly, GEO2R analysis was performed using data from the Bioconductor project to determine the log fold change (logFC) in gene expression during erythropoiesis (P1–P3). Coding genes with logFC > −0.025 and <0.025 in each of these differentiation stages were selected as putative novel reference genes. Another eight candidate reference genes (whose primers were already available) commonly used in qRT-PCR analyses in HSC research were selected as traditional reference genes.
Real-time quantitative reverse transcription-PCR
qRT-PCR was performed using the THUNDERBIRD SYBR qPCR Mix (Toyobo) on Bio-Rad CFX Connect™ (Bio-Rad, Hercules, CA). Briefly, a 20-μL reaction mixture was subjected to qPCR under the following conditions: an initial denaturation at 95°C for 3 min, 40 cycles of denaturation at 94°C for 20 s, annealing at 58°C for 20 s, and extension at 72°C for 30 s. After amplification, a melting curve analysis was performed. The primers used for detection are listed in Supplementary Table S1.
Analysis of the expression stability of candidate genes
geNorm software written in Visual Basic for Applications in Microsoft Excel was used to analyze gene expression stability (Vandesompele et al., 2002). For each reference gene, we determined the pairwise variation with all the other reference genes as the standard deviation of logarithmically transformed expression ratios and defined the internal reference gene stability measure M as the average pairwise variation of a particular reference gene with all the other reference genes. An M value of less than 0.15 indicated that the number of reference genes met the requirements and that no housekeeping gene was needed. Genes with the lowest M values had the most stable expression among different culture environments or cell types. NormFinder software can be used to directly evaluate the stability of each tested reference gene according to intragroup and intergroup variances. Generally, the smaller the stability value, the better the expression stability of the corresponding gene (Wang et al., 2020). Finally, the most stable reference gene was selected according to the ranking of the candidate reference genes in geNorm and NormFinder. RefFinder, a comprehensive web-based tool, was used to determine the most stable reference gene for the final ranking (Xie et al., 2012).
Results
Flow cytometric analysis of erythrocytes at different developmental stages
The cultured cells expressed CD71 on day 7 and gained CD235a expression as they continued to mature. Finally, CD71 expression was gradually lost (Fig. 1). Alterations in marker expression indicate the gradual establishment of cells committed to the erythroid lineage and the maturation of these erythroid cells.

Flow cytometric analyses of in vitro-generated red blood cells from CB CD34+ cells. Cells from the indicated days were double-labeled with APC-conjugated anti-CD71 mAb and PE-conjugated anti-CD235a mAb. The percentages of cultured cells expressing CD71 and/or CD235a on days 0, 7, 10, 14, 19, and 21 are given in the representative dot plots. Marker expression indicates the gradual establishment of cells committed to the erythroid lineage. CB, cord blood; mAb, monoclonal antibody.
To accurately evaluate erythrocytes at different stages, CD34+, CD71+CD235a−, CD71+CD235a+, and CD71−CD235a+ cells were sorted (Fig. 2A, B). Following erythropoietic differentiation, the cell size, nuclear condensation, and nuclear extrusion were detected by Wright–Giemsa staining. The morphological features of the CD34+ population predominantly corresponded to those of HSCs (Fig. 2C). Proerythroblasts and early basophilic erythroblasts composed the CD71+CD235a− population (P1); basophilic, polychromatic, and orthochromatic erythroblasts composed the CD71+CD235a+ population (P2); and late orthochromatic erythroblasts and reticulocytes composed the CD71− CD235a+ population (P3) (Wojda et al., 2002).
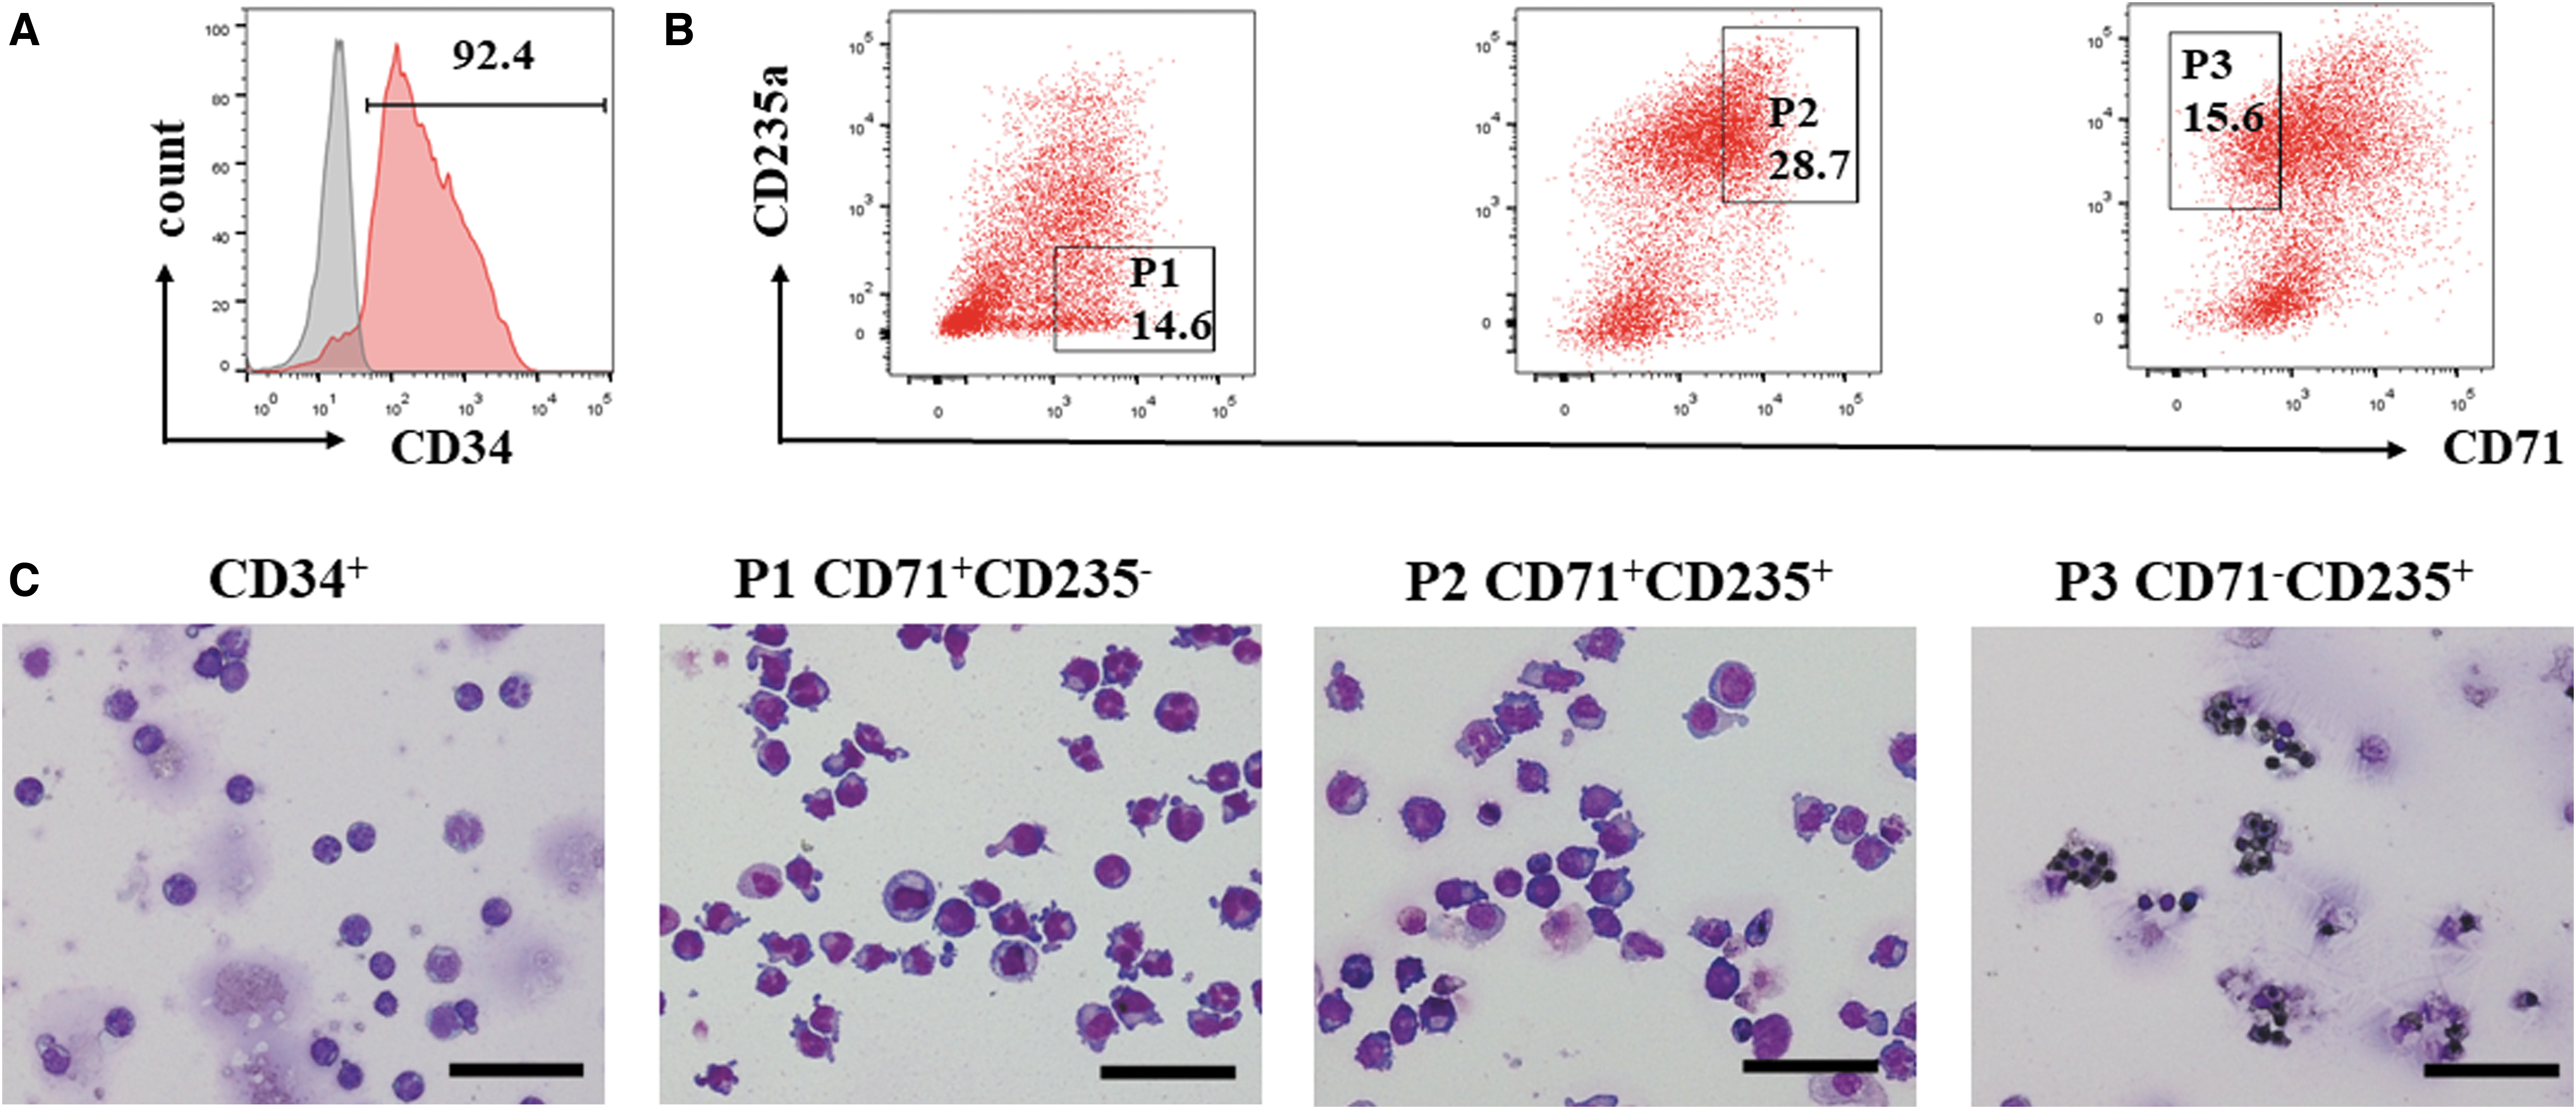
Fluorescence-activated cell sorting strategy and cell morphology in different developmental stages.
Selection of novel candidate reference genes from published microarray data
A gene expression profiling study (GSE66260) using the GEO database (
To identify these genes, GEO2R, an online interactive web tool for gene expression analysis, was used to process this dataset (Davis and Meltzer, 2007). First, gene expression analysis was performed to compare CD34+ cells and CD71+CD235a− cells. We selected genes with a logFC between −0.025 and 0.025, which reflects stable expression of genes between the two cell populations. We then performed a similar analysis with CD34+ cells and CD71+CD235a+ cells and CD34+ cells and CD71−CD235a+ cells. Of note, 4057, 3842, and 2097 genes showed a stable expression in CD34+/CD71+CD235a−, CD34+/CD71+CD235a+, and CD34+/CD71−CD235a+ cells, respectively. The overlap resulted in a list of only 19 genes that were stably expressed among all the tested stages (Fig. 3); of these, only three were coding genes and were thus selected as the final set of novel reference genes (CIB2, OR8B8, and ZNF425).
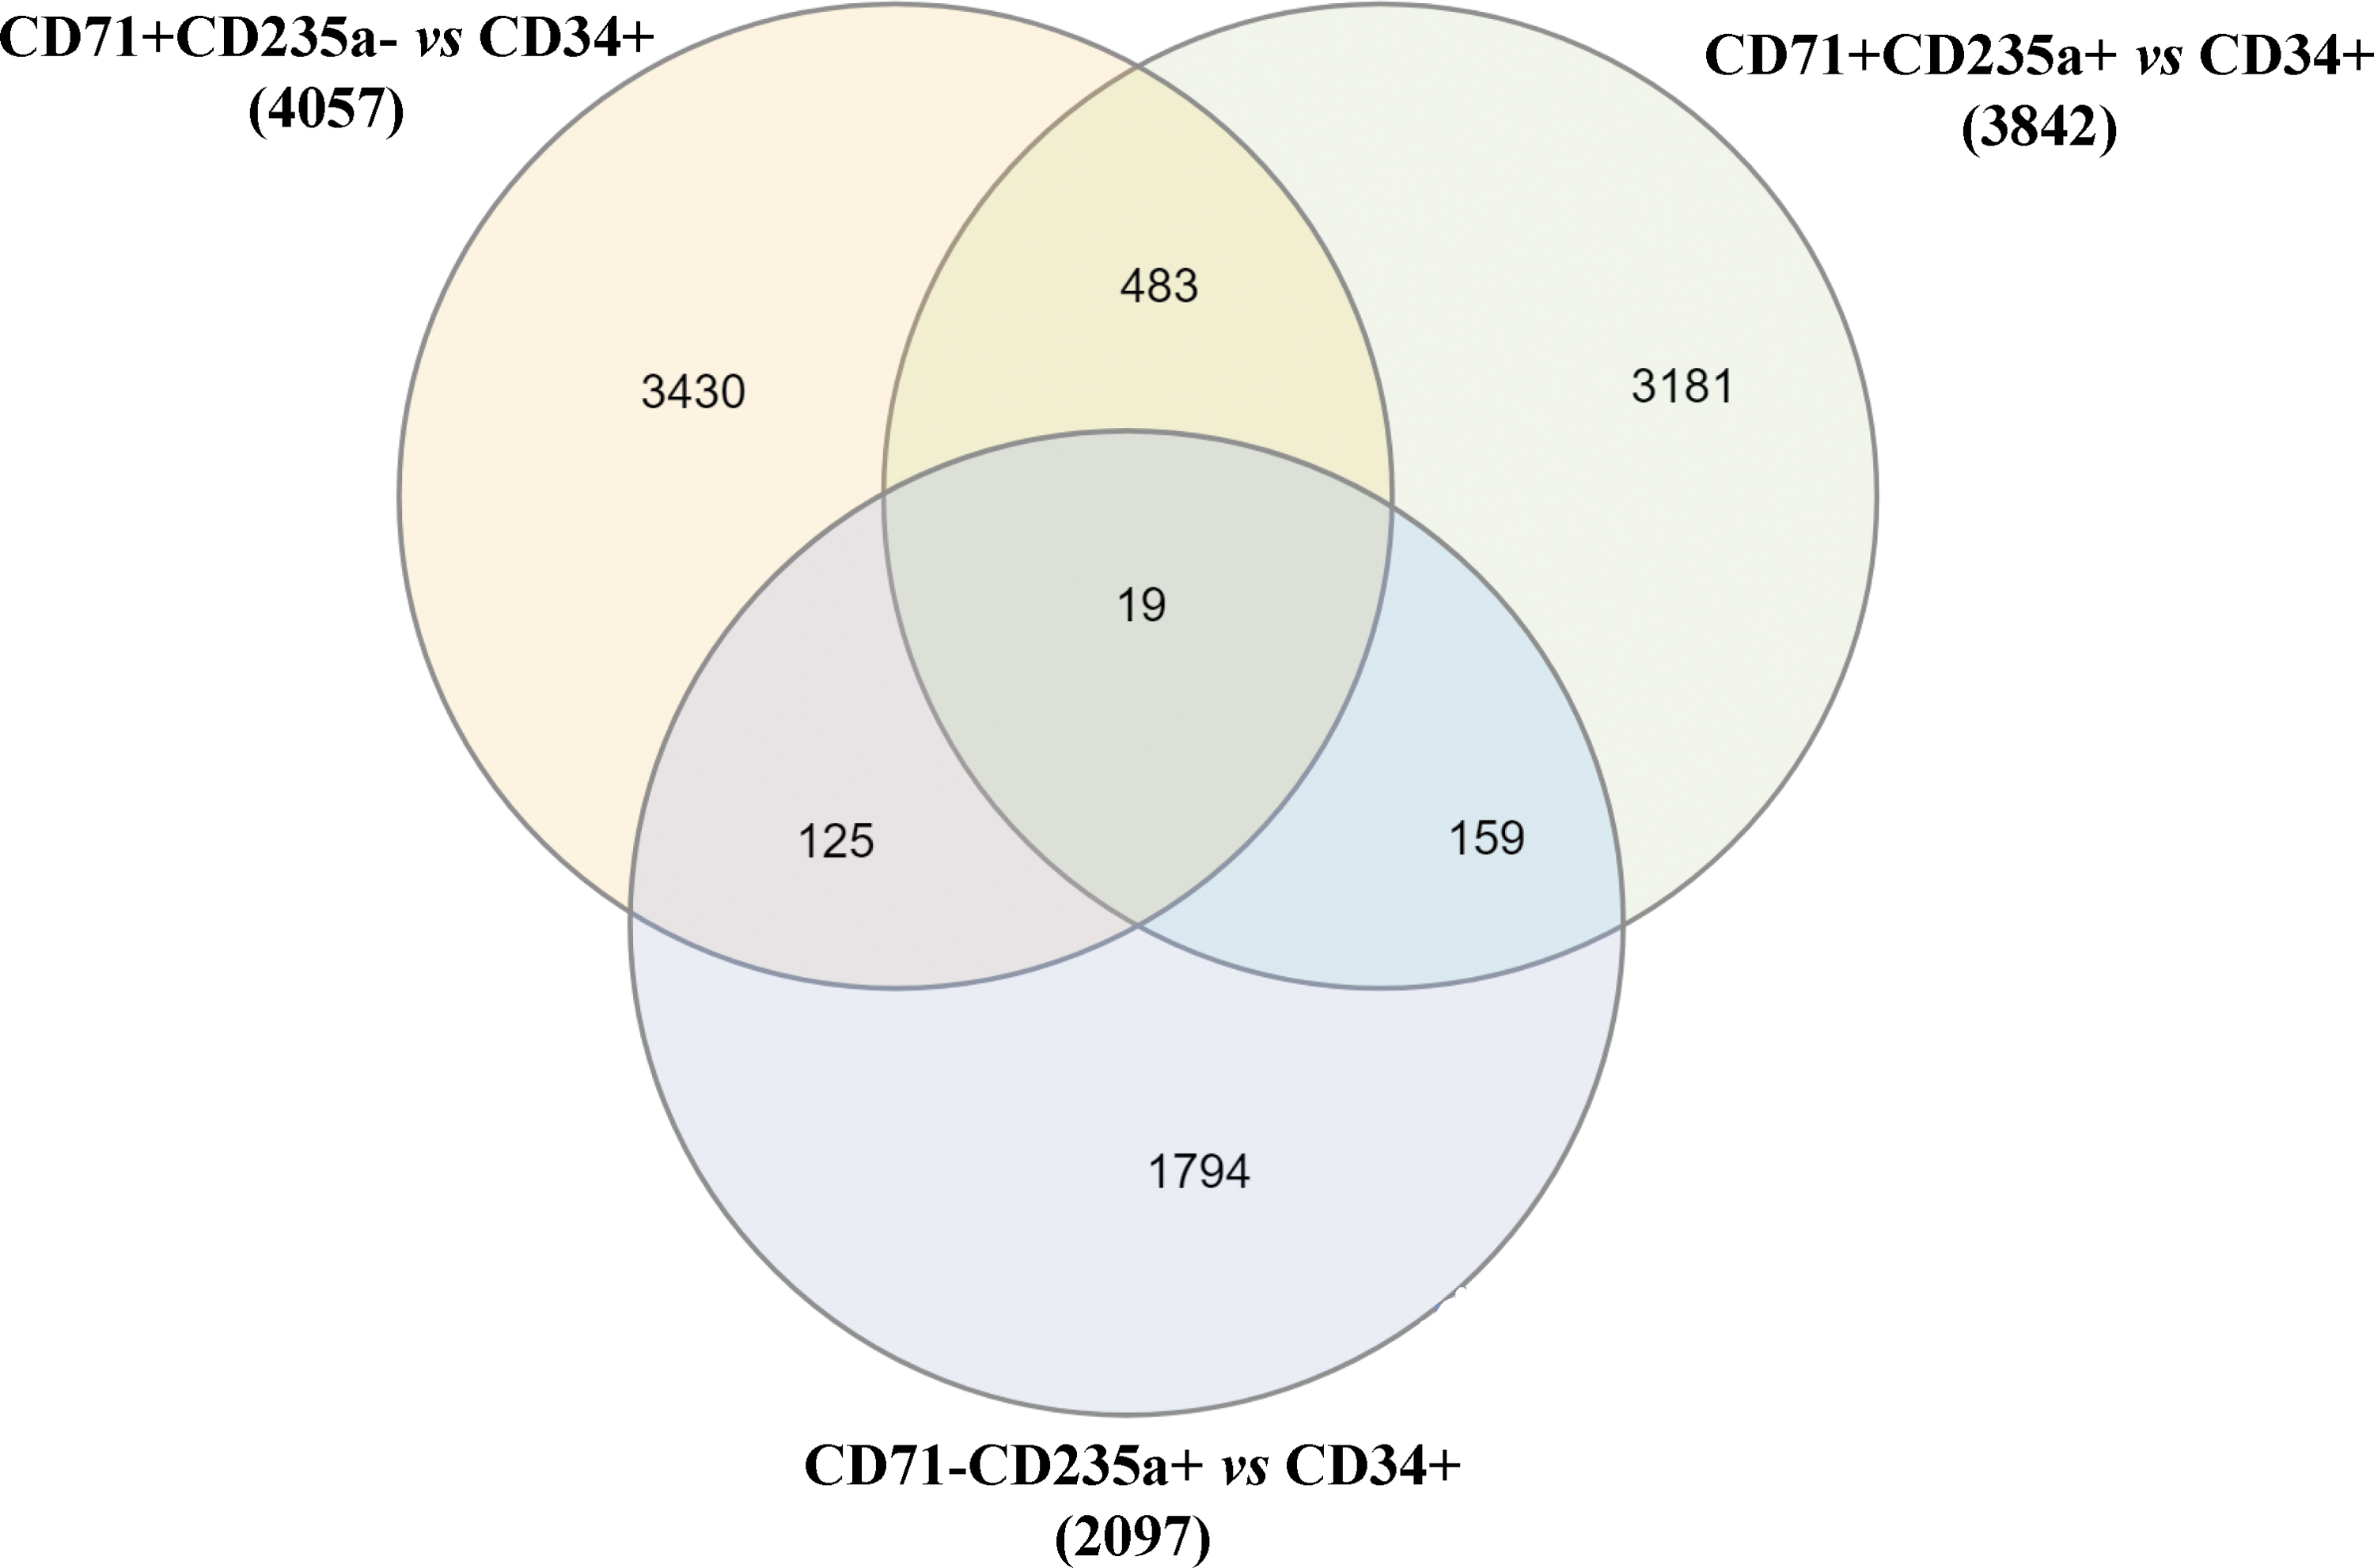
Identification of novel candidate reference genes. Venn diagram showing the overlap of genes with a logFC between −0.025 and 0.025 identified from CD71+CD235a−, CD71+CD235a+, and CD71−CD235a+ cells versus CD34+ cells. Only 19 genes were shared between all three comparisons. logFC, log fold change.
Identification of the specificity of primers
For each traditional and novel reference gene, primer specificity was determined by a single peak using the melting curve analysis, which indicated a single PCR product (Fig. 4).

Identification of the specificity of qRT-PCR amplicons. Dissociation curves with single peaks were generated from all amplicons

Variation in expression levels of the candidate reference genes
The value of cyclic quantification (Cq) is inversely proportional to the transcription level of a gene; that is, a higher Cq value corresponds to a lower expression level. Variation in the Cq value of the same gene in different cell types or conditions reflects the change in expression levels. In this study, the Cq values of the eight traditional reference genes and three novel reference genes changed during erythroid differentiation (Fig. 5).
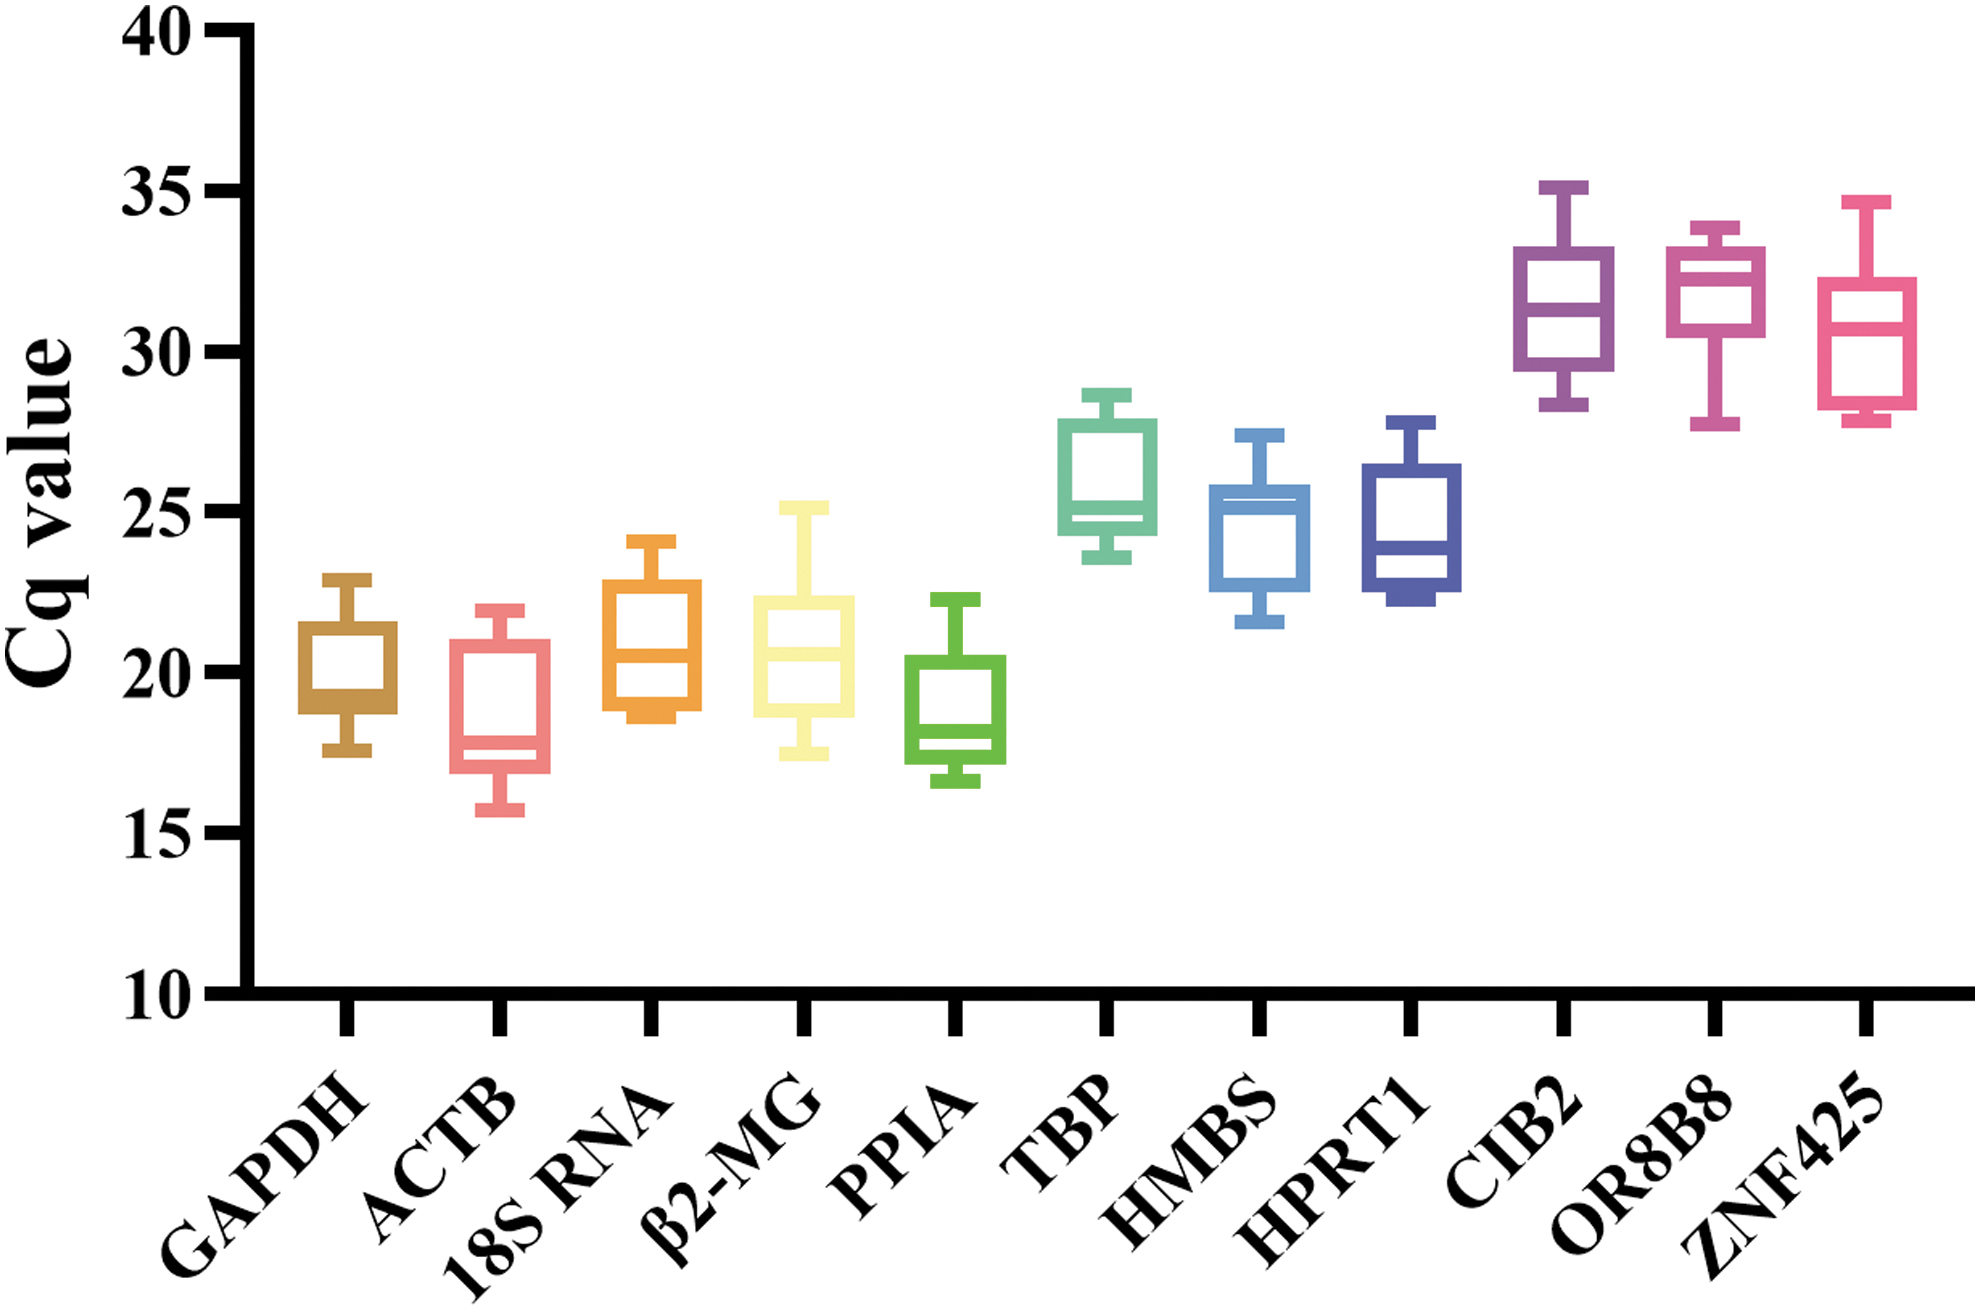
Variation in the Cq values of 11 candidate reference genes in all the samples. The box diagram shows median values (horizontal lines inside the boxes); one-quarter (Q1, 25th percentile) and three-quarter (Q3, 75th percentile) values; and whisker caps (minimum and maximum Cq values). Cq, cyclic quantification.
Among the 11 candidate reference genes, ACTB and OR8B8 had the lowest and highest Cq values, at 18.79 and 31.44, respectively, indicating a wide range of expression levels of these genes. The Cq values of GAPDH, ACTB, 18S RNA, β2-MG, PPIA, TBP, HMBS, HPRT1, CIB2, OR8B8, and ZNF425 ranged from 17.58 to 22.87, 15.73 to 21.92, 18.62 to 24.09, 17.49 to 25.13, 16.62 to 22.27, 23.55 to 28.65, 21.55 to 27.39, 22.29 to 27.75, 28.31 to 35.12, 27.71 to 33.85, and 27.80 to 34.63, respectively (Supplementary Table S2). Among the 11 genes, GAPDH and TBP had the smallest range of variation and the highest abundance in expression; the novel candidate gene ZNF425 showed the most variable expression. Our preliminary results indicated that GAPDH, TBP, HPRT1, and PPIA expression was relatively stable.
geNorm analysis for candidate reference gene stability
For accurate gene expression measurements, the expression of an ideal reference gene should be stable within the experimental parameters. The underlying principle of the geNorm algorithm is that ideal reference genes show stable expression patterns independent of experimental parameters (van de Moosdijk and van Amerongen, 2016). Furthermore, geNorm can score not only each candidate reference gene but also expression changes in each gene compared with the average expression of candidate genes.
The M values of TBP and GAPDH were the lowest and those of OR8B8 and HMBS were the highest, indicating that the expression of TBP and GAPDH was the most stable, whereas that of OR8B8 and HMBS was the least stable (Fig. 6). Regarding the expression stability of genes in CD34+, CD71+CD235a−, CD71+CD235a+, and CD71−CD235a+ cells, the two most stable genes were TBP and GAPDH, HPRT1 and GAPDH, HPRT1 and TBP, and OR8B8 and β2-MG, respectively.
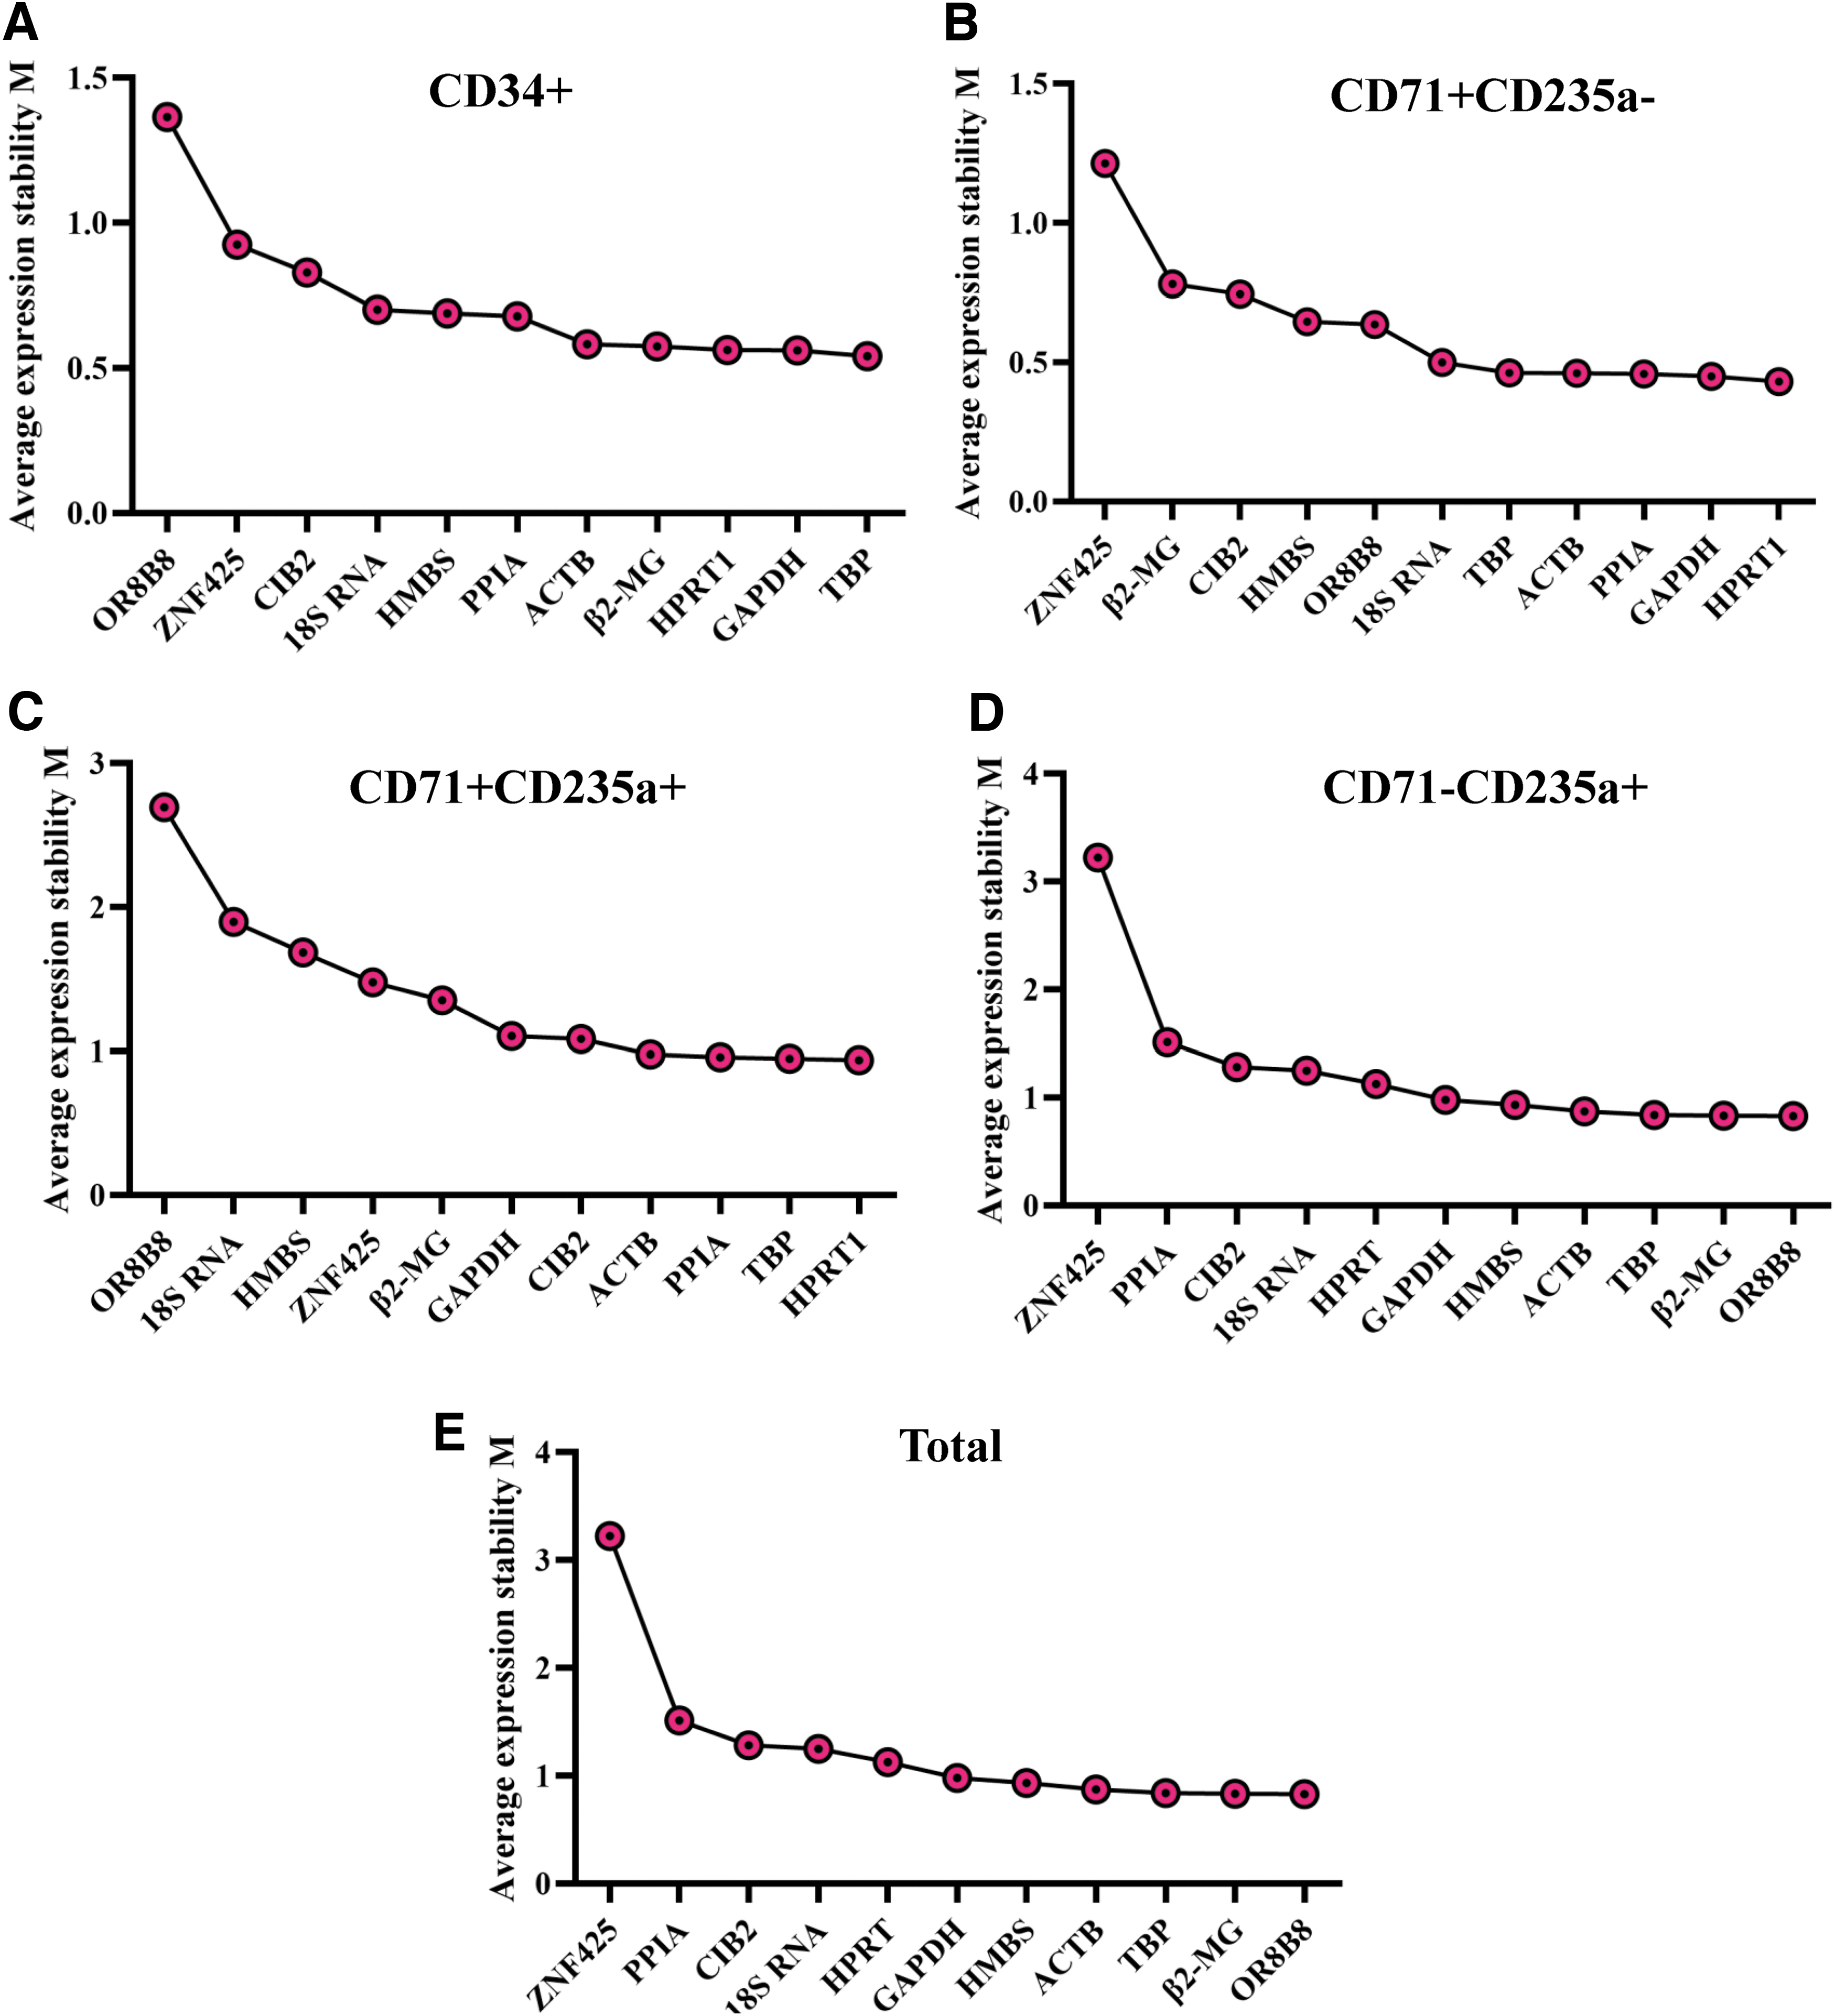
Average expression stability values (M) of the 11 candidate reference genes assessed based on the geNorm algorithm ranking. Graphs show candidate reference gene ranking according to the M value for gene expression stability analysis in CD34+ cells
NormFinder analysis of candidate reference gene stability
Generally, the more stable the expression of the candidate reference gene, the smaller the stability value. In all samples, TBP and GAPDH had the lowest stability values, at 0.626 and 0.638, respectively, indicating that their expression was the most stable (Table 1). OR8B8 had the highest stability value of 2.486, indicating that it had the most variable expression. These results concurred with those of the geNorm analysis.
Stability of Candidate Reference Genes Ranked by NormFinder
ACTB, β-actin; CIB2, calcium and integrin binding family member 2; GAPDH, glyceraldehyde-3-phosphate dehydrogenase; β2-MG, β2-microglobulin; HMBS, hydroxymethylbilane synthase; HPRT1, hypoxanthine phosphoribosyltransferase 1; OR8B8, olfactory receptor family 8 subfamily B member 8; PPIA, peptidylprolyl isomerase A; TBP, TATA box-binding protein; ZNF425, zinc finger protein 425.
RefFinder analysis of candidate reference gene stability
For a more comprehensive overview of reference gene stability, the web-based tool, RefFinder (
Stability of Housekeeping Genes Ranked by RefFinder
Discussion
Umbilical CB-derived CD34+ hematopoietic stem/progenitor cells (CB-HSPC-derived RBCs) are a major cell type for the study of erythropoiesis, owing to their easy availability and strong self-renewal ability (Lee et al., 2018; Zamani et al., 2021). Therefore, it is of significance to utilize umbilical CB-derived CD34+ cells to study changes in gene expression during erythroid differentiation and the underlying molecular mechanisms. Numerous gene expression changes occur during erythroid maturation (Zhang et al., 2017; Royer et al., 2018). As the expression levels of candidate reference genes can vary with cell differentiation (Farrokhi et al., 2012; He et al., 2015), treatment methods (Yan et al., 2020), growth factors (Kumar et al., 2018), and organ development stage (Xia et al., 2021), the expression stability of the reference gene should be assessed before the target gene. However, to the best of our knowledge, there has been no study to identify suitable reference genes for erythroid differentiation.
Most studies on gene expression during erythroid differentiation directly use traditional reference genes, such as 18S RNA (Afreen et al., 2020) and GAPDH (Ma et al., 2010; Liu et al., 2021). However, the stability of these reference genes in different developmental stages has not been assessed, and this could have a serious effect on gene expression analysis. For instance, actin is downregulated during the terminal differentiation of erythroid cells because it plays an important role in cell shrinkage and enucleation (Chen et al., 2009). Particularly in reticulocytes, the RNA transcription level of ACTB is too low to be quantified accurately and therefore it is not appropriate for use as a reference gene (Silver et al., 2006). Hence, we selected eight traditional internal reference genes and evaluated their expression changes at different stages of cell differentiation.
To identify suitable reference genes, we also screened three new reference genes (CIB2, OR8B8, and ZNF425) using bioinformatic tools based on the analysis of the GEO gene expression profile of erythroid cells. By setting the fold change in expression within a certain range (−0.025 to 0.025) (van de Moosdijk and van Amerongen, 2016), genes with a relatively constant expression level in different cell development stages can be identified and used as new candidate reference genes. In this study, 19 genes were expressed stably, as determined by the analysis of cell expression profiles, at different developmental stages, of which 3 were coding and 16 were noncoding genes (Fig. 3). To screen out more novel reference genes, the range of fold change in expression should be set high to investigate more new candidate genes.
In this study, two commonly used gene stability evaluation tools, NormFinder and geNorm, were utilized to assess the expression stability of 11 candidate genes screened during RBC development. The most stably expressed reference genes varied among the differentiation stages, and the appropriate reference genes were selected by analyzing the entire differentiation process. During erythropoiesis, the NormFinder analysis indicated that TBP (0.626) and GAPDH (0.638) were the most stable, whereas OR8B8 (2.486) and ZNF425 (1.650) were the least stable reference genes, among the eight traditional genes and the three novel genes. Simultaneously, the geNorm analysis revealed that TBP and GAPDH were the most suitable reference genes. Despite the expression stability, determined using the database analysis, the three new reference genes did not show a stable expression level at different stages of erythroid differentiation, probably due to different induction protocols. Meanwhile, the expression levels of the novel candidate genes, CIB2, OR8B8, and ZNF425, were found to be relatively low (with Cq values of 28.31–35.12, 27.71–33.85, and 27.80–34.63, respectively); therefore, it would be inappropriate to compare them against a relatively highly expressed gene. An expanded candidate gene range might help to identify better expression references.
Furthermore, RefFinder was used to determine the best reference gene ranked by different evaluation methods (Chen et al., 2021). According to the results, GAPDH and TBP fulfilled most of the criteria for a suitable reference gene, that is, they were highly abundant and displayed minimal fluctuation. Therefore, they were the most suitable reference genes for analysis during erythrocyte generation from CB CD34+ cells.
Of note, these optimal reference genes are specific to our experimental conditions, and researchers should comprehensively investigate and screen the reference genes before gene expression studies.
Conclusions
In conclusion, taking advantage of qRT-PCR and algorithms, two stably expressed genes, GAPDH and TBP, were screened out as internal reference genes for the study of erythroid differentiation and maturation of CB CD34+ cells. These reliable reference genes can be used in the mechanism study of erythroid development and the application of CB-HSPC-derived RBCs. In the study of erythrocyte or other lineage differentiation, reference genes with a stable expression level should be screened for better analysis of target genes.
Footnotes
Author Contribution Statement
L.X. performed the experiments, collected data, and participated in original draft and figure preparation. Z.G. and Z.Y. performed the experiments and collected data. H.L. and Z.F. performed the experiments and analyzed the data. L.C., Y.L., and M.Q. provided training and consultation. X.X. participated in the structured outline preparation and article revision. W.Y. and C.L. participated in the article revision. X.P. participated in conception of the review and final revision of the article.
Disclosure Statement
No competing financial interests exist.
Funding Information
This work was supported by the National Key Research and Development Program of China (Nos. 2017YFA0103100, 2017YFA0103103, and 2017YFA0103104), the Beijing Natural Science Foundation (No. 7194303), and the Guangzhou Health Care and Cooperative Innovation Major Project (No. 201803040005).
Supplementary Material
Supplementary Table S1
Supplementary Table S2
References
Supplementary Material
Please find the following supplemental material available below.
For Open Access articles published under a Creative Commons License, all supplemental material carries the same license as the article it is associated with.
For non-Open Access articles published, all supplemental material carries a non-exclusive license, and permission requests for re-use of supplemental material or any part of supplemental material shall be sent directly to the copyright owner as specified in the copyright notice associated with the article.
