




Abstract
Gastric carcinoma (GC) is one of the most common cause of tumor-related death. Chemotherapy resistance usually occurs, leading to cancer relapse and poor survival of GC patients. To investigate the role of miRNAs in chemotherapy resistance for GC patients, we conducted an integrated analysis of miRNA expression and survival information using data obtained from The Cancer Genome Atlas project. Genome-wide screening of chemotherapy response-specific miRNAs was performed using Cox proportional hazards regression analyses for patients who received chemotherapy or those who had never received chemotherapy, respectively. A four-miRNA expression signature (involving two protective miRNAs, miR-200b and miR-103a, and two risk ones miR-199 and miR-152) was predicted as a specific indicator for GC chemoresistance (p = 0.00053; hazard ratio = 8.63), outperforming those clinicopathological factors. Functional experiments confirmed the roles of these signature miRNAs in regulation of chemotherapy response. Functional enrichment of these signature miRNAs and risk score revealed positive association with epithelial-mesenchymal transition (EMT), and negative association with cell cycle checkpoint and DNA damage response. Furthermore, the immune infiltration-miRNA functional network analysis revealed transformation from activated effector cells to resting immunosuppressive cells are preferred in GCs with adverse chemotherapy response. In summary, our work identifies a four-miRNA expression signature as a promising chemoresistance biomarker in GC, which provides novel insights into developing new strategies to overcome GC chemoresistance.
Introduction
Gastric carcinoma (GC) is one of the most common causes of cancer-related deaths worldwide (Rahman et al., 2014). Although surgical removal is still the most effective way to treat GC, many GC patients have progressed to an advanced stage or have inoperable disease when they are diagnosed. Randomized trials have now established chemotherapy as standard adjuvant therapies (Cunningham et al., 2006). There remain, however, significant divergence of clinical outcomes for GCs receiving adjuvant therapy (Marin et al., 2016). Thus, identification of prognostic biomarkers is critical for guiding further treatment.
microRNAs (miRNAs) are a family of small (∼22 nt) noncoding RNAs that function as posttranscriptional regulators of gene expression (Lu et al., 2005). MiRNAs bind the 3′untranslated region of the target mRNAs by base pairing, resulting in degradation and translation repression of mRNAs (Lu et al., 2005). Increased studies have provided sufficient evidence revealing that miRNAs not only play crucial roles in normal developmental events, but also are widely involved in the development and progression of cancer types (Lee and Dutta, 2009) through regulating expression of cancer-related genes implicated in cancer stem cell (CSC) maintenance, cancer cell metastasis, and drug resistance (Garg, 2015; Lou et al., 2017). However, our understanding on the roles of miRNAs in chemotherapy response remains limited.
There are many miRNAs that have been identified as oncogenic molecules or tumor suppressor (Slack and Chinnaiyan, 2019). Some miRNAs are very stable so that they could persist in peripheral blood. Therefore, numerous studies focused on miRNAs to discuss their relationship to both cancer cell biology and clinical practice. MiRNA profiling screenings have also been performed in various types of cancers, including GC to identify prognosis-associated miRNAs as biomarkers to predict outcomes in patients. Chemotherapy resistance is the main obstacle to improve the survival rate of gastric cancer patients (Linkous and Yazlovitskaya, 2012). Several groups investigated in the role of miRNAs in drug resistance of gastric cancer, and revealed that high expression of some miRNAs, such as let-7g and miRNA-200c indicated sensitivity to chemotherapy (Chen et al., 2010b; Kim et al., 2011). In addition, some studies have also been carried out on the prediction of chemotherapy response by specific miRNA expression signatures. However, most of the studies focused on prognosis-related single miRNA or signature, and the relationship between miRNA expression pattern and adjuvant chemotherapy was unexplored. Therefore, whether these mentioned miRNAs can be used to predict adjuvant chemotherapy response remains largely unknown.
We speculated that the difference of molecular biomarker expression pattern may represent the cause of prognosis variation in patients undergoing chemotherapy. Thus, our study aimed to identify and verify the miRNA biomarker that predict the chemotherapy response of GC patients using an integrated method. In this study, we performed an integrative analysis of whole-genome miRNA expression using data from The Cancer Genome Atlas (TCGA). We discovered a four-miRNA signature-based risk scoring model to predict the adjuvant chemotherapy response of GC patients, which markedly outperform the clinical variables.
Materials and Methods
Patients and omics data
A total of 384 GC patients was included in the TCGA GC cohort (Cancer Genome Atlas Research et al., 2013). The miRNA expression datasets of the TCGA gastric cancer cohort were obtained by using UCSC Xena browser (
Identification of prognosis-related miRNAs specific for GC patients under adjuvant chemotherapy
To identify prognosis-related miRNAs in the TCGA GC cohort, we first performed univariate Cox proportional hazards regression analysis for each miRNA based on groups (high- and low-expression groups) according to the median value of the expression levels in the patients with or without adjuvant chemotherapy. Then, those miRNAs with significant prognostic values in patients under adjuvant chemotherapy, but not patients without adjuvant chemotherapy, were subjected to construction of predictive model by using multivariate Cox proportional hazards regression analysis.
Construction of prognosis-associated signature and nomogram
Least absolute shrinkage and selection operator (LASSO), a parameter selection method that manage high-dimensional regression variables with no prior feature selection step by shrinking all regression coefficients and forcing many variables to be exactly zero, was used to select the optimal miRNAs for predictive model construction. The penalty regularization parameter l was determined by the 10-fold crossvalidation by using R package “glmnet” (Friedman et al., 2010). Finally, on the basis of the miRNA expression weighted by the coefficients generated by LASSO penalized regression, a four-miRNA signature was identified with the lambda that minimizes the partial likelihood deviance. The risk score for each patient was calculated as: Score = L1 × Exp1+ L2 × Exp2 +…+ Ln × Expn, where Expi indicates the expression levels of the miRNAs and Li indicates the LASSO coefficients. Time-dependent receiver operating characteristic (ROC) curve “survivalROC” (Heagerty et al., 2000) R package was used to assess the predictive accuracy of the prognosis-associated signature. The “rms” R package was used to construct the nomogram based on the clinical parameters and the four-miRNA prognostic risk score in GC patients under adjuvant chemotherapy.
Cell lines
Briefly, eight GC cell lines, MKN45, MKN28, SNU16, SNU5, SNU1, HGC27, and AGS, and a human gastric mucosal cell, GES-1, were all commercially obtained from the American Type Culture Collection (ATCC). All cells were maintained in complete Dulbecco's modified Eagle's medium (DMEM; Thermo Fisher Scientific) containing 10% fetal bovine serum (FBS; Thermo Fisher Scientific), 100 U/mL penicillin, and 100 U/mL streptomycin under 5% CO2 in a humidified atmosphere at 37°C.
Quantitative real-time PCR analysis
TRIzol (Thermo Fisher Scientific) was used to extract total RNA according to the manufacturer. The extracted total RNA was screened for purity and concentration was screened in a NanoDrop™ One (Thermo Fisher Scientific). One microgram total RNA of indicated sample was used to synthesize cDNA with the miScript II RT Kit (Qiagen, Germany). To determine the expression of miR-199b, miR-152, miR-200b, and miR-103a, SYBR Green PCR master mix (TaKaRa, Japan) was used and real-time PCR reactions were conducted in triplicate using StepOnePlus Real-Time PCR System (ABI). The U6 was used as endogenous controls.
Proliferation assay
Proliferation assays of GC cells were performed using 3-(4,5-dimethylthiazol-2-yl)-2,5-diphenyltetrazolium bromide (MTT) reagent following the instructions. Briefly, GC cells used for MTT assays were plated at a density of 5 × 10³ cells/well in a 96-well plate in 200 μL of complete DMEM per well. Between 24 and 120 h of incubation, 25 μL of 4 μg/μL MTT (Sigma) was added to each well at a final concentration of 0.5 μg/μL. After a 2–4-h incubation at 37°C, the culture medium was gently aspirated, and 120 μL dimethyl sulfoxide (DMSO) was added to dissolve the resulting MTT formazan crystals. The optical density (OD) value of each well was examined at an absorbance of 570 nm through the enzyme-linked immunosorbent assay (ELISA) microplate reader (Bio-Rad) to measure the relative cell proliferating rate.
Five-fluorouracil assay
The AGS and MKN28 cells were incubated with 5-Fluorouracil for 24 h (Sigma) at concentrations of 0, 0.31, 0.63, 1.25, and 2.5 μg/mL. The cell viability was determined by MTT assays. Each assay was conducted by three biological replicates and each biological replicate was run in three technical replicates. Data were normalized against the OD570 value on that of control well to measure the relative viability of each well.
Overexpression of miRNAs
The MKN28 and AGS cells were harvested and seeded into a six-well plate at the concentration of 2 × 10⁵ cells/well in complete DMEM. Then the cells were transfected with either miR-199b, miR-152, miR-200b, miR-103a mimics or mimic negative control (mimic-Ctrl) at the final concentration of 2.5 μM with Lipofectamine 3000 (Thermo Fisher Scientific). All the miRNA and negative control mimics were purchased from RiboBio (Guangzhou City, China). The sequences used for each miRNA are described below: miR-199b mimic, CCCAGUGUUUAGACUAUCUGUUC; miR-152 mimic, UCAGUGCAUGACAGAACUUGG; miR-200b mimic, UAAUACUGCCUGGUAAUGAUGA; miR-103a mimic, AGCAGCAUUGUACAGGGCUAUGA; mimic-Ctrl, AGUGCAUGUUAUGCCUACG.
Prediction of miRNA targets, GO, and pathway enrichment analysis
Candidate target genes of indicated miRNAs were predicted using two different online databases, including TargetScan (Agarwal et al., 2015) and StarBase (Li et al., 2014). Candidate miRNA target genes, which were repeatedly predicted by both databases, were retained for further functional enrichment analysis. We used Database for Annotation, Visualization, and Integrated Discovery (DAVID) (Huang da et al., 2009) to perform Gene Ontology (GO) enrichment analysis and Kyoto Encyclopedia of Genes and Genomes (KEGG) analysis on the hypomethylation/high expression putative target genes.
Gene set enrichment analysis
Gene set enrichment analysis (GSEA) with miRNA target gene sets was carried out by GSEA software (version 4.0) (Subramanian et al., 2005) with Molecular Signature Database (MSigDB) HALLMARK collection. A weighted enrichment statistic was used. Phenotype permutations were performed on samples with a permutation number of 1000, and terms with false discovery rate (FDR) <0.1 were considered to be significantly enriched.
Inference of infiltrating immune cells
The relative proportions of 22 types of infiltrating immune cells were inferred by using CIBERSORT (
Statistical analyses
The χ 2 test was used to compare the correlations of continuous and categorical variables between the patients received with and without chemotherapy. Univariate proportional hazards regression analyses were used to determine the independent prognostic variables for overall survival (OS). To perform survival analysis, the Kaplan–Meier method and log-rank test was used to generate and compare survival curves. The time-dependent ROC curve was carried out to assess the predictive accuracy and sensitivity of each variable and the four-miRNA signature. The activity of pathway was inferred by single-sample gene set variation analysis (GSVA) (Hanzelmann et al., 2013). A threshold of p < 0.05 was determined as statistically significant. R version 3.4.4 was applied to the statistical analyses.
Data availability statement
The data that support the findings of this study are available from TCGA. Restrictions apply to the availability of these data, which were used under license for this study. Data are available at
Results
Clinical significance of chemotherapy in GC patients
A total of 384 GC patients was included in the TCGA GC cohort. Among the 384 GC patients, 48.7% (187/384) had received adjuvant chemotherapy (GC-ACT), while 50.5% (194/384) did not receive any types of chemotherapy (GC-NOACT), (Fig. 1A). Clinical and pathological characteristics of these patients are summarized in the Supplementary Table S1. Patients were well balanced for gender (p > 0.05). Also, no statistically significant difference was observed according to primary lymph node, pathologic T, N, and M stages, and histologic grade. Adjuvant chemotherapy administration for each type of drugs was summarized as shown in Figure 1A. The most used chemotherapy drug for GC patients is Fluorouracil (61/187, 32.6%). Almost half of the GCs who received chemotherapy benefitted from it (Fig. 1B). Of note, 45.5% GCs exhibited complete response (CR) to adjuvant chemotherapy (Fig. 1B). Kaplan–Meier survival curves showed that the hazard ratio (HR) for OS among those who did not receive adjuvant chemotherapy was 2.14 (95% confidence interval [CI] = 1.32–3.49, p = 0.0022; Fig. 1C). Taken together, these results indicated that the adjuvant chemotherapy is an actionable treatment strategy for GC patients.
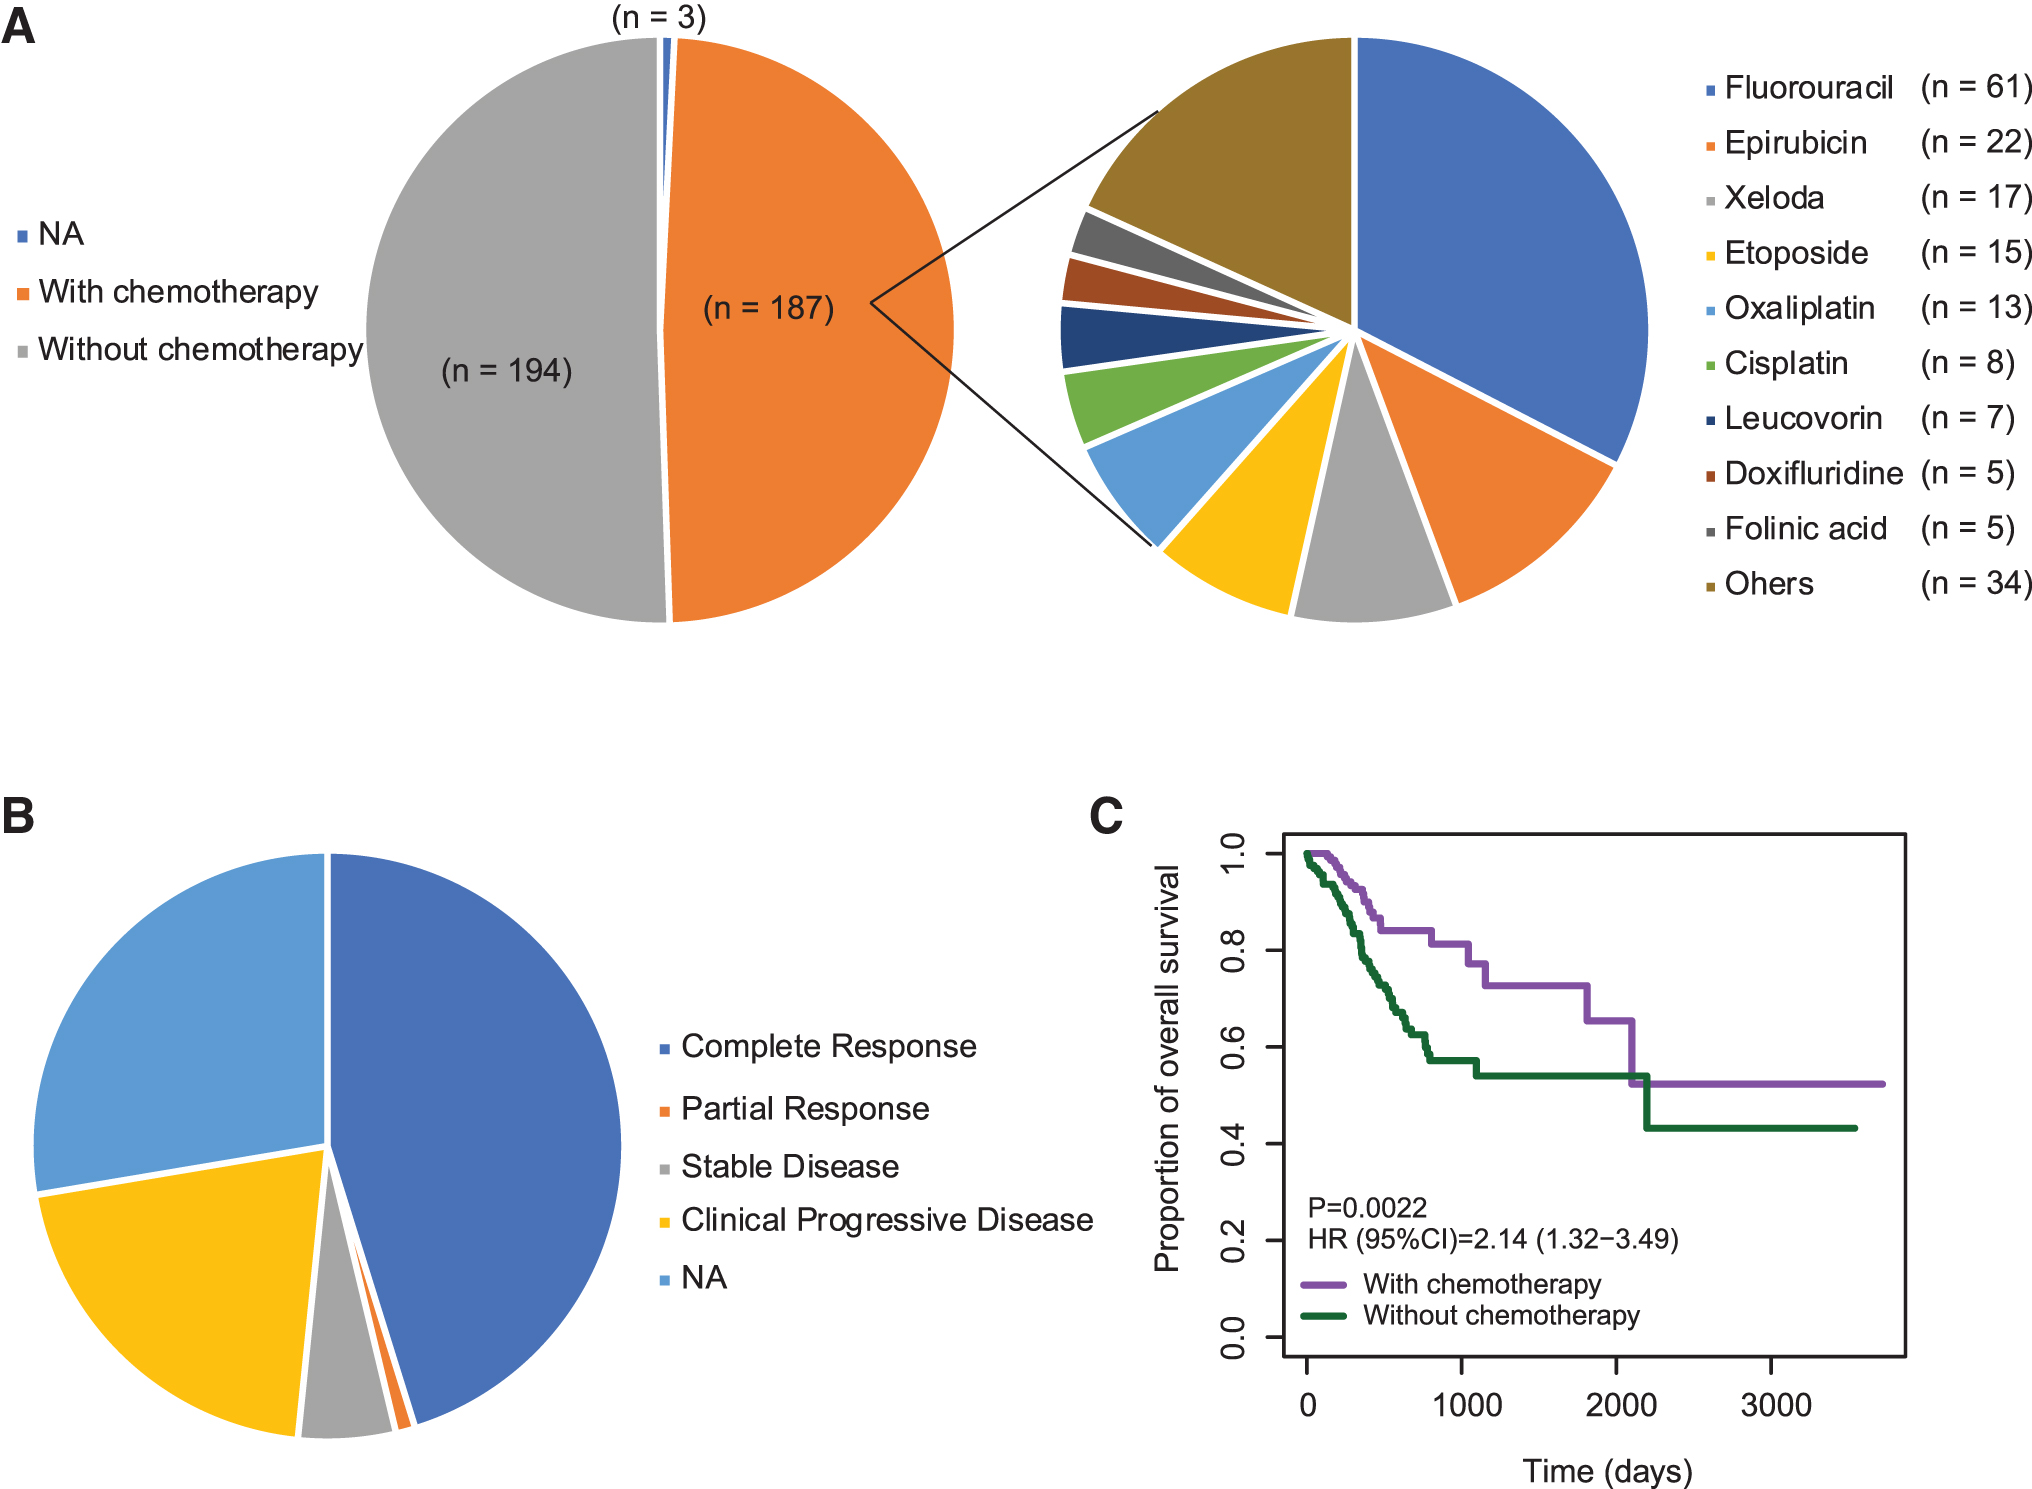
Adjuvant chemotherapy administration in GCs.
Identification of specific prognostic biomarkers in GC patients undergoing chemotherapy
Given the marked effect of chemotherapy for GC patients, we thus wondered whether there are prognostic biomarkers for GCs in those who received adjuvant chemotherapy. As a type of widely used biomarker, miRNAs exhibited good performance for cancer diagnosis and prognosis. We obtained the miRNA expression data from the TCGA GC cohort. After quality control, a total of 544 miRNAs were subjected for further analyses. To explore prognosis-associated miRNAs specific for GC patients who received chemotherapy OS, but not for GC patients who did not receive chemotherapy, we conducted Cox proportional hazards regression analysis for each miRNA in GC-ACT and GC-NOACT patients, respectively. miRNAs (n = 63) in those with p < 0.05 in GC-ACT and p > 0.05 in GC-NOACT remained.
Then, the LASSO Cox regression analysis was conducted on 63 candidates to identify robust markers. By forcing the sum of the absolute value of the regression coefficients under a fixed value, certain coefficients were shrunk to exactly zero, and the most powerful prognostic markers were identified with relative regression coefficients. Crossvalidation was applied to prevent the overfitting of the LASSO Cox model (Fig. 2A, B). Four miRNAs were finally identified as independent prognostic biomarkers for GC-ACT. These four miRNAs included miR-199b, miR-152, miR-200b, and miR-103a.

Identification of prognosis-related miRNAs using LASSO regression model.
Prognostic value of a four-miRNA signature risk score in GC undergoing chemotherapy
To assess the prognostic value of miR-199b, miR-152, miR-200b, and miR-103a, we constructed a prognostic signature by integrating the expression of these four miRNAs using the regression coefficients. The risk score formula was as following: risk score = (5.064341e-05 × ExpmiR-199b) + (4.946951e-04 × ExpmiR-152) + (−2.764529e-05 × ExpmiR-200b) + (−4.906671e-05 × ExpmiR-103a). We calculated the risk scores of GC-ACT patients and GC-NOACT patients using the above formula, respectively. The ranked risk scores of patients in each sample set are shown in Figure 2C and D. We found that the risk scores and the miRNA expression were similar in both the GC-ACT and GC-NOACT patients, suggesting that the miRNA-signature exists before treatment and is not a consequence of chemotherapy. Among the four miRNAs, miR-199b and miR-152 received a positive coefficient and acted as risk factors. The other two miRNAs with negative coefficients, including miR-200b and miR-103a, acted as protective factors.
To confirm the specific prognostic value of these four miRNAs for GC patients who received adjuvant chemotherapy, we examined the association of each miRNA with OS in GC-ACT and GC-NOACT patients, respectively. As expected, Kaplan–Meier survival curves showed that high expression levels of miR-199b and miR-152 were associated with poor survival of GC-ACT patients, whereas high expression levels of miR-200b and miR-103a were associated with better survival of GC-ACT patients (Fig. 2E). On the contrary, none of them displayed prognostic value for GC-NOACT patients (Fig. 2F).
We further assessed the prognostic value of the four-miRNA signature risk model. GC-ACT and GC-NOACT patients were classified into a high-risk or a low-risk group based on the median risk score, respectively. Kaplan–Meier analyses showed that the high-risk group had a significantly poorer OS compared with the low-risk group in GC-ACT patients (Fig. 3A). We used time-dependent ROC analysis to assess the prognostic significance of four-miRNA signature risk score. The areas under the ROC curve (AUC) for 1-, 3-, and 5-year OS of GC-ACT patients were 0.777, 0.827, and 0.865, respectively, indicating a favorable prognostic value in predicting chemotherapy outcomes (Fig. 3A). However, Kaplan–Meier analysis of the four-miRNA signature in GC-NOACT showed no significant association between the risk score and the OS of GC-NOACT patients (Fig. 3B). Consistently, the AUCs for 1-, 3-, and 5-year OS of GC-NOACT patients were 0.501, 0.595, and 0.595, respectively, suggesting its low performance in GC-NOACT patients (Fig. 3B).
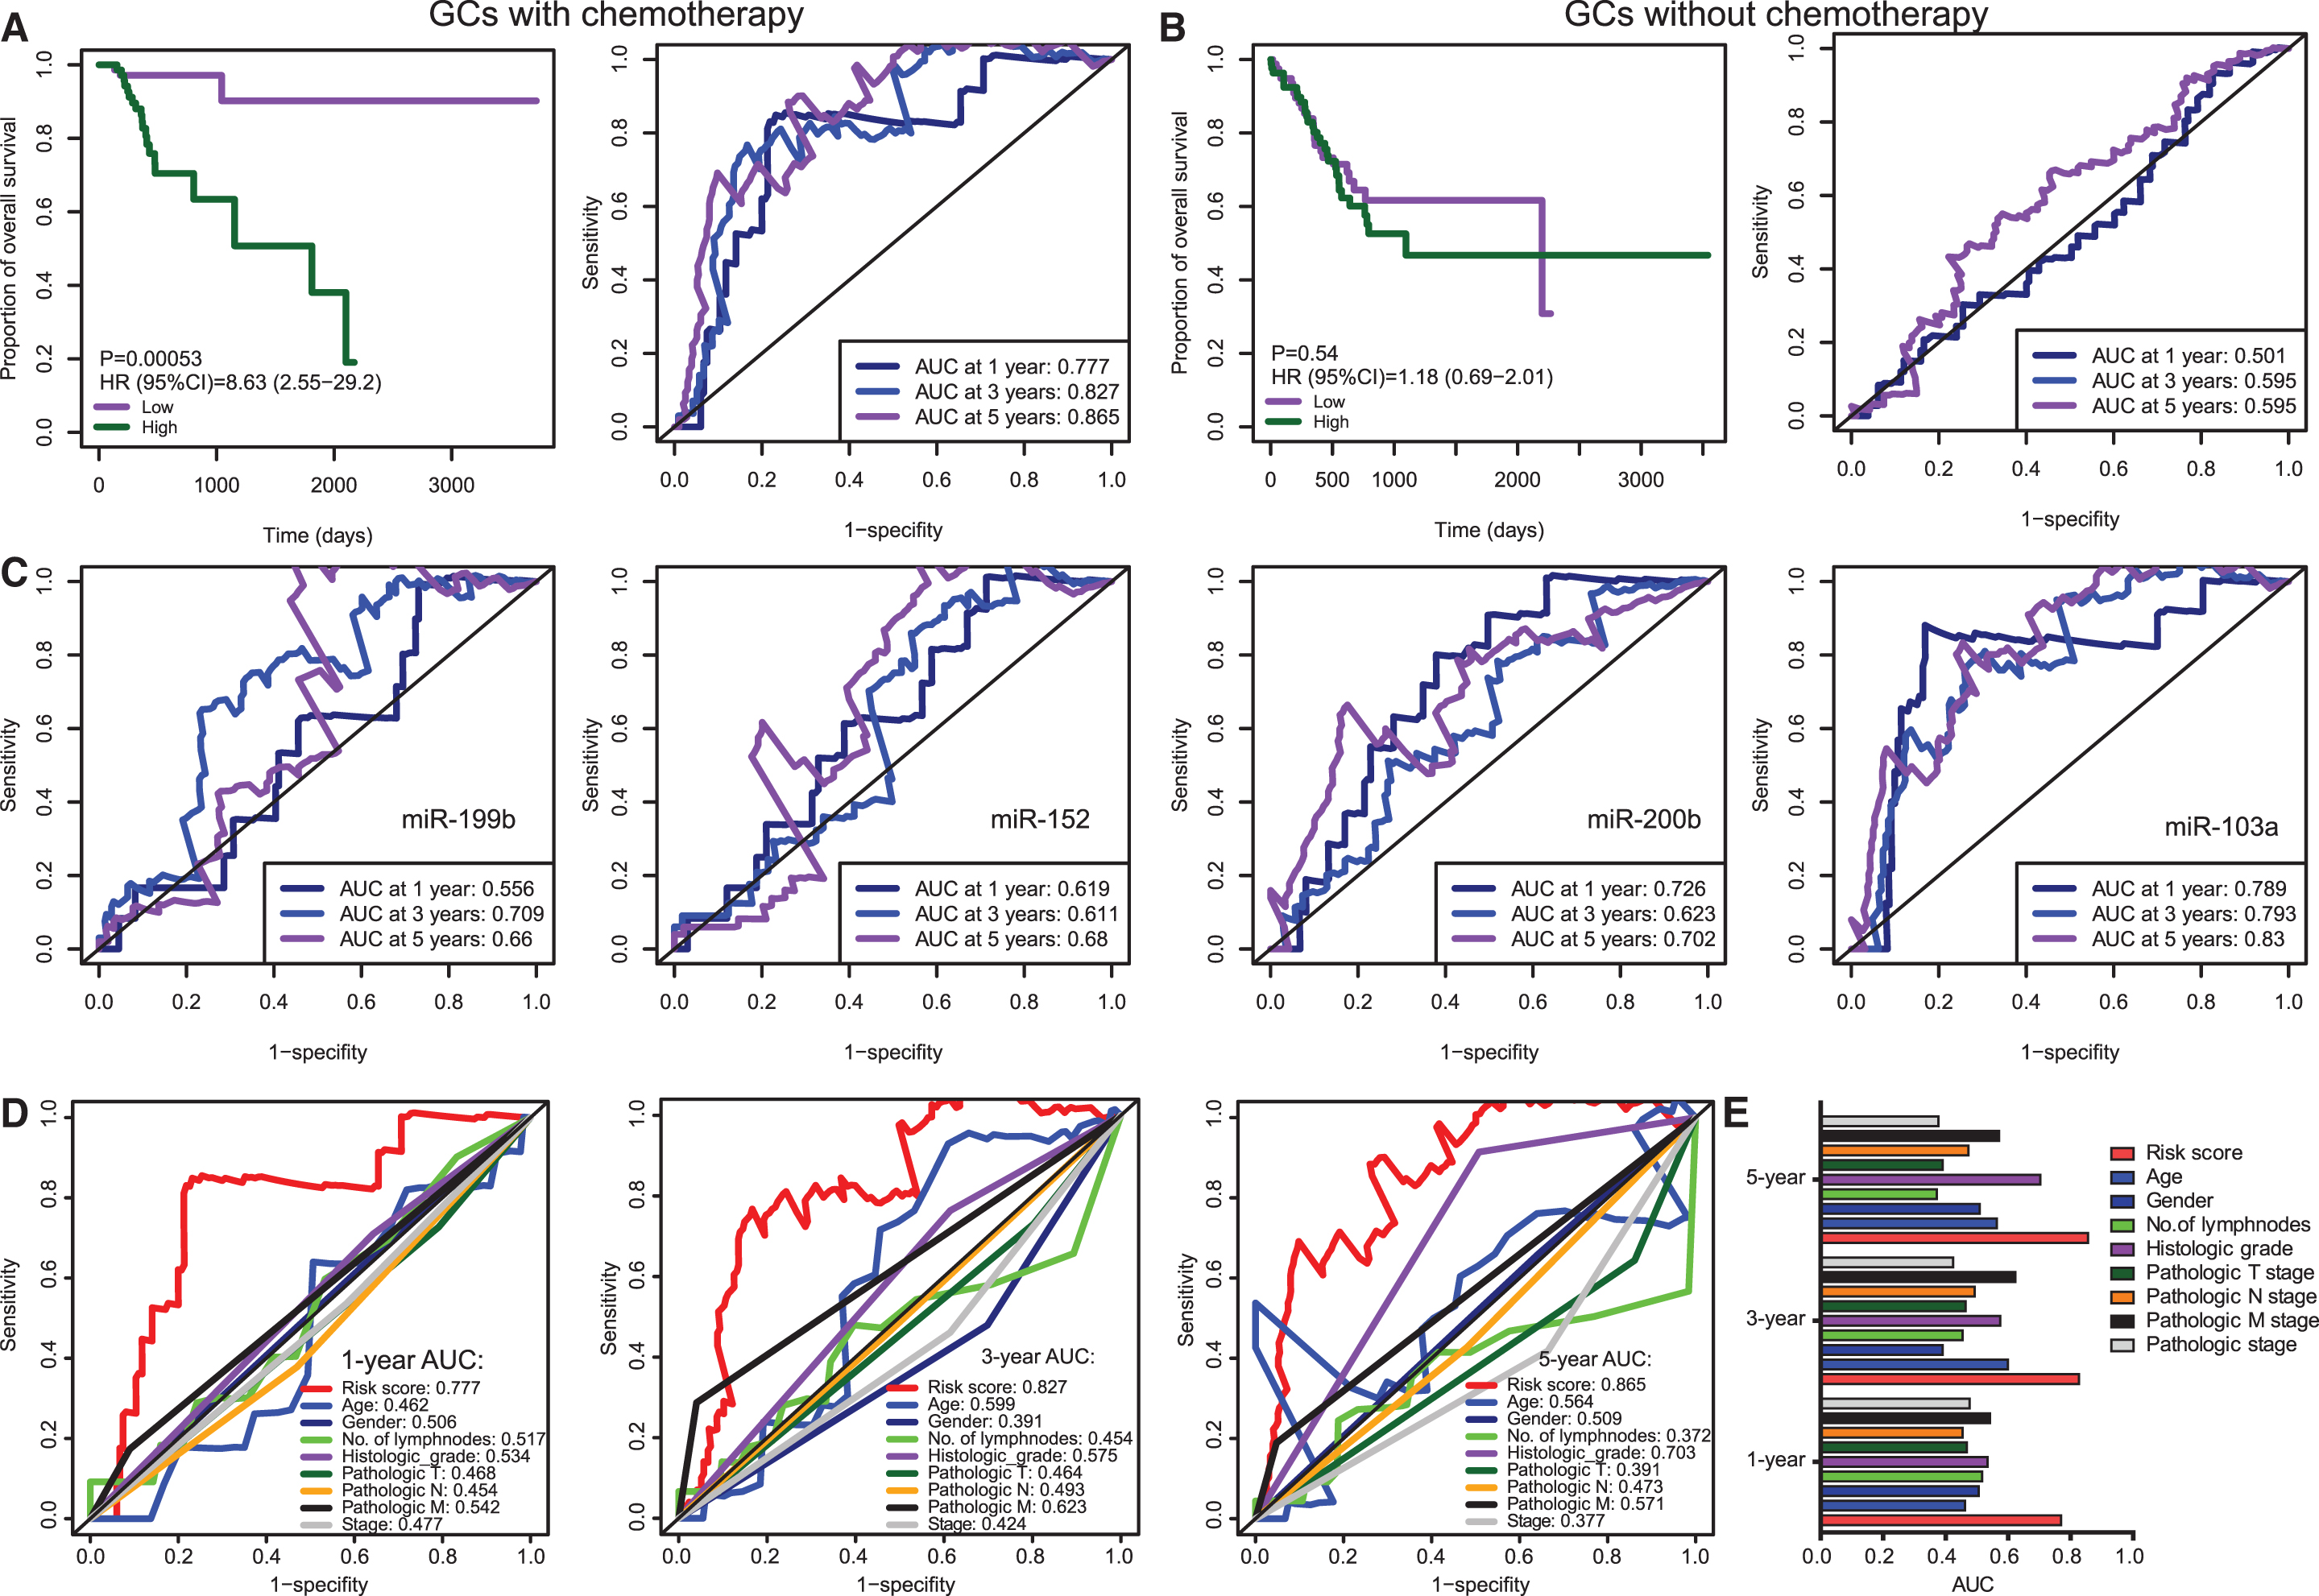
Survival analysis and time-dependent ROC curves for the miRNA-based prognostic signature in GCs with or without chemotherapy.
We further conducted time-dependent ROC analyses based on the expression levels of each individual miRNA. We found that the combined four-miRNA signature exhibited comparable performance as miR-103a alone and marked higher performance than the other three miRNAs (Fig. 3C). Notably, miR-103a alone had a slightly greater AUC than the four-miRNA combined signature for 1-year survival prediction, suggesting its great value for short-term survival prediction. This analysis also suggests that the two protective miRNAs (miR-200b & 103a) are greater predictors than the two risk miRNAs (miR-199b & 152). Taken together, these results indicated that the four-miRNA signature may thus be useful as biomarkers for prediction of chemotherapy response in GCs.
We next compared the prognostic value of miRNA-based predictor and other clinical variables for chemotherapy outcomes of GC patients. The clinical variables used for comparation include age; gender; number of lymph nodes; histologic grade; individual pathologic T, N, and M stages; and the combined pathologic stage. The result showed that the four-miRNA signature risk score outperformed all the clinical variables, especially for short-term (1- and 3-year survival) survival prediction (Fig. 3C, D). There is no clinical variable exhibiting an AUC greater than 0.7 for 1- and 3-year survival prediction (Fig. 3C, D). The most predictive variable is the pathologic M stage for 3-year survival prediction (AUC = 0.623). For long-term survival prediction, the histologic grade showed a relatively greater performance with an AUC of 0.703 (Fig. 3E). Taken together, the time-dependent ROC analyses revealed that all the predictors, either miRNA-based signature or other clinical variables, present better performance for long-term survival prediction than that for short-term survival prediction (Fig. 3F). Of note, the four-miRNA signature outperformed other clinical variables.
Functional roles of signature miRNAs in regulation of chemotherapy response
To explore the functional role of these signature miRNAs in regulation of chemotherapy response in GC cells, we first examined the four-miRNA signature risk score in GC-ACT patients according to the clinical response. In agreement with the Kaplan–Meier survival analysis result, GC-ACT patients who benefit from adjuvant chemotherapy (CR and PR) have lower risk scores than GC-ACT patients with no response after chemotherapy (Fig. 4A). Then, the expression levels of these four signature miRNAs were examined in GC cell lines. Analysis of qRT-PCR demonstrated that, as compared with noncarcinoma CES-1 cells, miR-199b and miR-152 expressions were significantly upregulated in GC cell lines of MKN45, MKN28, SNU16, SNU5, SNU1, HGC27, and AGS cells (Fig. 4B). Conversely, miR-200b and miR-103a expressions were significantly downregulated in GC cell lines compared with GES-1 cells (Fig. 4B). We then assessed the responses of these GC cells to 5-Fluorouracil treatment under different concentrations. The result showed that the cell lines with higher expression of miR-199b/miR-152 (while lower expression of miR-200b/miR-103a) exhibited more resistance to fluorouracil than the other cell lines (Fig. 4C).

The functional roles of signature miRNAs in modulation of chemoresistance in GC cells.
Next, we assessed the effects of overexpression of these signature miRNAs on the regulation of GC cell chemosensitivity to Fluorouracil. MKN28 cells, with low levels of endogenous miR-199b and miR-152, were transfected with miR-199b mimics or miR-152 mimics under the treatment with various concentrations of 5-Fluorouracil for 24 h. MTT assays showed that overexpression of miR-199b or miR-152 significantly increased the chemoresistance of MKN28 cells to 5-Fluorouracil (Fig. 4D). We additionally performed MTT assays in MKN28 cells under cotransfection of miR-199b and miR-152 mimics, and observed that cotransfection of miR-199b and miR-152 mimics also led to an enhanced resistance to 5-Fluorouracil (Fig. 4D). On the contrary, overexpression of miR-200b and miR-103a in AGS cells, with low levels of endogenous miR-200b and miR-103a, dramatically sensitized AGS cells to 5-Fluorouracil (Fig. 4D). Cotransfection of miR-200b and miR-103a similarly resulted in marked survival inhibitory effects on AGS cells (Fig. 4D). These observations are consistent with the prognostic role of each miRNA for GC-ACT patients: miR-199b or miR-152 as risk factors while miR-200b and miR-103a as protective factors. Taken together, our results indicated that these signature miRNAs may play pivotal roles in the modulation of chemotherapy efficiency.
Construction of a nomogram to predict outcomes in GC patients undergoing chemotherapy
To provide a clinically associated quantitative method that could be used to predict the probabilities of 1-, 3-, 5-, and 10-year OS in GC patients who received adjuvant chemotherapy, a prognostic nomogram was established in which the score integrated the clinical variables, including age; gender; number of lymph nodes; histologic grade; individual pathologic T, N, and M stages; and the combined pathologic stage and the four-miRNA signature (Fig. 5A). The calibration curves for the nomogram for OS of GC patients who received adjuvant chemotherapy showed good agreement between the prediction and the actual observation (Fig. 5B). Compared with the clinical variables, the four-miRNA signature and the nomogram showed relatively high predictive power for OS of GC patients who received adjuvant chemotherapy, with an average AUC above 0.844 and 0.832, respectively (Fig. 5B).
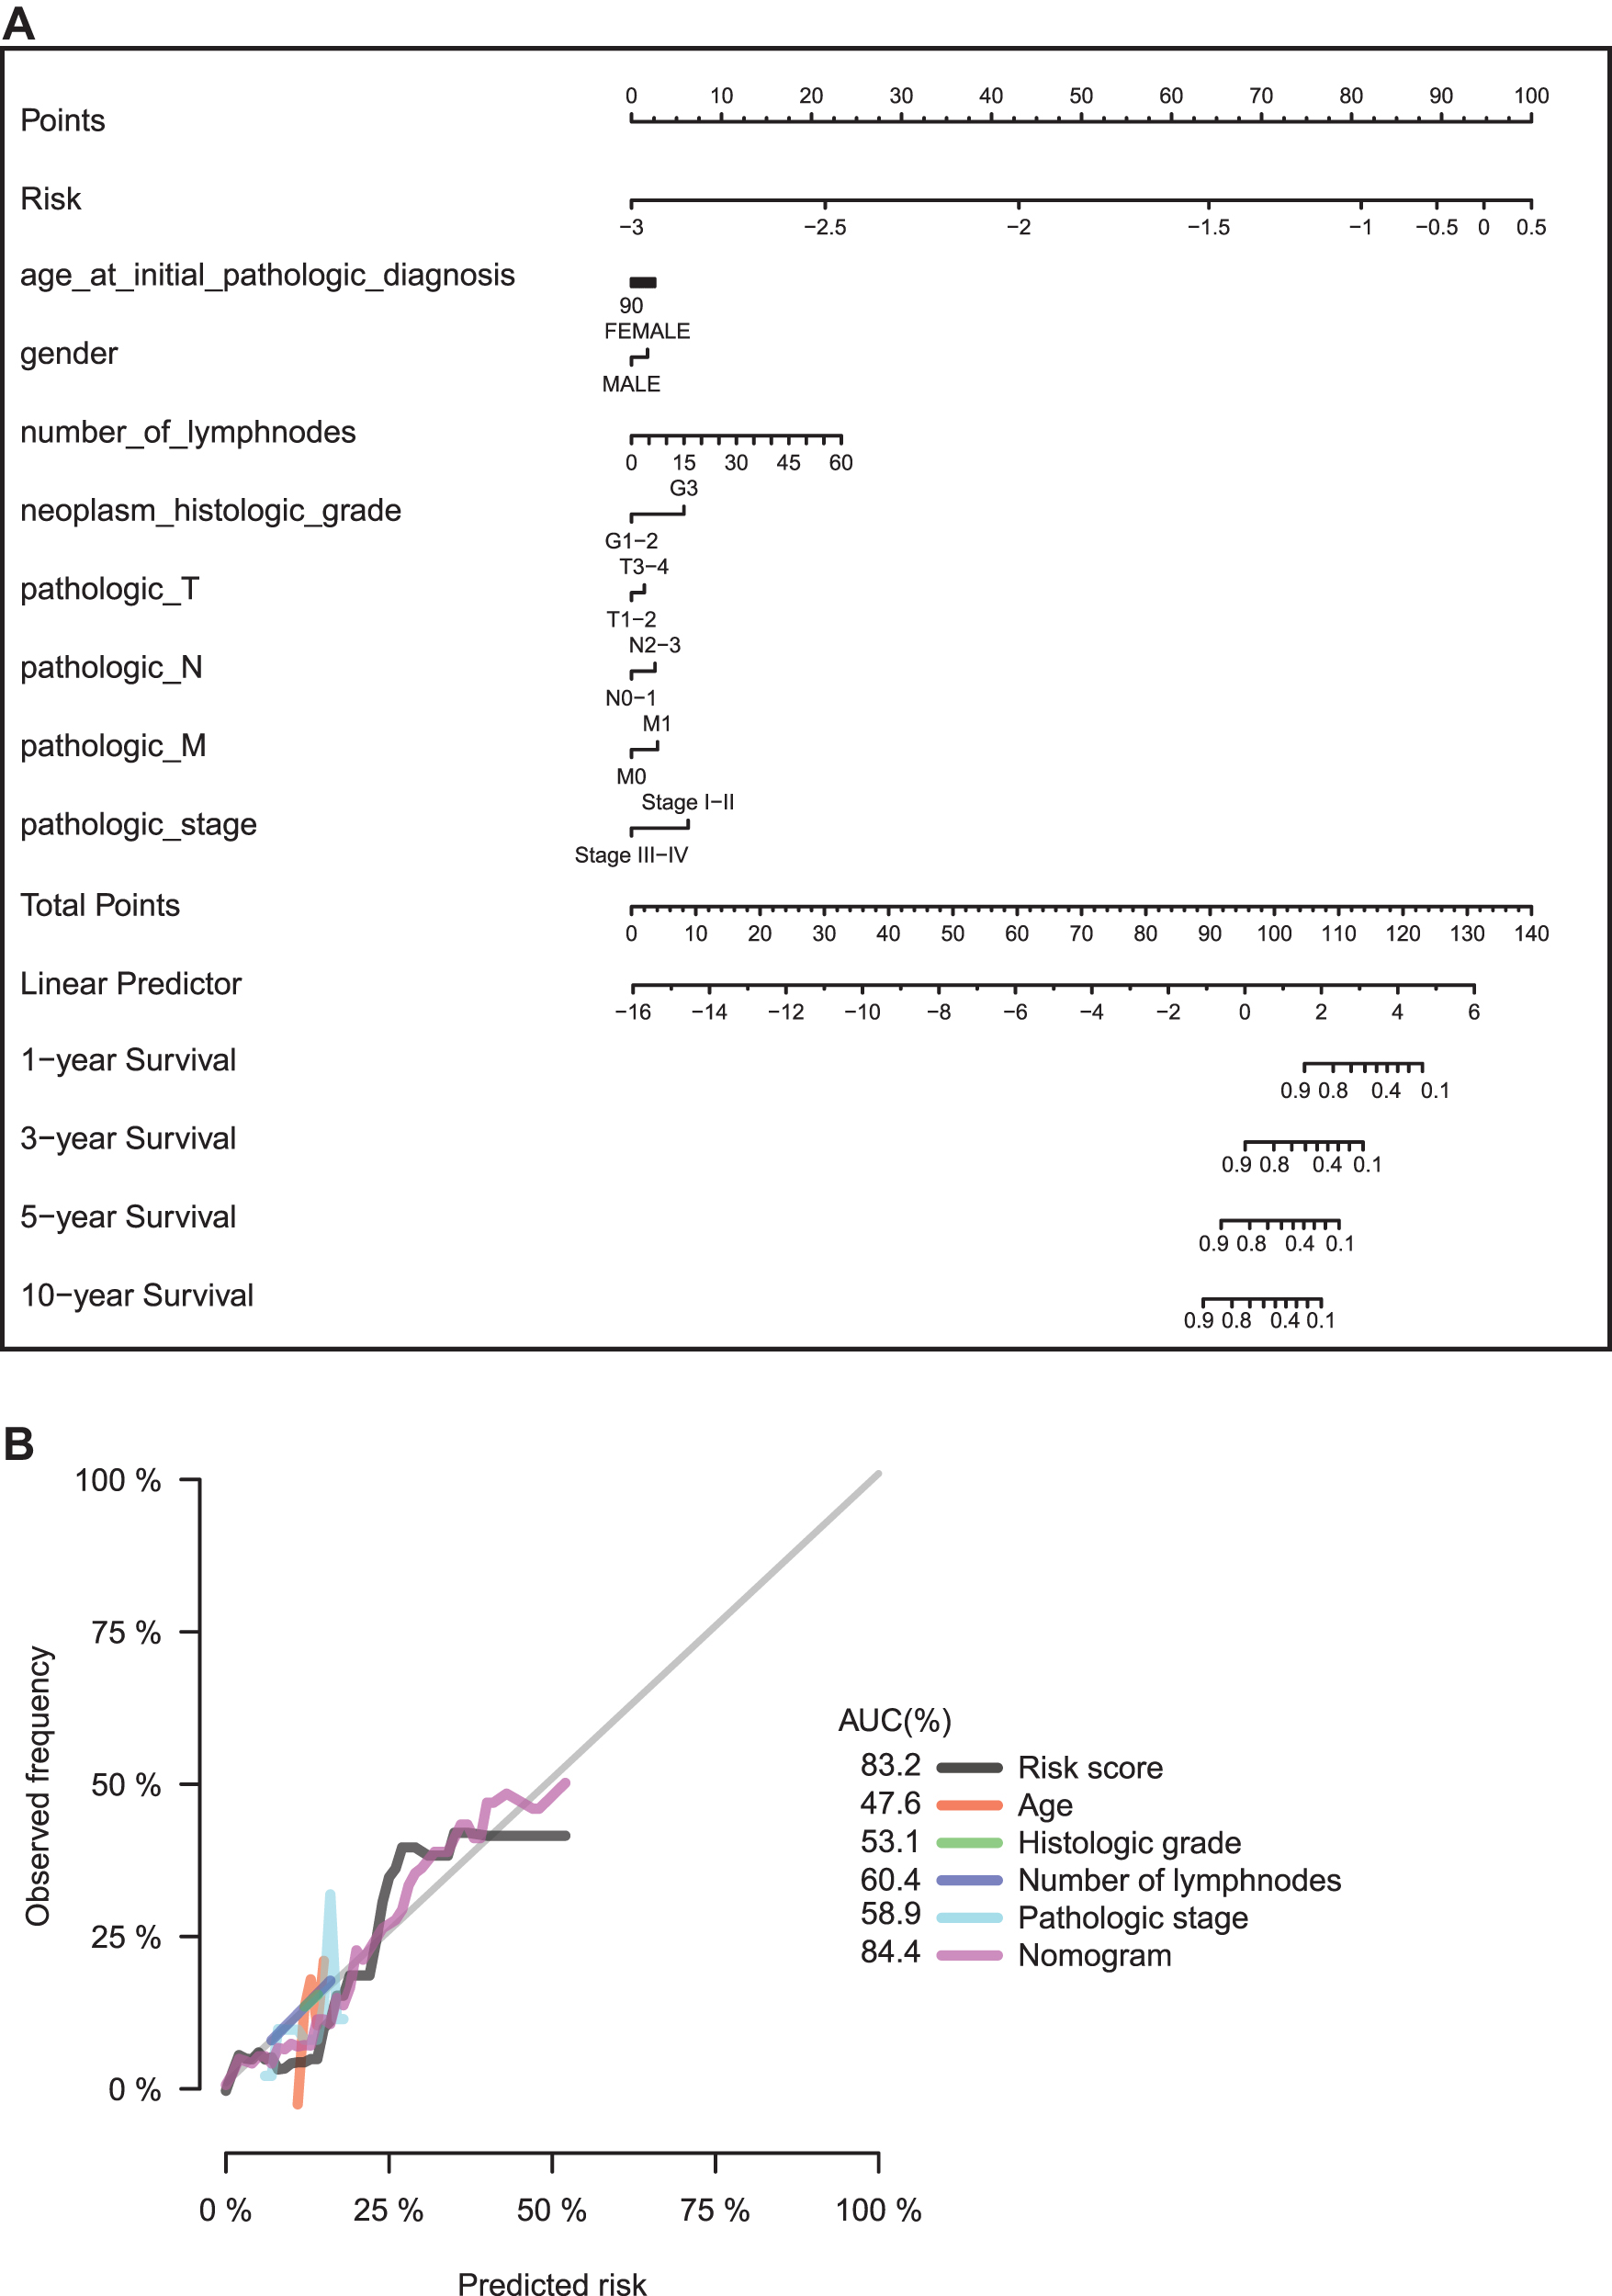
Establishment of the nomogram for GC patients undergoing adjuvant chemotherapy.
Functional involvement of the risk signature miRNAs
To evaluate the potential function of the four signature miRNAs, we inferred the activity of HALLMARK and KEGG pathways by GSVA method on the basis of single sample expression data (Hanzelmann et al., 2013). By examining the correlation between the expression levels of risk signature miRNAs and the activity of each pathway documented by these two databases, we found that mir-199b and miR-152 showed similar pattern, which is in contrast to the pattern in mir-200b and mir-103a-1. Briefly, high levels of mir-199b and miR-152 are negatively correlated with the cell cycle checkpoint, DNA damage response, and RNA processing, and positively associated with myogenesis, epithelial/mesenchymal transition (EMT), MAPK, and JAKA-STAT singling (Fig. 6A, B). Conversely, mir-200b and mir-103a-1 exhibited opposite associations (Fig. 6A, B). Notably, no obvious difference of correlations was observed between GC patients with adjuvant chemotherapy and those without adjuvant chemotherapy (Fig. 6A, B).
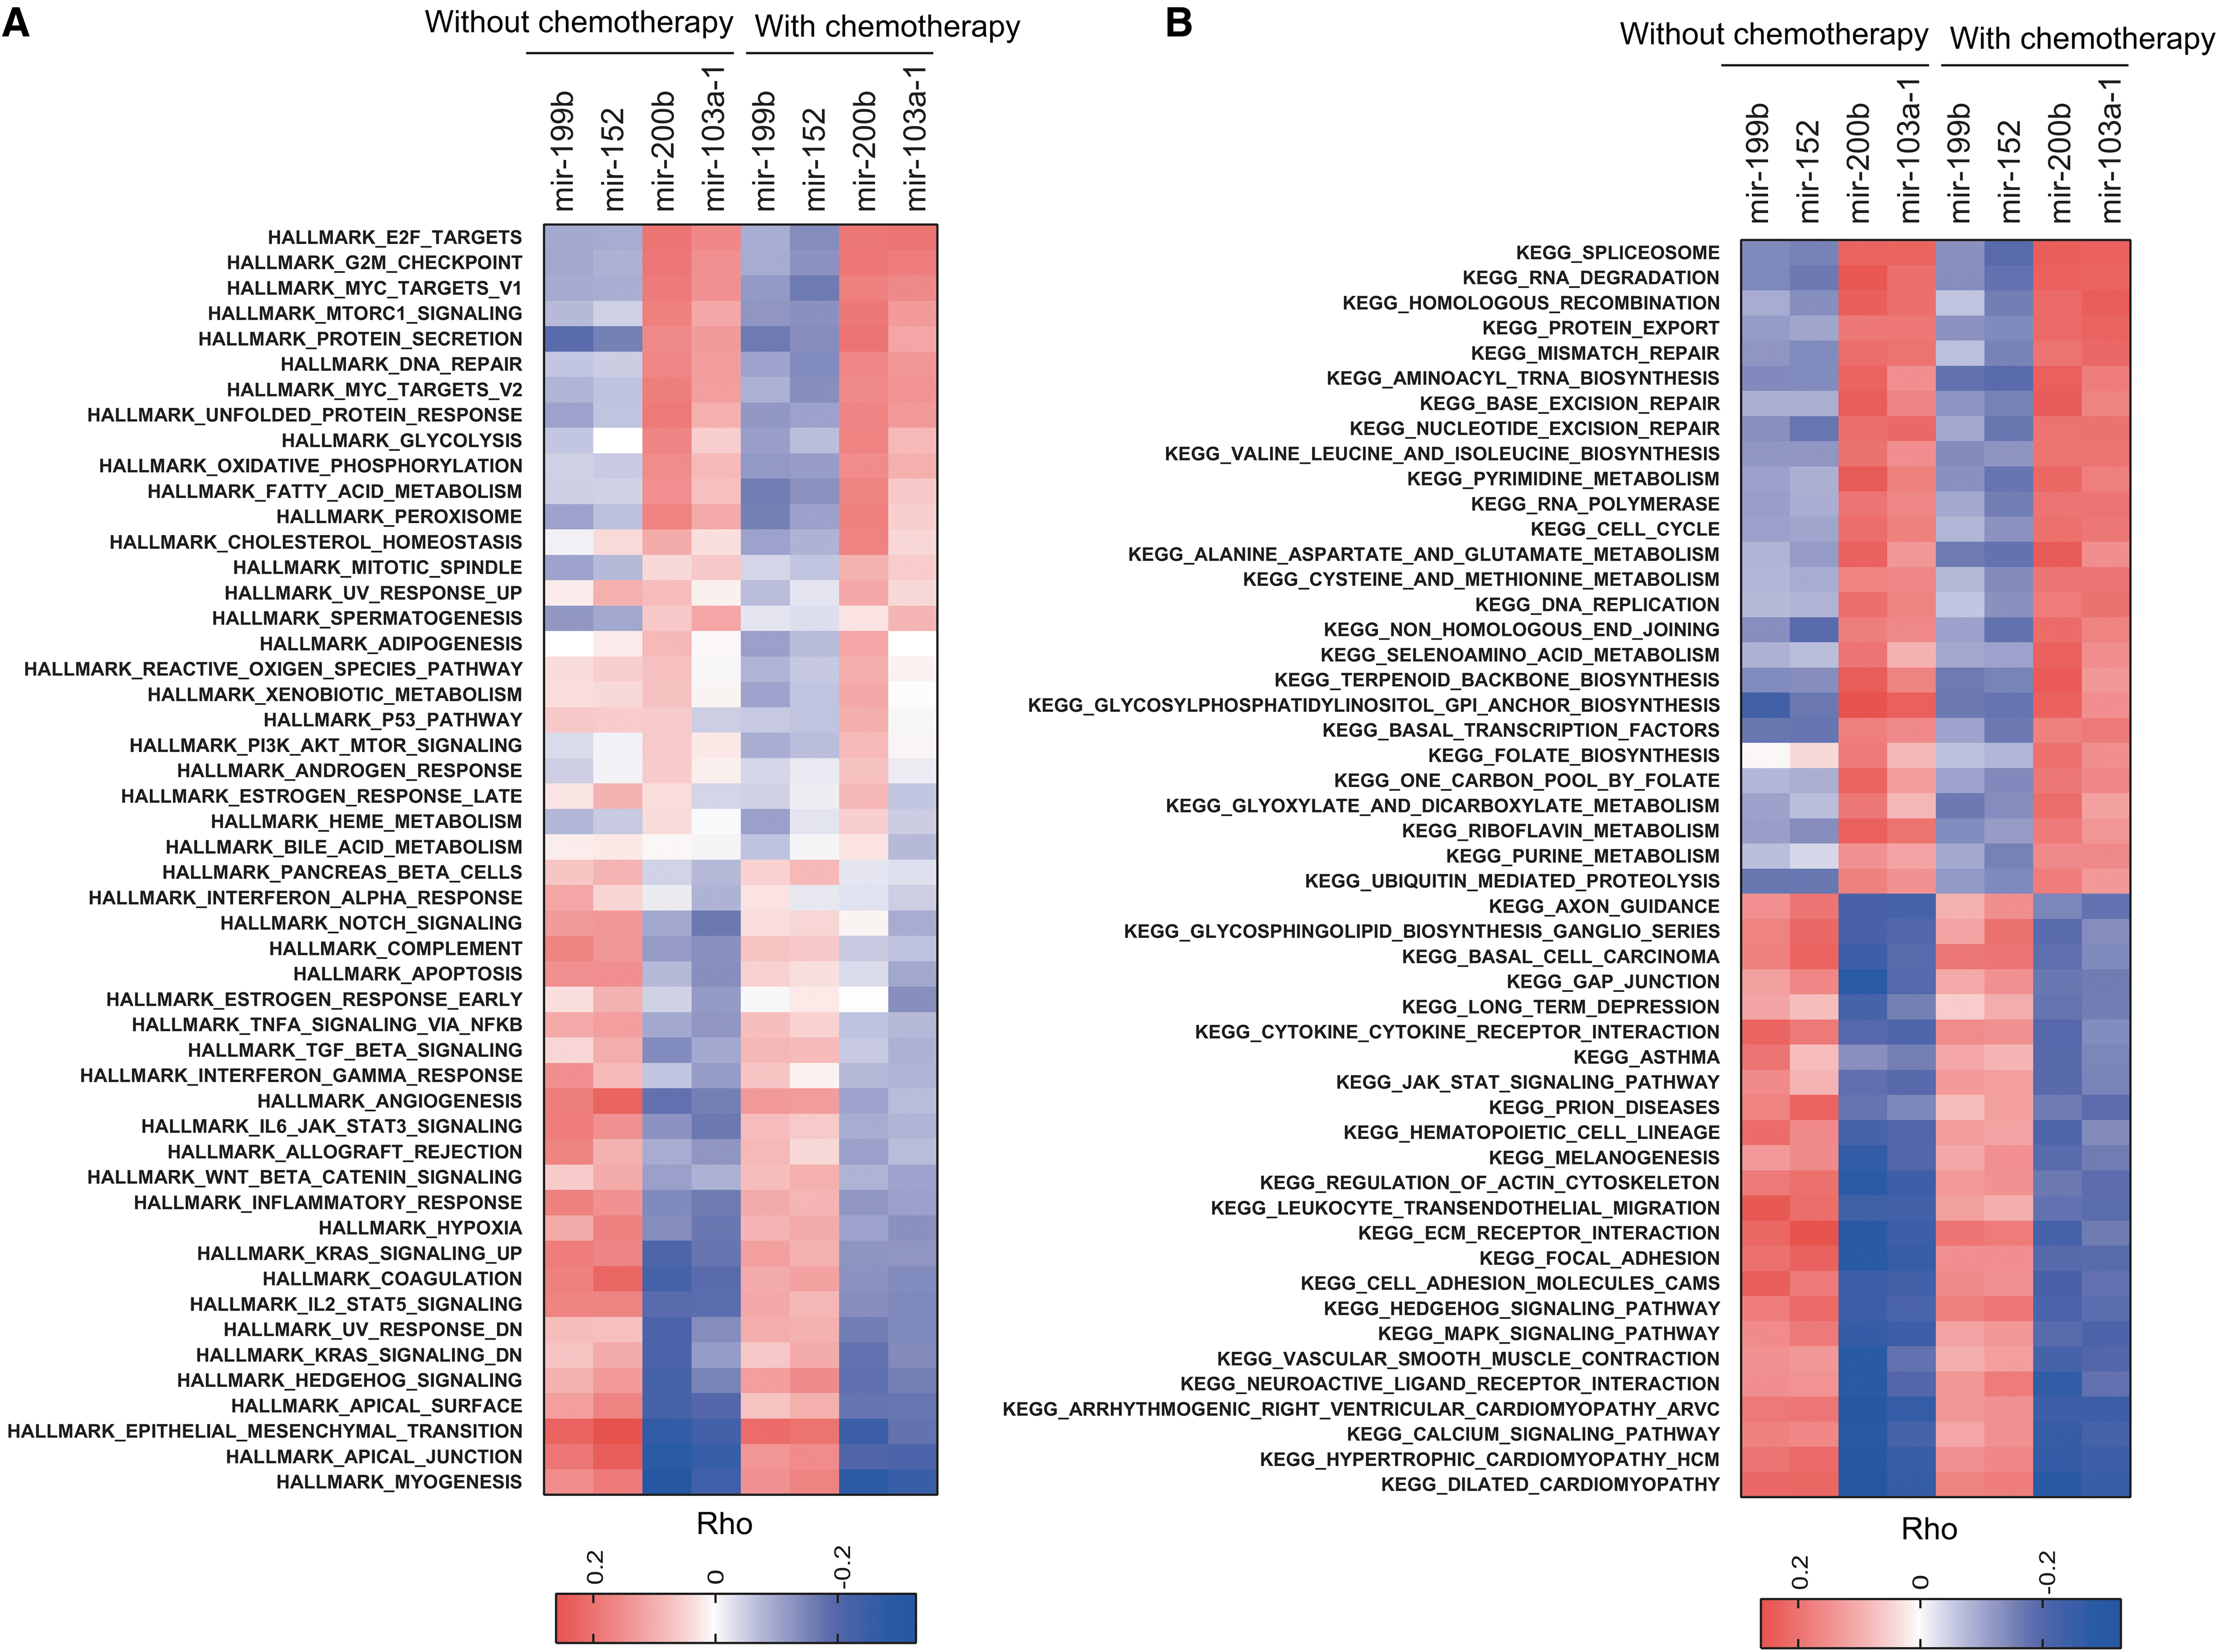
Functional enrichment analyses of the signature miRNA and the miRNA-based signature.
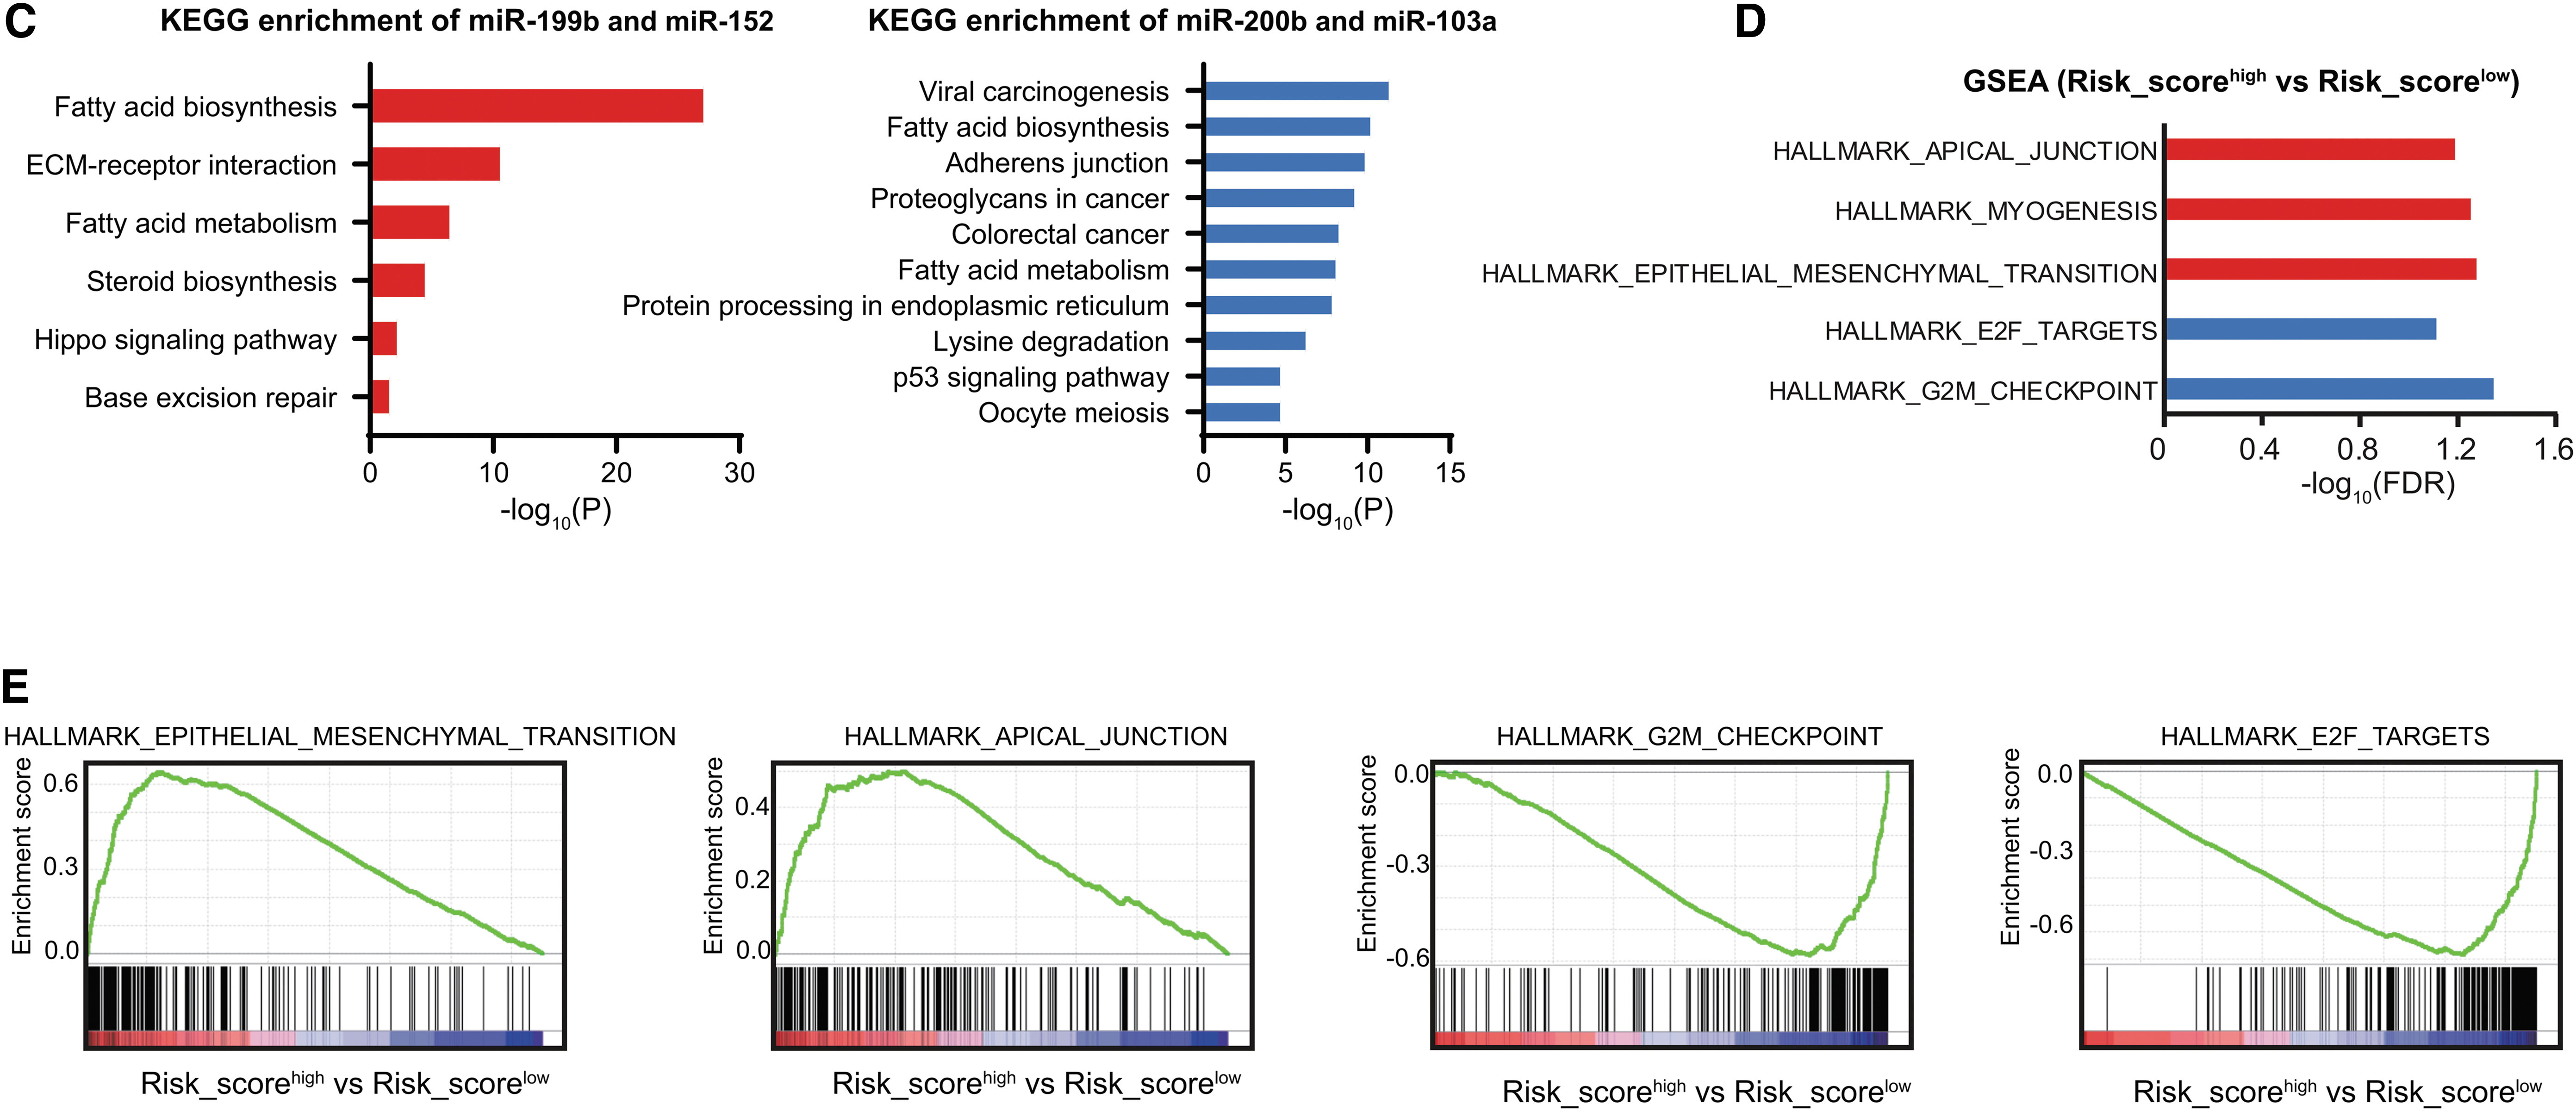
To investigate the functional involvement of the targets of risk signature miRNAs, we then predicted the putative targets separately for “miR-200b & miR-103a” and “miR-199b & miR-152” using TargetScan and Starbase database, respectively. KEGG pathway analysis revealed that the target genes of miR-200b & miR-103a were mainly enriched with metabolism (such as fatty acid biosynthesis and metabolism and steroid biosynthesis), ECM/receptor interaction, Hippo signaling pathway, and DNA damage response (base excision repair) (Fig. 6C and Supplementary Table S2). The target genes of miR-199b & miR-152 were mainly related with metabolism (such as fatty acid biosynthesis and metabolism and lysine degradation), carcinogenesis, adherens junction, p53 singling pathway, and protein processing in endoplasmic reticulum (Fig. 6C and Supplementary Table S2).
Furthermore, to investigate the functional involvement of the four-miRNA risk score, we performed gene set enrichment analysis (GSEA) in the gene expression data from the TCGA GC-ACT patients (Fig. 6D
Aberration of immune cell infiltration correlates with chemotherapy response
miRNAs have been identified as pivotal modulators in regulation of the development and the function of immune subpopulations involved in tumor immune response. Thus, to assess the contribution of miRNAs to immune infiltration in GC, we investigated the correlation between the expression levels of risk miRNAs and immune cell infiltration in GCs. The relative proportions of 22 types of infiltrating immune cells were inferred by using CIBERSORT (
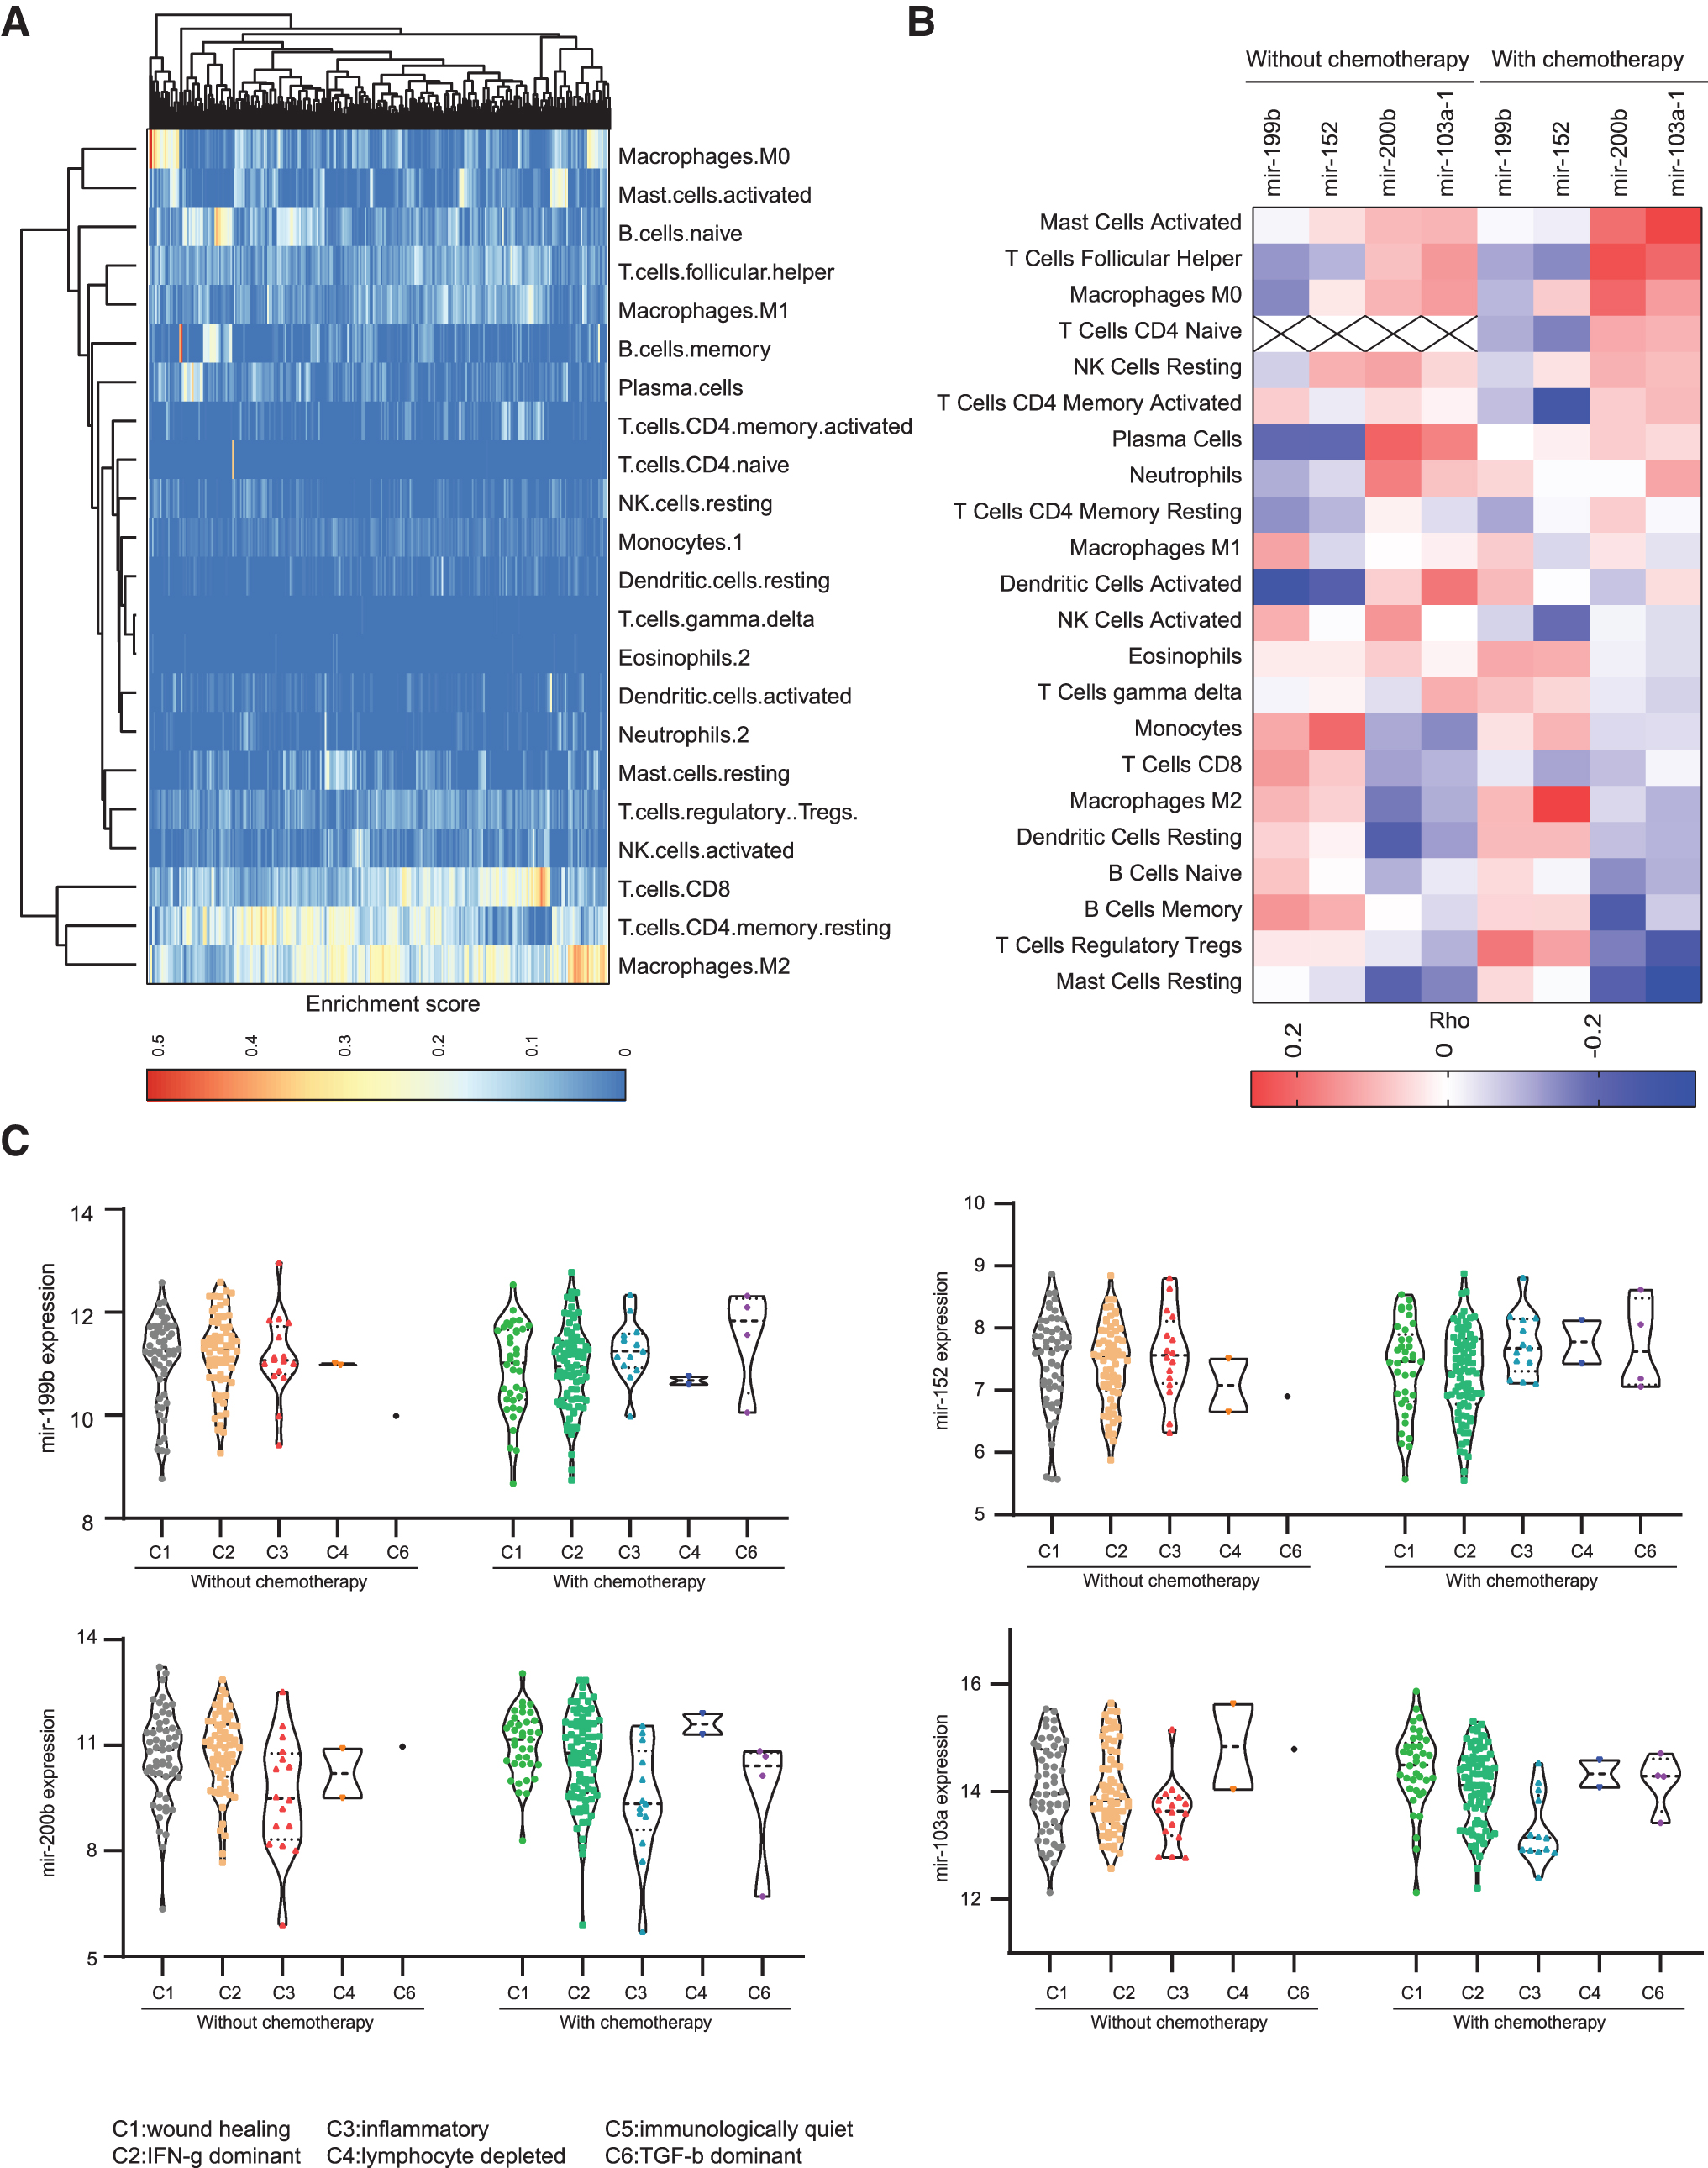
Risk signature miRNAs/immune cell associations in GCs.
The miRNA-immune infiltration correlation analyses exhibited that mir-199b and miR-152 showed an opposite pattern to mir-200b and mir-103a-1 (Fig. 7B). mir-199b and miR-152 with risk effects exhibited negative correlations with the infiltration of T follicular helper (Tfh) cells, plasma cells, and activated DCs, and positive correlations with the infiltration of monocytes, memory B cells, and M2 macrophages (Fig. 7B). On the contrary, mir-200b and mir-103a-1 with protective effects, displayed strong positive correlations with the infiltration of activated mast cells, Tfh cells, M0 macrophages, plasma cells, and activated DCs, whereas marked negative correlations with the infiltration of resting mast cells, regulatory T (Treg) cells, memory B cells, and resting DCs, Fig. 7B). Among the correlates, mast cells exhibited the strongest effects with mir-200b and mir-103a-1 (Fig. 7B). These data suggested that GCs with high risk to adjuvant chemotherapy are characterized with enrichment of resting suppressive immune cells, such as Treg, resting mast cells, and resting DCs, whereas those with GCs who benefitted from the adjuvant chemotherapy are dominated by effector immune cells, such as activated mast cells, Tfhs, plasma cells, and activated DCs.
Furthermore, to further explore the roles of these risk signature miRNAs in immune response, we examined the expression levels of each miRNA in the GCs according to the immune subtypes predicted by a previous study (Thorsson et al., 2018). GC samples were grouped into five immune subtypes: C1-wound healing, C2-IFN-γ dominant, C3-inflammatory, C4-lymphocyte depleted, and C6-TGF-β dominant, characterized by differences in macrophage or lymphocyte signatures, Th1:Th2 cell ratio, extent of intratumoral heterogeneity, aneuploidy, extent of neoantigen load, overall cell proliferation, expression of immunomodulatory genes, and prognosis (Thorsson et al., 2018). Interestingly, GCs in C6-TGF-β dominant subtype have relatively higher expression levels of mir-199b and miR-152 than GCs in the other subtypes (Fig. 7C), especially in GCs with chemotherapy, consistent with the immunosuppressive role of TGF-β signaling in cancers. On the contrary, mir-200b and mir-103a-1 showed relatively higher expression levels in C1-wound healing and C2-IFN-γ dominant subtypes compared with the others, suggesting active immune responses (Fig. 7C). Taken together, these findings indicated that the risk signature miRNAs may act as immune response mediators in the regulation of chemotherapy response.
Discussion
Drug resistance to chemotherapy and molecular targeted therapy is an important problem in current cancer research (Holohan et al., 2013). Chemoresistance refers to the resistance of malignant cells to various chemotherapeutic agents with different molecular mechanisms and structures, which is the cause of recurrence and metastasis in most malignant tumors, including GC. There is an urgent need to accurately identify the malignant status of tumors using novel biomarkers with prognostic significance, which will significantly assist the development of clinical precision medicine and ultimately improve the prognosis of tumor patients. The miRNA expression profile of drug-resistant cancer cells is quite different from the drug-sensitive parental cancer cells (Fojo, 2007). The aims of this study were to identify a miRNA signature as a potential prognostic marker for GC patients who received adjuvant chemotherapy in the clinic.
In this study, we conducted an integrative analysis of whole-genome miRNA expression. Using the multivariate Cox coefficients of LASSO analysis, we developed a four-miRNA-based risk scoring signature for prediction adjuvant chemotherapy response of GC patients, which markedly outperform the clinical variables. Using our miRNA-based model, we also developed the nomogram, a scoring system ranging from 0 to 100 that can predict risk of death after adjuvant chemotherapy. Our findings strongly suggest that both the four-miRNA model and nomogram provide independent values beyond conventional clinical variables.
Among the four signature miRNAs, two of them, including miR-199b and miR-152, acted as risk factors for GCs, and the other two miRNAs (miR-200b and miR-103a) were protective factors. Notably, these miRNAs have specific predictive value for GC-ACT patients, but not GC-NOACT patients. Thus, this type of miRNAs may exert a pivotal role in the modulation of chemotherapy response in GCs. miR-199b expression is upregulated in Wilms' tumor, and miR-199b can directly target RUNX3 to promote Wilms' tumor progression, indicating that the miR-199b/RUNX3 axis represents a potential target for Wilms' tumor treatment (Zhao et al., 2018). miR-199b also serves as an oncogene in osteosarcoma (OS). Upregulated miR-199b is significantly related to OS stage, distant metastasis, and poor prognosis. This miRNA may promote progression of OS (Chen et al., 2018). However, miR-199b has been reported to be underexpressed in several other types of cancer. For example, the expression level of miR-199b is downregulated in hepatocellular carcinoma (HCC). HCC patients with low miR-199b expression levels show lower survival rates than those with high miR-199b expression levels (Wang et al., 2011; Zhou et al., 2017b). In addition, downregulation of miR-199b is widely observed in bladder cancer (Sakaguchi et al., 2017), breast cancer (Fang et al., 2016), colorectal cancer (Shen et al., 2016), acute myeloid leukemia (Favreau et al., 2015), nonsmall-cell lung cancer (Wu et al., 2017) and endometrial carcinoma (Torres et al., 2012). The abovementioned contradictory findings suggest that the expression pattern of miR-199b is tissue specific, and miR-119b may represent a new prognosis-associated biomarker. miR-152 has also been reported to be involved in the progression of multiple cancer types, both as oncogene and tumor suppressor gene. miR-152 is overexpressed in some types of cancer, including liver cancer (Zhou et al., 2017a), ovarian cancer (Zhou et al., 2012), gastrointestinal cancer (Chen et al., 2010a), as well as in lung cancer (Chen et al., 2016). The low plasma level of miR-152 significantly predict the poor survival of squamous cell carcinoma lung cancer patients (Sanfiorenzo et al., 2013). On the other hand, several studies show that miR-152 may play tumor suppressor role in other types of cancers like bladder cancer (Jiang et al., 2015).
miR-200b belongs to the miR-200 family, which is widely known for its antitumor function in a variety of cancers, including breast cancer (Yu et al., 2013), colorectal cancer (Paterson et al., 2013), pancreatic cancer (Soubani et al., 2012), endometrial carcinoma (Bai et al., 2013), and gastric cancer (Tang et al., 2013). miR-200b and miR-200c have been revealed as potential prognostic biomarkers of gastric cancer (Tang et al., 2013). With regard to the fourth miRNA, miR-103, increasing evidences have indicated that it acts as an oncogene in tumor development and progression (Chen et al., 2012; Yu et al., 2012). However, the role of miR-103 in gastric cancer is controversial (Tchernitsa et al., 2010; Li et al., 2011; Liang et al., 2015). Although these miRNAs are known to play important roles in tumorigenesis, most of them have not been reported as prognostic biomarker for GC patients who received adjuvant chemotherapy in the literature. Further researches should focus on the interaction between these miRNAs to help us develop optimal treatment strategy for GC patients undergoing adjuvant chemotherapy. This provides new ideas for the study of chemotherapy response machines in GC.
Importantly, previous studies have found that the expression of plasma miRNA-199 in early GC patients was significantly higher compared with healthy controls and gastric precancerous disease patients (Li et al., 2013). miR-200b was found downregulated in GC patient plasma compared with controls (Treece et al., 2016). Although there is no experiment evidence for the clinical relevance of circulating miR-152 and miR-103a in GC patients, they have been identified as circulating biomarker for other types of cancer, such as prostate cancer (Matin et al., 2018) and colorectal cancer (Zhang et al., 2019). Thus, the clinical relevance of the signature in predicting prognosis with adjuvant chemotherapy for GC patients provides promising candidates for noninvasive plasma biomarker development.
We also performed pathway enrichment analysis of the four signature miRNA target genes to reveal the underlying molecular mechanisms. The mostly enriched pathways were involved in metabolism (such as glycosphingolipid biosynthesis-lacto and neolacto series, tryptophan metabolism, amino sugar, and nucleotide sugar metabolism), axon guidance, and lysosome. It indicated that the four-miRNAs might function as tumor metabolism modulator involved in chemotherapy response of GCs. Glycolipid metabolism and biology, including the glycosphingolipid composition of cell membrane and their transport and communication across the barriers, have provided new perspectives for tumorigenesis and drug resistance research. For instance, the expression levels of glucosylceramide and galactosyl ceramide in doxorubicin-resistant ovarian carcinoma (OC) cells are three times higher than those in doxorubicin-sensitive wild-type OC cells (Veldman et al., 2002). Besides, the expression levels of ganglioside, especially GM3 and GM2, in fenretinide-resistant OC cells are six times higher than those in fenretinide-sensitive OC cells (Prinetti et al., 2003). Both established drug-resistant ovarian adenocarcinoma cell line and tumor samples from chemotherapy-resistant patients show increased glucosylceramide levels (Lucci et al., 1998). Thus, these findings together with our study provide a link between chemotherapy response-associated miRNAs and the glycosphingolipid biosynthesis.
In addition to functional enrichment analysis of signature miRNA target genes, GSEA revealed that the four-miRNA signature-identified high-risk group was positively related to EMT and apical junction, whereas negatively related to cell cycle transition, partly explaining the poor prognosis of GC patients with chemoresistance. Although EMT is widely considered to play a key role in tumor progression and metastasis, two recent studies link EMT to drug resistance in lung cancer and pancreatic cancer, respectively (Fischer et al., 2015; Zheng et al., 2015). It is more and more clear that EMT is a sophisticated biological event regulated by a series of signaling pathways. Whether EMT represents the main cause of drug resistance in GC remains to be further studied.
There are still some limitations to our study. First, in this retrospective study, there is a lack of diverse ethnic groups in our cohort. Second, the predictive value of our four-miRNA model needs to be further validated in a larger prospective cohort. Third, although we conducted in vitro experiments to assess the modulatory roles of those signature miRNAs in chemotherapy response in GC cells, further in-deep functional studies are needed.
In conclusion, the newly identified four-miRNA signature was demonstrated as an effective and stable model to predict the prognosis of GC patients who received adjuvant chemotherapy, which outperformed the clinicopathological features. The clinical application of this four-miRNA signature will contribute to risk classification, thus guiding personalized therapy for GC patients. While systematic experimental verification is lacking, our research provides a basis for the use of miRNA panel as a clinical tool for prognostic assessment after adjuvant chemotherapy and these four miRNAs may also be potential therapeutic targets for the treatment of drug resistance in GC patients.
Footnotes
Disclosure Statement
The author(s) declared no potential conflicts of interest with respect to the research, authorship, and/or publication of this article.
Funding Information
No funding was received for this article.
Supplementary Material
Supplementary Table S1
Supplementary Table S2
Supplementary Table S3
Supplementary Table S4
References
Supplementary Material
Please find the following supplemental material available below.
For Open Access articles published under a Creative Commons License, all supplemental material carries the same license as the article it is associated with.
For non-Open Access articles published, all supplemental material carries a non-exclusive license, and permission requests for re-use of supplemental material or any part of supplemental material shall be sent directly to the copyright owner as specified in the copyright notice associated with the article.
