




Abstract
Human leukocyte antigen (HLA)-E is one of the least polymorphic nonclassical major histocompatibility complex (MHC) I genes; its nucleotide variability can affect immune response. In this study, we assess the correlation between HLA-E polymorphism and leukemia and further study the transcriptional activity of promoter variation at nucleotide position-26. A total of 142 healthy blood donors and 111 leukemia patients were collected. The genomic sequence of HLA-E was amplified by high-fidelity reaction system and identified by Sanger and cloning sequencing. The dual luciferase reporter gene assay was used to detect the transcription activity of promoter variation at nucleotide position-26. In the HLA-E genomic sequence results, a total of 16 alleles and 32 genotypes were detected; the HLA-E*01:01:01:06 allele had a significantly lower frequency in leukemia patients than in healthy participants (p = 0.026 < 0.05). And the HLA-E*01:03:02:01, *01:03:02:01 genotype showed the greatest difference in frequency between the two groups of participants (p = 0.028 < 0.05). Eight HLA-E alleles were first reported worldwide in Chinese individuals. The results of the dual luciferase reporter gene experiment showed that the transcription activity of the mutant-type promoter (HLA-E*01:01:01:06 with “T” allele at nucleotide position-26) was significantly lower compared with the wild-type promoter (HLA-E*01:01:01:01 with “G” allele at nucleotide position-26) (p = 0.0242 < 0.05). HLA-E*01:01:01:06 allele has a protective effect against leukemia through decreasing transcription activity by “T” variation at nucleotide position-26.
Introduction
Human leukocyte antigen (HLA)-E is a member of the nonclassical HLA-I molecules that plays a role in both innate and the adaptive immune response (Sullivan et al., 2008). It regulates the activity of natural killer cell (NK) cells through the CD94-NKG2 receptor (Braud et al., 1998) and the activity of CD8 T cells through the TCR receptor (García et al., 2002), thereby transmitting activation or inhibition signals (Sullivan et al., 2008) and constituting a bridge between innate and adaptive immunity.
Specifically, the NK cell inhibitory receptor NKG2A and the activating receptor NKG2C were found to bind HLA-E on the cell surface (Braud et al., 1998). The affinity of HLA-E to the inhibitory receptor CD94/NKG2A is generally greater compared with CD94/NKG2C; the high expression of HLA-E on the cell surface may be an important mechanism underlying viral entry or tumor escape (Petrie et al., 2008).
HLA-E is a 3822 bp long gene located between the HLA-A and HLA-C genes of human chromosome 6. It contains 5′-promoter, 8 exon, 7 introns, and 3′-untranslated region (UTR). The polymorphism of HLA-E is extremely limited compared with other HLA class I genes. Currently, 271 HLA-E alleles published in the IPD-IMGT/HLA Database encoding 110 different protein variants are reported (Release 3.44, April 2021) (
In a previous study, we have demonstrated that HLA-E*01:03 homozygous is a susceptible gene for acute leukemia and HLA-E*01:01 homozygous is protective (Xu et al., 2019). Herein, we further explore the polymorphism within full-length gene of HLA-E in Chinese individuals and its association with leukemia. To the best of our knowledge, this work is the first report of the polymorphism within genomic full-length sequence of HLA-E in Chinese population. We anticipate that our findings can provide novel scientific knowledge about the nucleotide variability of the complete HLA-E gene region, which are important for fully understanding the function of HLA-E and association with leukemia.
Materials and Methods
Healthy blood donors and leukemia patients
The control group comprises blood samples collected from 142 healthy blood donors at the Shenzhen Blood Center, between 2017 and 2019. The donation process and blood management were fully in accordance with the Blood Donation Law of the People's Republic of China and the Blood Donation Regulation of the Shenzhen Special Economic Zone. The blood donors with the age ≥18 years who tested negative for all the transfusion-transmitted disease screening assays were enrolled, such as HIV, syphilis, Hepatitis B and C virus, and so on, and the results of their physical and hematological examinations had to conform to the criteria of healthy blood donors. Consistently with the guidelines of the Medical Ethics Committee of the Shenzhen Blood Center, participants with personal or family histories of major diseases were excluded from the study.
The test group includes a total of 111 leukemia patients treated at the Shenzhen Second People's Hospital. The selected patients were all diagnosed with leukemia, according to the Blood Disease Diagnosis and Treatment Standards (acute myelocytic leukemia: 68, chronic myelocytic leukemia: 2, acute lymphoblastic leukemia: 32, chronic lymphocytic leukemia: 2, acute leukemia: 7; Supplementary Table S1). Leukemia patients suffering from other systemic diseases were excluded from the study. Informed written consent was procured from all participants before blood donation, as per the requirements of the Medical Ethics Committee of the Shenzhen Blood Center (No.: SZBC2019R021).
HLA-E amplification
The genomic DNA used in this study is pure (OD260/OD280 ratio of 1.6–2.0), and its concentration was adjusted to 50–100 ng/μL. The forward and reverse amplification primers selected for PCR analysis are 5′-GCCCAGCCAGGACTAATTTCT-3′ and 5′-CCTAAGTGCTGGGATTACAGG-3′, respectively (Hong et al., 2020). The PCR system was prepared by mixing 8.0 μL 5 × GXL buffer, 2.0 μL dNTP (2.5 mM each), forward and reverse amplification primers (1 μL each, 10 μmol/L), 100 ng genomic DNA, 2.5 U GXL, and 40 μL double distilled water (ddH2O). The temperature program of the reaction system was set to 95°C for 3 min, 95°C for 30 s, 64°C for 30 s, and 72°C for 2 min. This program was repeated in 40 cycles, and then the temperature was kept at 72°C for another 10 min. Upon terminating the amplification process, the reacted mixture was stored at 4°C. The PCR product was stained with SYBR green I and then electrophoresed on a 1.2% agarose gel. The specific amplified band was determined to be about 3.6 kb.
Sanger and cloning sequencing of the HLA-E gene
The PCR product was purified using the ExoSAP-ITTM Express PCR Product Cleanup Reagent (ThermoFisher Scientific, Santa Clara, CA) and then sequenced on the ABI3730 DNA sequencer (Applied Biosystems, Foster City, CA). The sequencing reaction system consisted of 0.25 μL BigDye® Terminator v3.1 cycle, 2 μL 5 × sequencing buffer, 0.2 μL sequencing primer, 5.55 μL ddH2O, and 2 μL PCR purified product. Cloning sequencing was used to confirm the sequences of questionable samples by pGSI vector.
Analysis of HLA-E sequencing results
The Lasergene 12 SeqMan Pro Sequence Alignment Editor (
Bioinformatics analysis
The sequences of the major histocompatibility complex (MHC)-E promoter of the gorilla and chimpanzee were downloaded from the University of California Santa Cruz Genome (UCSC) website (
Dual luciferase reporter gene experiment
The human HLA-E gene 5′-promoter region sequence was about 1000 bp in GeneBank; the 1000 bp sequence of wild-type and mutant-type promoters was synthesized in vitro. The upstream and downstream primers were designed and constructed, and the primers' sequences are shown in Table 1. The amplified product was digested with XhoI and HindIII and cloned into the firefly-containing luciferase vector PGL4.10.
Sequences of Upstream and Downstream Primers
The PCR system was as follows: synthetic DNA (100 ng/μL) 1 μL, upstream primer pHLA-E-F(XhoI) (10 μM) 1.5 μL, downstream primer pHLA(W)-E-R (Hind III)/pHLA(M)-ER(Hind III) (10 μM) 1.5 μL, DNA polymerase (5 U/μL) 1 μL, 5 × Buffer 10 μL, add ddH2O to 50 μL, the reaction conditions were as follows: 98°C 1 min, 98°C 10 s, 55°C 10 s, 72°C 1 min, 35 cycles, 72°C 5 min. The amplified products pHLA-E(W) and pHLA-E(M) were subjected to electrophoresis, and the Agarose Gel Recovery Kit was used for recovery.
The digestion system of PGL4.10 vector was as follows: PGL4.10 5 μg, XhoI 1.5 μL, HindIII 1.5 μL, 10 × Green Buffer 5 μL, add ddH2O to 50 μL, 37°C 30 min. The digestion system of the recovered pHLA-E gene fragment was as follows: the recovered pHLA-E (W)/pHLA-E (M) PCR product 45 μL, XhoI 1.5 μL, HindIII 1.5 μL, 10 × Green Buffer 5 μL, add ddH2O to 60 μL, 37°C 30 min. The digested gene fragments and the vector were, respectively, run through electrophoresis to cut gel for recovery.
Connected the digested PGL4.10 vector with pHLA-E(W)/pHLA-E(M) gene fragment under the following reaction system: 5 × Ligation buffer 2 μL, Double digested PGL4.1.0 1 μL, T4 DNA ligase 1 μL, pHLA-E(W)/pHLA-E(M) gene fragments 5.5 μL, adding ddH2O to 10 μL, and incubated at 16°C overnight. The ligation product with competent cells was mixed; 100 μL of the mixture was evenly coated on a Terrific Broth (TB) plate containing 100 μg/mL Ampicillin resistance, inverted, and incubated overnight in a constant temperature incubator at 37°C.
A single clone was picked on the TB plate. The recombinant plasmid was extracted using a Plasmid Small Extraction Kit. The extracted plasmid was digested with XhoI and HindIII for negative and positive identification. The digestion reaction system was as follows: recombinant plasmid 5 μL, XhoI and HindIII each 0.5 μL, 10 × Green Buffer 1.5 μL, ddH2O to 15 μL, and the digested product was agarose gel electrophoresis. Plasmids with correct digestion results were sequenced. Colonies with correct sequencing results were inoculated into 15 mL of TB medium containing 100 μg/mL Ampicillin resistance, and endotoxin-free plasmids were extracted with high-purity plasmid extraction kit for subsequent experiments.
HEK293 cell suspension was transfected with pci-zsgreen plasmid to detect transfection efficiency, pcDNA3.1-Rluc empty vector, wild-type luciferase vector, mutant-type luciferase vector into HEK293 cells, cell lysate was added to fully lyse the cells, leave it on ice for 10 min, centrifuge at 10000g, 4°C for 10 min, 50 μL of the supernatant was placed in a 96-well plate, 100 μL of firefly luciferase reaction substrate was added, and fluorescence intensity was detected. After adding the quencher to the same well, 100 μL of the internal ginseng Renilla luciferase reaction substrate was added for a second measurement.
Statistical analyses
The data recorded for healthy blood donors and leukemia patients were statistically analyzed to confirm the comparability of the two groups. The gender and age parameters of the 142 healthy blood donors and 111 leukemia patients were analyzed using the Chi-square test and the nonparametric rank sum test, respectively. Data concerning the HLA-E alleles and their corresponding genotypic frequencies in both groups were treated by the Chi-square test and risk assessment. The fluorescence intensity of mutant-type promoter and wild-type promoter was statistically analyzed by t-test. All statistical analyses were performed using the SPSS software (
Results
Statistical data of healthy blood donors and leukemia patients
According to the data listed in Table 2, the difference in gender (p = 0.083 > 0.05) and age (p = 0.476 > 0.05) between 142 healthy blood donors and 111 leukemia patients is not statistically significant.
Statistical Analysis of Healthy Blood Donors and Leukemia Patients
Frequency distribution of HLA-E alleles and genotypes in 142 healthy blood donors and 111 leukemia patients
As shown in Table 3, 13 and 11 HLA-E alleles were identified in the healthy blood donor and leukemia patient groups, but only 8 and 8 alleles had a higher frequency than 1%, respectively. The allele with the highest frequency distribution in both groups is HLA-E*01:03:01:01 (30.28% in healthy donors vs. 32.43% in leukemia patients), followed by HLA-E*01:03:02:01 (25.70% in healthy donors vs. 31.98% in leukemia patients) and HLA-E*01:01:01:01/02 (20.77% in healthy donors vs. 17.57% in leukemia patients). The greatest statistical difference between healthy donors and leukemia patients was observed for the frequency of the HLA-E*01:01:01:06 allele (8.45% in healthy donors vs. 3.60% in leukemia patients, p = 0.028 < 0.05).
Frequency Distribution of Human Leukocyte Antigen-E Alleles in Healthy Blood Donors and Leukemia Patients
Novel alleles first reported in this study.
T < 5 and T > 1 using the continuous calibration Chi-square test.
T < 1 using Fisher's exact test.
CI, confidence interval; HLA, human leukocyte antigen; OR, odds ratio.
Overall, 32 HLA-E genotypes were identified in the blood samples of participants (Table 4), and the frequency conforms to Hardy–Weinberg equilibrium law. The most common genotypes were HLA-E*01:03:01:01, *01:03:02:01, HLA-E*01:03:01:01, *01:03:01:01, and HLA-E*01:01:01:01/02, *01:03:01:01 in both groups. The genotype HLA-E*01:03:01:01, *01:03:02:01 exhibits the highest frequencies in healthy donors and leukemia patients (16.91% in healthy donors vs. 23.42% in leukemia patients), respectively. The greatest statistical difference between the two groups was recorded for the frequency of the homozygous genotype HLA-E*01:03:02:01, *01:03:02:01 (4.93% in healthy donors vs. 12.61% in leukemia patients, p = 0.028 < 0.05).
Human Leukocyte Antigen-E Genotype Frequency Distribution and Hardy–Weinberg Equilibrium Analysis
The observation value of Hardy–Weinberg equilibrium analysis is the summation of healthy blood donors and leukemia patients.
T < 5 and T > 1 using the continuous calibration Chi-square test.
T < 1 using Fisher's exact test.
Characterization of novel alleles in Chinese individuals
The analysis of HLA-E sequencing results in Chinese individuals has led to the identification of eight novel HLA-E alleles (Table 5), with variations in the regions of 5′-promoter, exons, and introns, respectively. A few of the newly detected polymorphic sites are not rare, especially for HLA-E*01:01:01:06 (with the mutation in 5′-promoter at nucleotide position-26 “T” and found in 32 individuals) and followed by E*01:12:01:01 (with the mutation in exon 5 and causes amino acid change form P > Q, and found in 6 individuals), E*01:03:01:05 (with the mutation in 5′-promoter at nucleotide position-33 and found in 3 individuals), E*01:03:02:04 (with the mutation in intron 6 at nucleotide position 2937 and found in 3 individuals), and E*01:01:01:11 (with the mutation in intron 1 at nucleotide position 121 and found in 3 individuals), as Table 3 shows.
Characterization of Novel Alleles in Chinese Individuals
NT, nucleotide.
The frequency distribution differences of novel HLA-E alleles in healthy donors and leukemia patients are used to indicate whether these alleles can protect against leukemia or promote it. However, except the HLA-E*01:01:01:06 allele, the association between other novel HLA-E alleles and leukemia could not be surely discerned in this study, owing to the limited number of participants.
Evolutionary analysis of HLA-E*01:01:01:06
By comparing the MHC-E homologous promoter sequence between human and gorilla and chimpanzee in Figure 1, it can be seen that promoter “T” at nucleotide position -26 in HLA-E*01:01:01:06 allele is a new mutation in human, while “G” in HLA-E*01:01:01:01 is an ancestral allele.
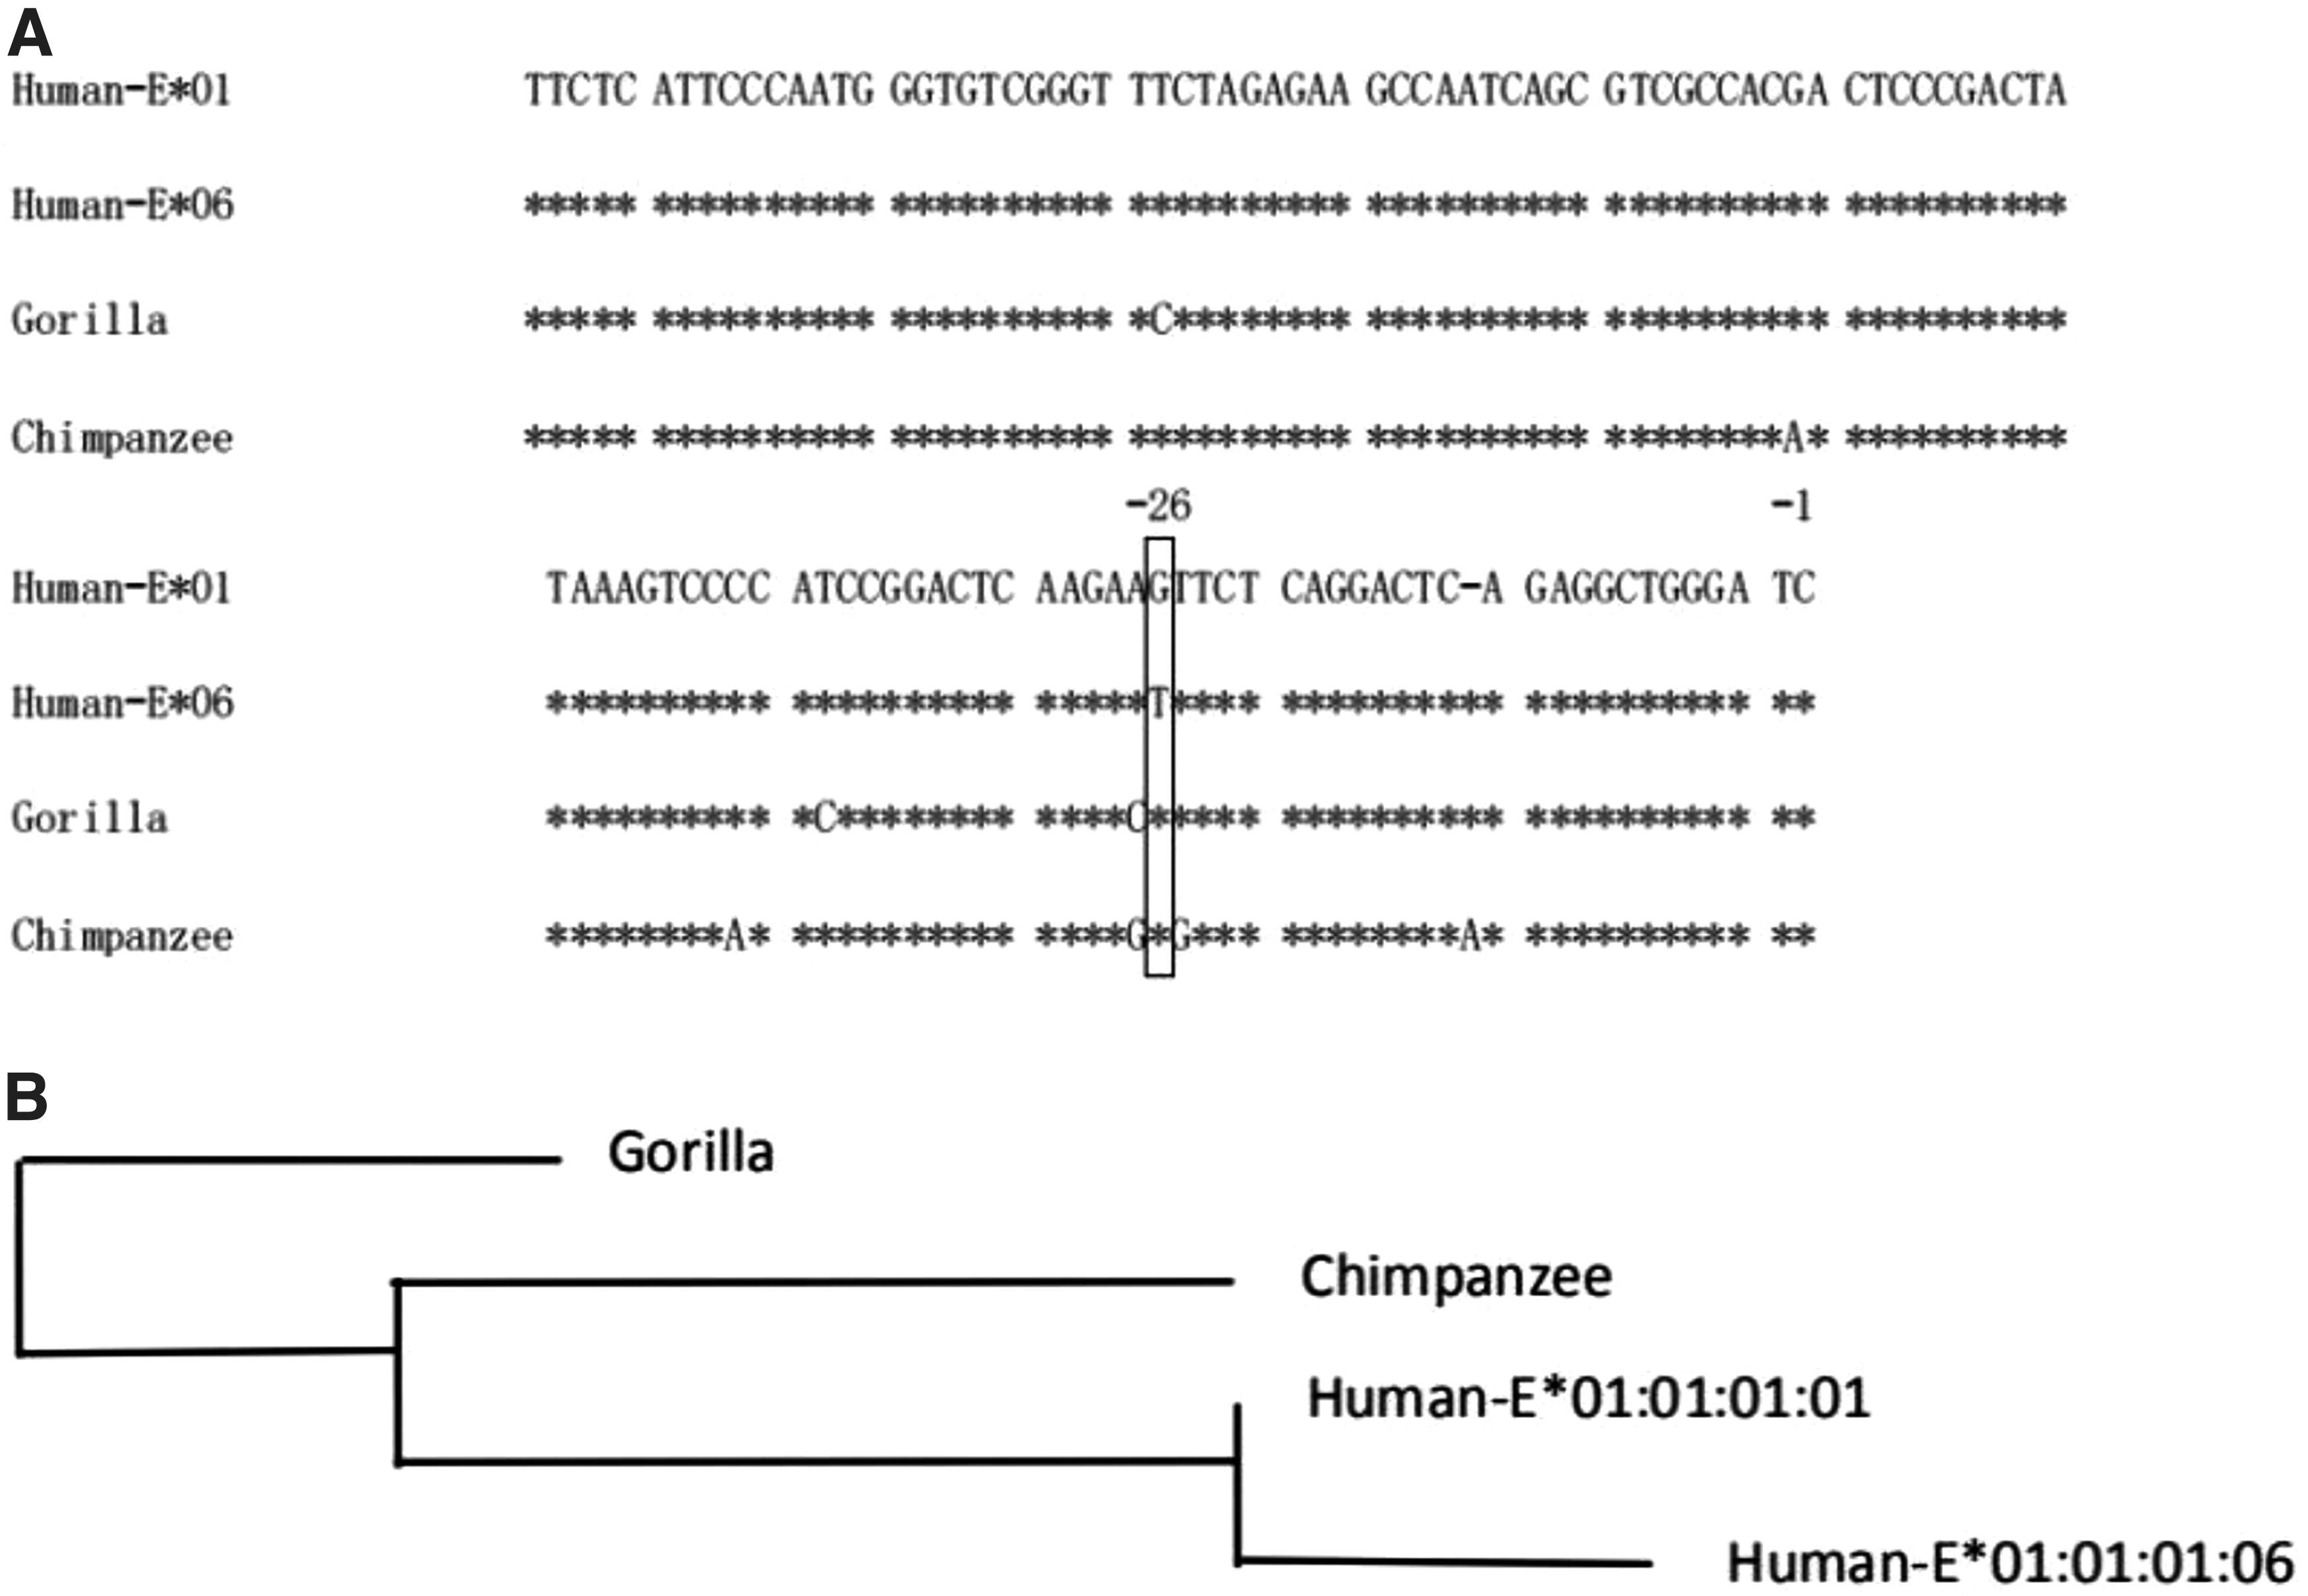
Alignment and evolutionary analysis of the original species homologous sequence and human HLA-E gene promoter sequence.
Prediction of promoter variation (G>T) binding to transcription factors
Promoter variation at nucleotide position-26 (G>T) can lead to differential binding to the transcription factor HOXA5 using the prediction of Jaspar Database (
The Binding of the Transcription Factor HOXA5 at the Mutation Site of the Human Leukocyte Antigen-E Promoter
Score value: The larger the score value, the greater the possibility of binding ability. Start: to provide the binding start position of the promoter sequence. End: to provide the binding end position of the promoter sequence. Predicted site sequence: promoter binding region Sequence information.
Transcription activity of different HLA-E promoters
Using HLA-E promoter primers with double restriction sites, the fragment of 1000 bp promoter sequences, including the wild type and mutant type of HLA-E, was successfully amplified. The PCR product electropherogram is shown in Figure 2.
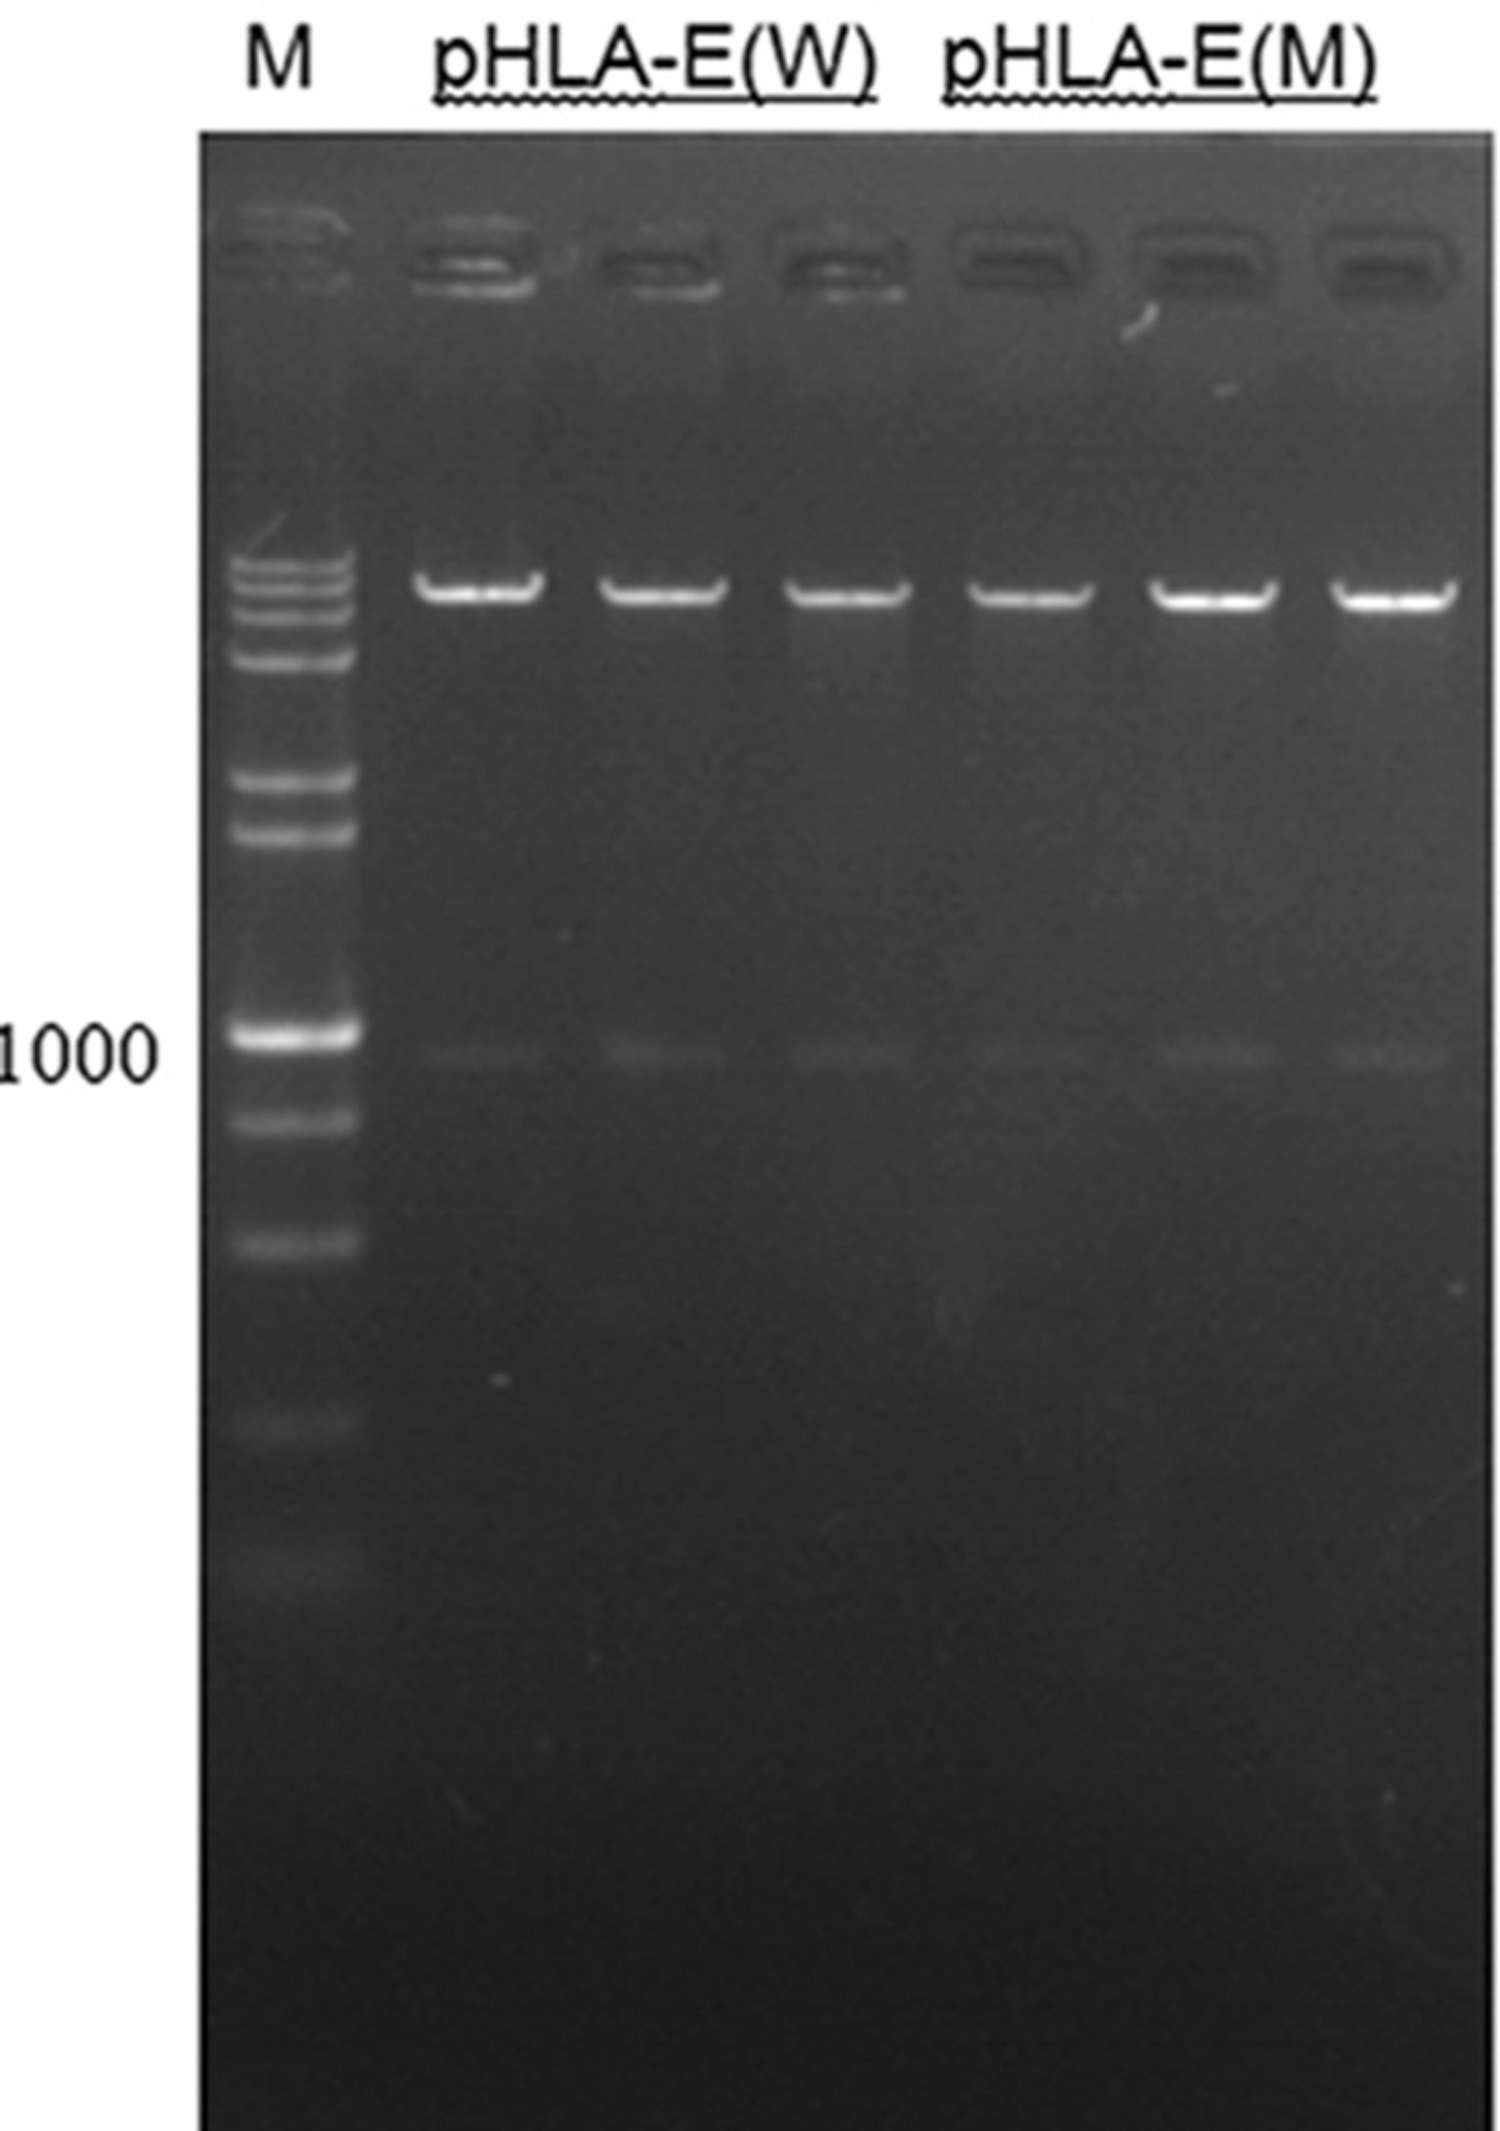
Electrophoresis of wild-type and mutant-type HLA-E promoter 1 hole: 5 kb Marker; 2, 3, 4 holes: XhoI+HindIII double enzyme digestion pHLA-E(W) expression vector; 5, 6, 7 holes: XhoI+HindIII double digestion pHLA-E(M) expression vector. The pHLA-E(W) is used to describe the gene of wild-type promoter, and the pHLA-E(M) is used to describe the gene of mutant-type promoter.
The sequencing result of the positive plasmid with wild-type promoter is shown in Figure 3A, and sequencing result of the positive plasmid with mutant-type promoter is shown in Figure 3B.
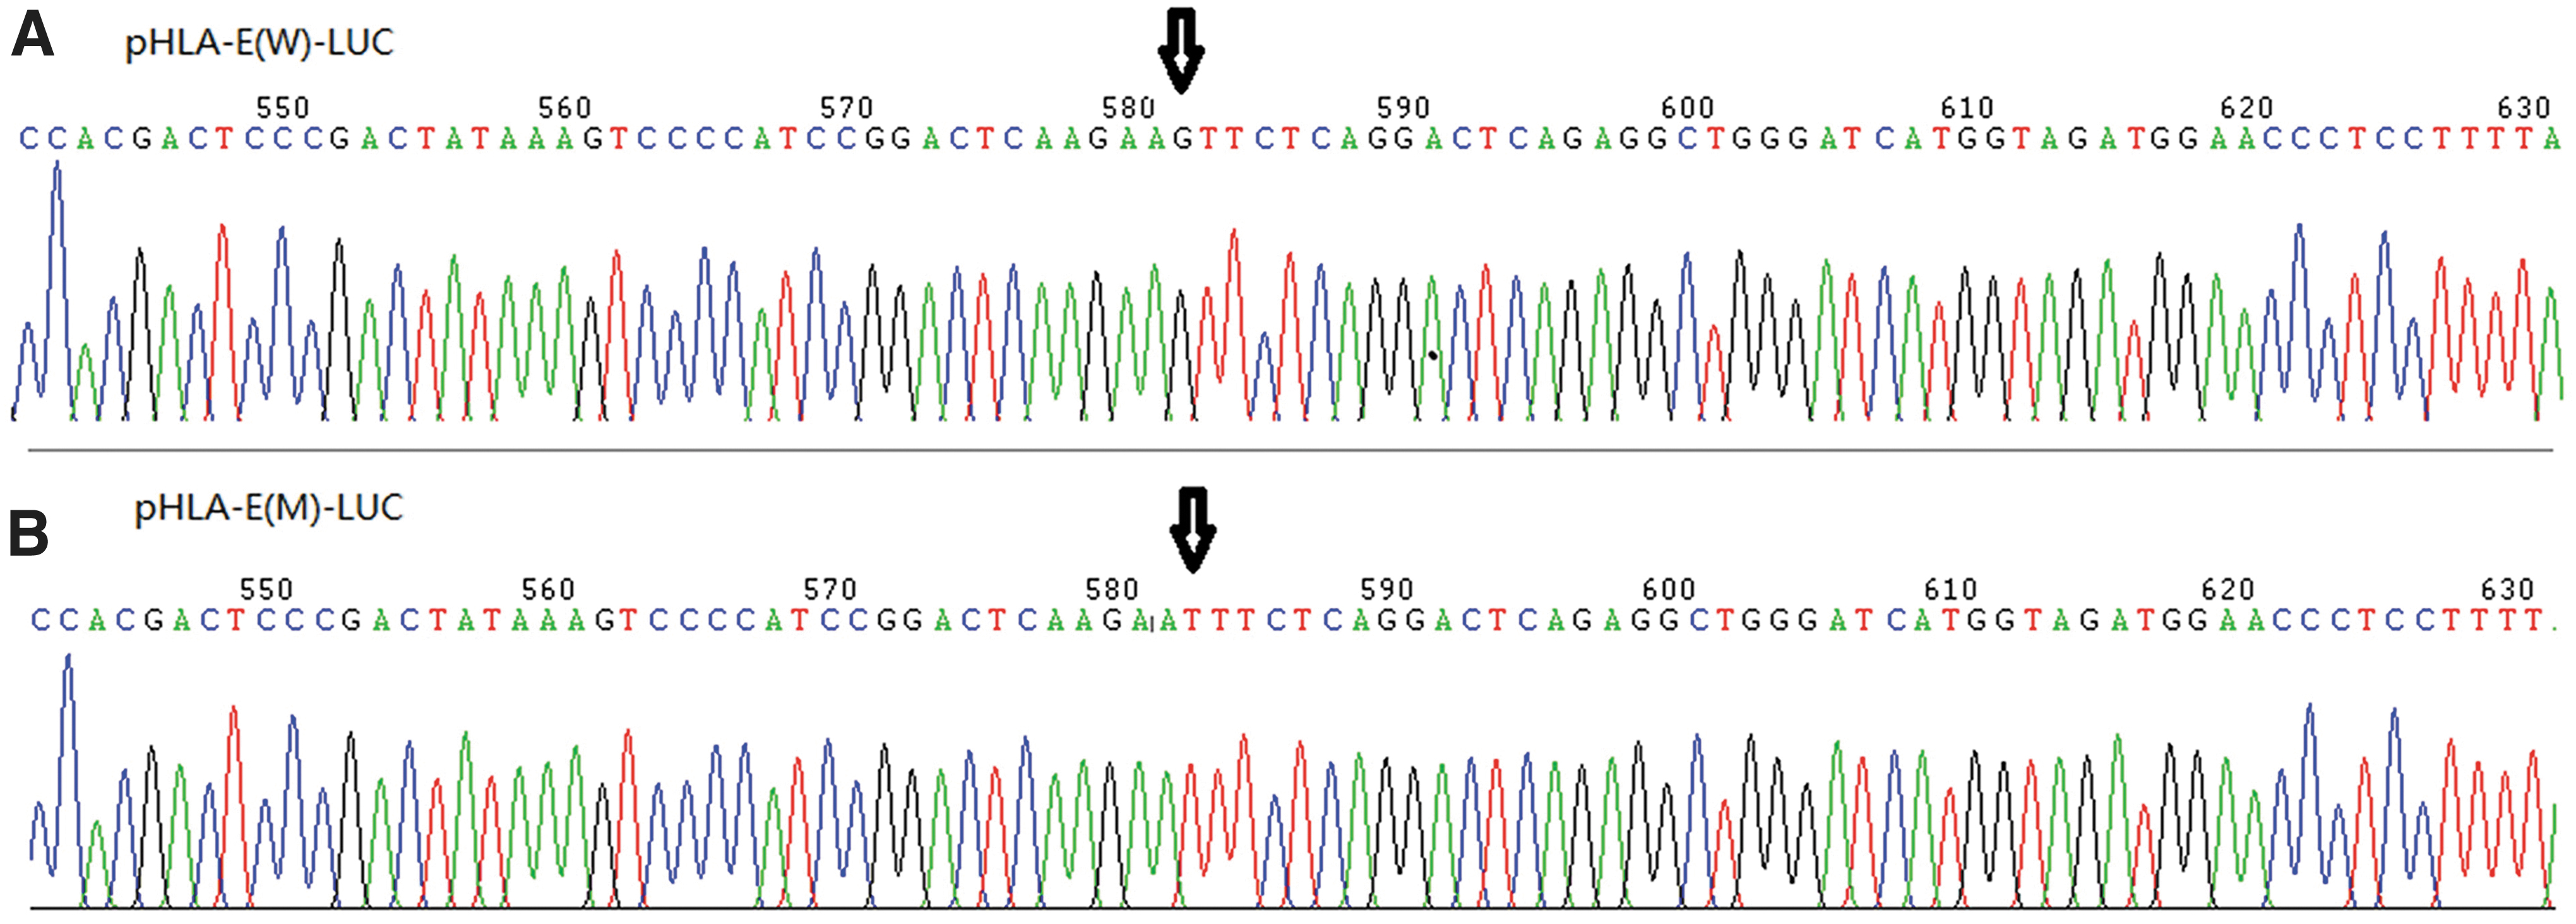
Sequencing results of the positive plasmid.
As shown in Figure 4, using our transfection system, HEK293 cell suspension was successfully transfected by pci-zsgreen plasmid. Under the same condition, the positive recombinant plasmid linking PGL4.1.0 with wild-type promoter (pHLA-E-W) and mutant-type promoter (pHLA-E-M), respectively, was cotransfected into HEK293 cells with the internal ginseng Renilla luciferase pcDNA3.1-RLUC plasmid. Through the detection of its fluorescence intensity, we found that the transcription activity of the mutant-type promoter (T) was significantly reduced compared with the wild-type promoter (G), and the difference between two groups is statistically significant in Figure 5 (p = 0.0242 < 0.05).

Fluorescence image of pci-zsgreen plasmid transfection. Color images are available online.

The results of dual luciferase reporter gene experiment. pHLA-E(W) and pHLA-E(M): The effect of wild-type promoter and mutant-type promoter on luciferase activity, *p = 0.0242 < 0.05. Luc, Luciferase; RLuc, Renilla Luciferase.
Discussion
In recent years, HLA-E polymorphism has been considered to play an important role in the progression and prognosis of leukemia. Depending on the overall effects of the individual alleles, the HLA-E polymorphism may favor or disfavor the disease (Hirankarn et al., 2004; Park et al., 2007; Paladini et al., 2009; Guzmán-Fulgencio et al., 2013; Hosseini et al., 2013; Douik et al., 2016; Zidi et al., 2016; Tsamadou et al., 2017). Most of the available studies are focused on the polymorphism of the exon 2, 3, and 4 regions only.
In recent years, the study of HLA gene polymorphism has gradually expanded from the coding region to the regulatory region (Olieslagers et al., 2017; Sonon et al., 2018; Wang et al., 2017). Many studies have shown that polymorphism in the regulatory region is closely related to gene expression (Martelli-Palomino et al., 2013) and the development of diseases (Ouni et al., 2019; Schwich et al., 2019), especially for mutations in promoter region (Cheng et al., 2021; Gandini et al., 2021). However, a lot is yet to be learned concerning the relationship between polymorphism and the function of the HLA-E regulatory region.
To the best of our knowledge, HLA-E*01:01:01:06 is the first HLA-E allele to show a nucleotide change in the promoter region (Xu et al., 2017). Compared with other populations, the frequency of “T” variation at nucleotide position-26 in our results is different from that of Brazilian population (1.67% vs. 8.45%, p < 0.01) (Ramalho et al., 2017), but similar to the frequency in Africa (8.45% vs. 8.23%, p > 0.05) (Castelli et al., 2015). And based on the result of bioinformatics analysis, it was found that promoter variation G > T at nucleotide position-26 can lead to differential binding to the transcription factor HOXA5. And in our result of the dual luciferase reporter gene experiment it downregulates gene expression by reducing transcriptional activity. Thereby we speculate that HOXA5 is a transcription repressor which binds “T” allele at nucleotide position-26 stronger than “G” and affects the expression of HLA-E and further affects the immune response to leukemia.
Moreover, in the alignment and evolutionary analysis (Fig. 1), we find that “T” in HLA-E*01:01:01:06 is a new mutation in human, while “G” in HLA-E*01:01:01:01 is the ancestral allele by comparing with Gorilla and Chimpanzee. These data suggest that this novel mutation arises after the expansion of Homo sapiens and has been maintained in diverse populations during the evolution of humans. This may be due to the selective effect of certain human diseases, making the emergence of this mutation to protect humans from certain diseases, such as leukemia.
Investigations of the HLA-E full-length genotype frequencies in healthy blood donors and leukemia patients were also conducted in this study. The greatest difference in frequency between the two subject groups was recorded for the genotype HLA-E*01:03:02:01, *01:03:02:01 which showed a distribution of 4.93% in healthy blood donors and 12.61% in leukemia patients (p = 0.028 < 0.05). In our previous study, it had been reported that HLA-E*01:03, *01:03 was associated with leukemia (Xu et al., 2019), and the high expression of HLA-E molecules on cell surfaces characterized by this genotype facilitates the escape of leukemia cells, thereby inhibiting the immune response. Now we know that in many genotypes under coverage of HLA-E*01:03, *01:03, HLA-E*01:03:02:01, *01:03:02:01 is a notable genotype in high risk influencing the onset and development of leukemia. We find that the frequency of HLA-E*01:03:02:01 allele is roughly the same in different populations (27.26% Brazilian vs. 30.38% African vs. 25.70% Chinese, p > 0.05). Therefore, there may be differences in the frequency distribution of HLA-E genotypes between leukemia patients and healthy people in other populations, just as reported in this article.
The frequency survey conducted herein fails to identify some of the HLA-E alleles listed in the IPD-IMGT/HLA Database, such as HLA-E*01:06 and HLA-E*01:09. This is possibly due to the low frequencies of these alleles in Chinese individuals. However, eight new HLA-E alleles (not listed in the IPD-IMGT/HLA Database) were first detected. The sequence of mutation in the promoter region of nucleotide position-26 “T” was not only shown in HLA-E*01:01:01:06 but also found in the novel allele HLA-E*01:03:01:07. The novel allele HLA-E*01:03:01:05 was also found in a mutation in the promoter region. Further investigation is needed to show whether it influences the transcriptional level of HLA-E.
Mutations were also detected in the exon regions. The amino acid change (L > V) caused by a single nucleotide alteration in the exon 1 of HLA-E*01:14 allele may result in varying expression levels of the HLA-E molecule as exon 1 encodes the leader peptide. The variation of HLA- E*01:12:01:01 allele was detected in the exon 5, which encodes transmembrane region and caused the original proline to be converted to glutamine. We anticipate that it may change HLA-E molecule structure which ultimately alters its function. We found this allele in both healthy blood donors and leukemia patients. However, the low frequency of this allele does not allow us to elucidate the association with leukemia.
Recently, HLA-E has become a hotspot in immunology research, especially its interaction with NK cells. Studies available in the literature showed that blocking the HLA-E inhibitory receptor NKG2A on cell surfaces enhances the killing activity of NK cells (Ramsuran et al., 2018; Kamiya et al., 2019). Therefore, immune reaction to tumor cells is significantly affected by the expression level of HLA-E molecules whose function is controlled by the alleles available at variable sites in the coding and regulatory regions of the HLA-E gene. The results obtained in this study indicate that HLA-E alleles and genotypes are differentially distributed in healthy blood donors and leukemia patients, leading to varying immune responses toward leukemia cells. For example, HLA-E*01:01:01:06 may be detrimental to the survival and development of leukemia cells in individuals who carry this allele. Consequently, leukemia patients exhibit a lower frequency distribution of HLA-E*01:01:01:06 than healthy people. However, the typing of the HLA-E*01:03:02:01, *01:03:02:01 genotype helps leukemia cells escape the body's immune response, and thus, the frequency of this genotype is higher in leukemia patients than in healthy individuals. In general, our results confirm that HLA-E polymorphism constitutes an auxiliary molecular indicator for the prediction and treatment of leukemia, especially the variation G > T at nucleotide position-26 in HLA-E*01:01:01:06, and it is closely related to its regulation of gene expression.
Footnotes
Authors' Contributions
Conceptualization: Y.-P.X. and W.-X.H. Methodology: L.-Y.S. and S.-X.W. Investigation: L.-Y.S. and S.-X.W. Resources: Y.-P.X. and W.-X.H. Data analysis: L.-Y.S. and Y.-P.X. Drafting of article: L.-Y.S. Critical revision: W.-X.H. and Y.-P.X. Funding acquisition: W.-X.H. and Y.-P.X.
Acknowledgment
The authors acknowledge the Shenzhen Blood Center.
Data Availability Statement
The data files that support the findings of this study are available upon request.
Disclosure Statement
The authors confirm that there are no conflicts of interest.
Funding Information
This study was financially supported by Guangdong Natural Science Foundation (No. 2020A1515010387), the Sanming Project of Medicine in Shenzhen (No. SZSM201811092), the Shenzhen Science and Technology Plan Project (No. JCYJ20180302153439758), and the Shenzhen Key Medical Discipline Construction Fund (No. SZXK070).
Supplementary Material
Supplementary Table S1
References
Supplementary Material
Please find the following supplemental material available below.
For Open Access articles published under a Creative Commons License, all supplemental material carries the same license as the article it is associated with.
For non-Open Access articles published, all supplemental material carries a non-exclusive license, and permission requests for re-use of supplemental material or any part of supplemental material shall be sent directly to the copyright owner as specified in the copyright notice associated with the article.
