




Abstract
Studies have shown that ferroptosis, an iron-dependent regulated cell death, is related to prognosis and chemotherapy, but the role of ferroptosis in pancreatic adenocarcinoma (PAAD) is still unclear. We aimed at constructing a ferroptosis-related gene (FRGs) model to predict the PAAD patients' overall survival (OS) and at exploring their values in chemotherapy. We downloaded the mRNA-sequencing data and corresponding clinical data of patients with PAAD from The Cancer Genome Atlas. Lasso-penalized Cox regression analysis was utilized to construct a prognostic risk model, including spermidine/spermine N1-acetyltransferase 1 (SAT1), SAT2, TFRC, SLC39A8, MAP1LC3A, ALOX15, and PROM2. Receiver operating characteristic curves were used to evaluate the prognostic model. International Cancer Genome Consortium cohorts were used to validate this model. Then, we used Genomics of Drug Sensitivity in Cancer and Gene Expression Omnibus databases to analyze the correlation between FRGs and drug sensitivity. Notably, SAT1 showed significant influence in cisplatin and gemcitabine resistance. Finally, in vitro experiments demonstrated that the combination of gemcitabine and cisplatin could induce ferroptosis in AsPC1 cells, probably through elevated SAT1 expression. Taken together, Our 7-gene signature has significant values in predicting the PAAD patients' OS, and it may help inform the clinical treatment of PAAD.
Introduction
Pancreatic adenocarcinoma (PAAD) is one of the most lethal types of cancer worldwide, which owned the 5-year overall survival (OS) of only 9% in the United States in 2020 (Siegel et al., 2020). Recently, gemcitabine, in combination with other drugs, such as cisplatin, has become the most widely prevalent therapeutic regimen (Tadros et al., 2017). However, gemcitabine (Binenbaum et al., 2015) and cisplatin (Galluzzi et al., 2012) are commonly associated with acquired resistance, which leads to a failure in cancer patient management. Therefore, it is very urgent to find a new approach to circumvent chemoresistance and improve the curative effect for PAAD.
Ferroptosis is a recently described form of iron-dependent cell death, and it is mainly triggered by inhibiting antioxidant systems, especially the cystine/glutamate antiporter (xCT) (Dixon et al., 2012) and glutathione peroxidase (GPX4) (Yang et al., 2014). Recently, ferroptosis has been viewed as a new promising way to kill chemotherapy-resistant cancers (Hassannia et al., 2019).
Accordingly, the inhibition of xCT by erastin potentiated the cytotoxic effects of both gemcitabine and cisplatin in PAAD cell lines (Daher et al., 2019). RSL3-inhibiting GPX4 could enhance the anticancer effect of cisplatin in cancer cells (Zhang et al., 2020). Ferroptosis has gained a lot of interest, especially in chemoresistance. Nevertheless, till now, only a few ferroptosis modulators have been implicated. Therefore, it is of utmost importance to explore the prognostic and therapeutic value of ferroptosis in clinical trials.
In the present study, we (1) generated a ferroptosis-related prognostic risk model and verified the correlation between ferroptosis and drug sensitivity. And we (2) identified spermidine/spermine N1-acetyltransferase 1 (SAT1), one of the ferroptosis-related genes (FRGs), involved in the ferroptosis induced by the combination of cisplatin and gemcitabine. The results proved that ferroptosis is possibly involved in drug resistance and provides new targets for chemotherapeutic intervention.
Methods
Acquisition of FRGs
The FRGs were obtained from Stockwell et al. (2017) and GeneCards website (
Identifying differentially expressed genes between PAAD and normal tissues
The GSE15471 (including 36 PAAD samples and 36 normal samples) and GSE71729 (including 145 PAAD samples and 46 normal samples) were downloaded from the Gene Expression Omnibus (GEO) database. The mRNA-sequencing data were matched with FRGs and by using the “limma” R package, with a false discovery rate <0.05 to screen differentially expressed genes (DEGs).
Comprehensive analysis of the FRGs associated with prognosis in PAAD
We performed univariate Cox regression to explore the relationship between the expression of the 74 FRGs and prognosis by using 170 PAAD samples with OS rates and survival status in The Cancer Genome Atlas (TCGA). Twenty-seven FRGs were statistically significant (p < 0.05) and considered to be associated with the prognosis of PAAD. Overlapping 27 prognosis-related FRGs and 21 differential expression FRGs, we determined 12 candidate genes to construct a prognostic risk model.
Construction and validation of a prognostic risk Model
Lasso-penalized Cox regression analysis was utilized to construct a prognostic risk model based on the mRNA expression of the significant prognostic genes (Tibshirani, 1997; Simon et al., 2011; Kidd et al., 2018). The model formula was constructed as: risk score = (β1 × mRNA1 expression) + (β2 × mRNA2 expression) … + (βn × mRNAn expression).
A ferroptosis-related prognostic model in TCGA cohort was constructed (n = 170), and the prognostic model was validated by using the International Cancer Genome Consortium (ICGC) cohort (n = 182). According to the risk-formula and the median risk score, cohorts were divided into high- and low-risk groups. The timeROC package was used to draw time-dependent receiver operating characteristic (ROC) curves and to evaluate the predictive value of the prognostic model. x2 test was used to check the association of risk score with clinical characteristics.
Construction of a predictive nomogram
The rms R package is used to establish a prognostic nomogram model for assessing OS in the TCGA cohort.
Drug sensitivity
We analyzed the correlation between FRGs expression and drug sensitivity for pan-cancer in genomics of drug sensitivity in cancer (GDSC) by using GSCA (
Using “limma,” “ggplot2,” “ggpubr,” and “corrplot” R packages, we analyzed the correlation between seven FRGs expression and compound activity in the NCI-60 cell line screen developed by the Developmental Therapeutics Program. The National Cancer Institute 60 (NCI-60) cell line datasets used for this study were accessed in CellMiner (Luna et al., 2021) (
Functional enrichment analysis
We used “clusterProfiler” R package to conduct Gene Ontology (GO) and Kyoto Encyclopedia of Genes and Genomes (KEGG) analyses based on the DEGs (|log2FC| ≥ 1, FDR <0.05) obtained in a comparison of different groups. “Goplot” R package was used to draw the plots.
We performed GSEA analyses by GSEAv4.1.0 tool (
Cell culture and treatment
The human PAAD cell line AsPC1 was obtained from the National Collection of Authenticated Cell Cultures (Shanghai, China). AsPC1 cells were cultured in Roswell Park Memorial Institute (RPMI) 1640 medium with 10% serum (Gibco) and 100 U/mL of penicillin and streptomycin in an incubator with 5% CO2 at 37℃. After reaching a 60–80% confluence level, the cells were treated with gemcitabine (5 μM) (LY 188011; MedChemExpress), cisplatin (5 μM) (HY-17394; MedChemExpress), and the combination for 24 h, respectively.
Cell viability assays
Cells (6 × 10³) were seeded in 96-well plates and treated with corresponding chemicals for 24 h. Then, 10 μL of cell count kit-8 kit (CCK-8; Dojindo, Kumamoto, Japan) was added to each well. The plates were incubated for 2 h at 37℃ and detected at 450 nm (Thmo multiskom FC; Thermo Fisher). Each chemical was set up in four replicate wells.
Intracellular Fe2+ assay
To detect intracellular Fe2+, we used FerroOrange (Dojindo) according to the manufacturer's protocol. Briefly, cells were washed trice with Hank's Balanced Salt Solution (HBSS). FerroOrange was added to cells at a final concentration of 5 μM. After incubation with the reagent for 30 min at 37℃, cells were observed with the confocal microscope (Olympus, Tokyo, Japan) immediately.
Lipid reactive oxygen species assay
Lipid reactive oxygen species (ROS) was measured by the probes BODIPY 581/591 C11 (D3861; Invitrogen). The AsPC1 cells were incubated with the probes (5 μM) for 30 min at 37℃ in the dark. Then, the cells were washed three times with HBSS. The images were acquired under confocal microscopy (Olympus).
SAT1 plasmid construction
pCMV3-untagged-SAT1 plasmid (cat: HG16833-UT) and pCMV3-untagged Negative Control Vector (cat: CV011) were purchased from Sino Biological (Beijing, China). Transfection was performed with Lipofectamine 8000 according to the manufacturer's protocol.
Western blot analysis
The total proteins from cell samples were isolated by sodium dodecyl sulfate–polyacrylamide gel electrophoresis (SDS-PAGE); then, they were transferred to polyvinylidene fluoride membranes (ISEQ00010; Merck Millipore). The membranes were incubated overnight at 4°C with primary antibodies against GPX4 (ab125066, 1:2000; Abcam), SLC7A11 (ab175186, 1:1000; Abcam), SAT1 (no. 61586, 1:1000; CST), and GAPDH (10494-1-AP, 1:7500; Proteintech, China). Finally, the membranes were incubated with peroxidase-conjugated goat anti-rabbit IgG (1:5000; Promoter, China) for 2 h at room temperature.
Statistical analysis
Data were expressed as means ± standard error of mean from at least three independent experiments performed in triplicate and analyzed by using GraphPad (Version 8.4.3). Comparisons were analyzed by using student's two-sided t-test, and p < 0.05 was considered statistically different.
Results
Identification of prognostic ferroptosis-related DEGs
A flow chart illustrating the study process is presented in Figure 1.

Flow chart of the study. Color images are available online.
First, we concluded that 74 FRGs and 27 FRGs were related to prognosis in the univariate Cox regression analysis of PAAD from the TCGA cohort. We assigned different-expression FRGs in GSE15471 and GSE71729 separately and finally discovered 21 FRGs expressed differently in both datasets. Finally, a total of 12 ferroptosis prognostic model candidate genes were selected by taking the intersection. The expression and prognostic value of 12 candidate genes was presented in Figure 2A and B (all p < 0.05).
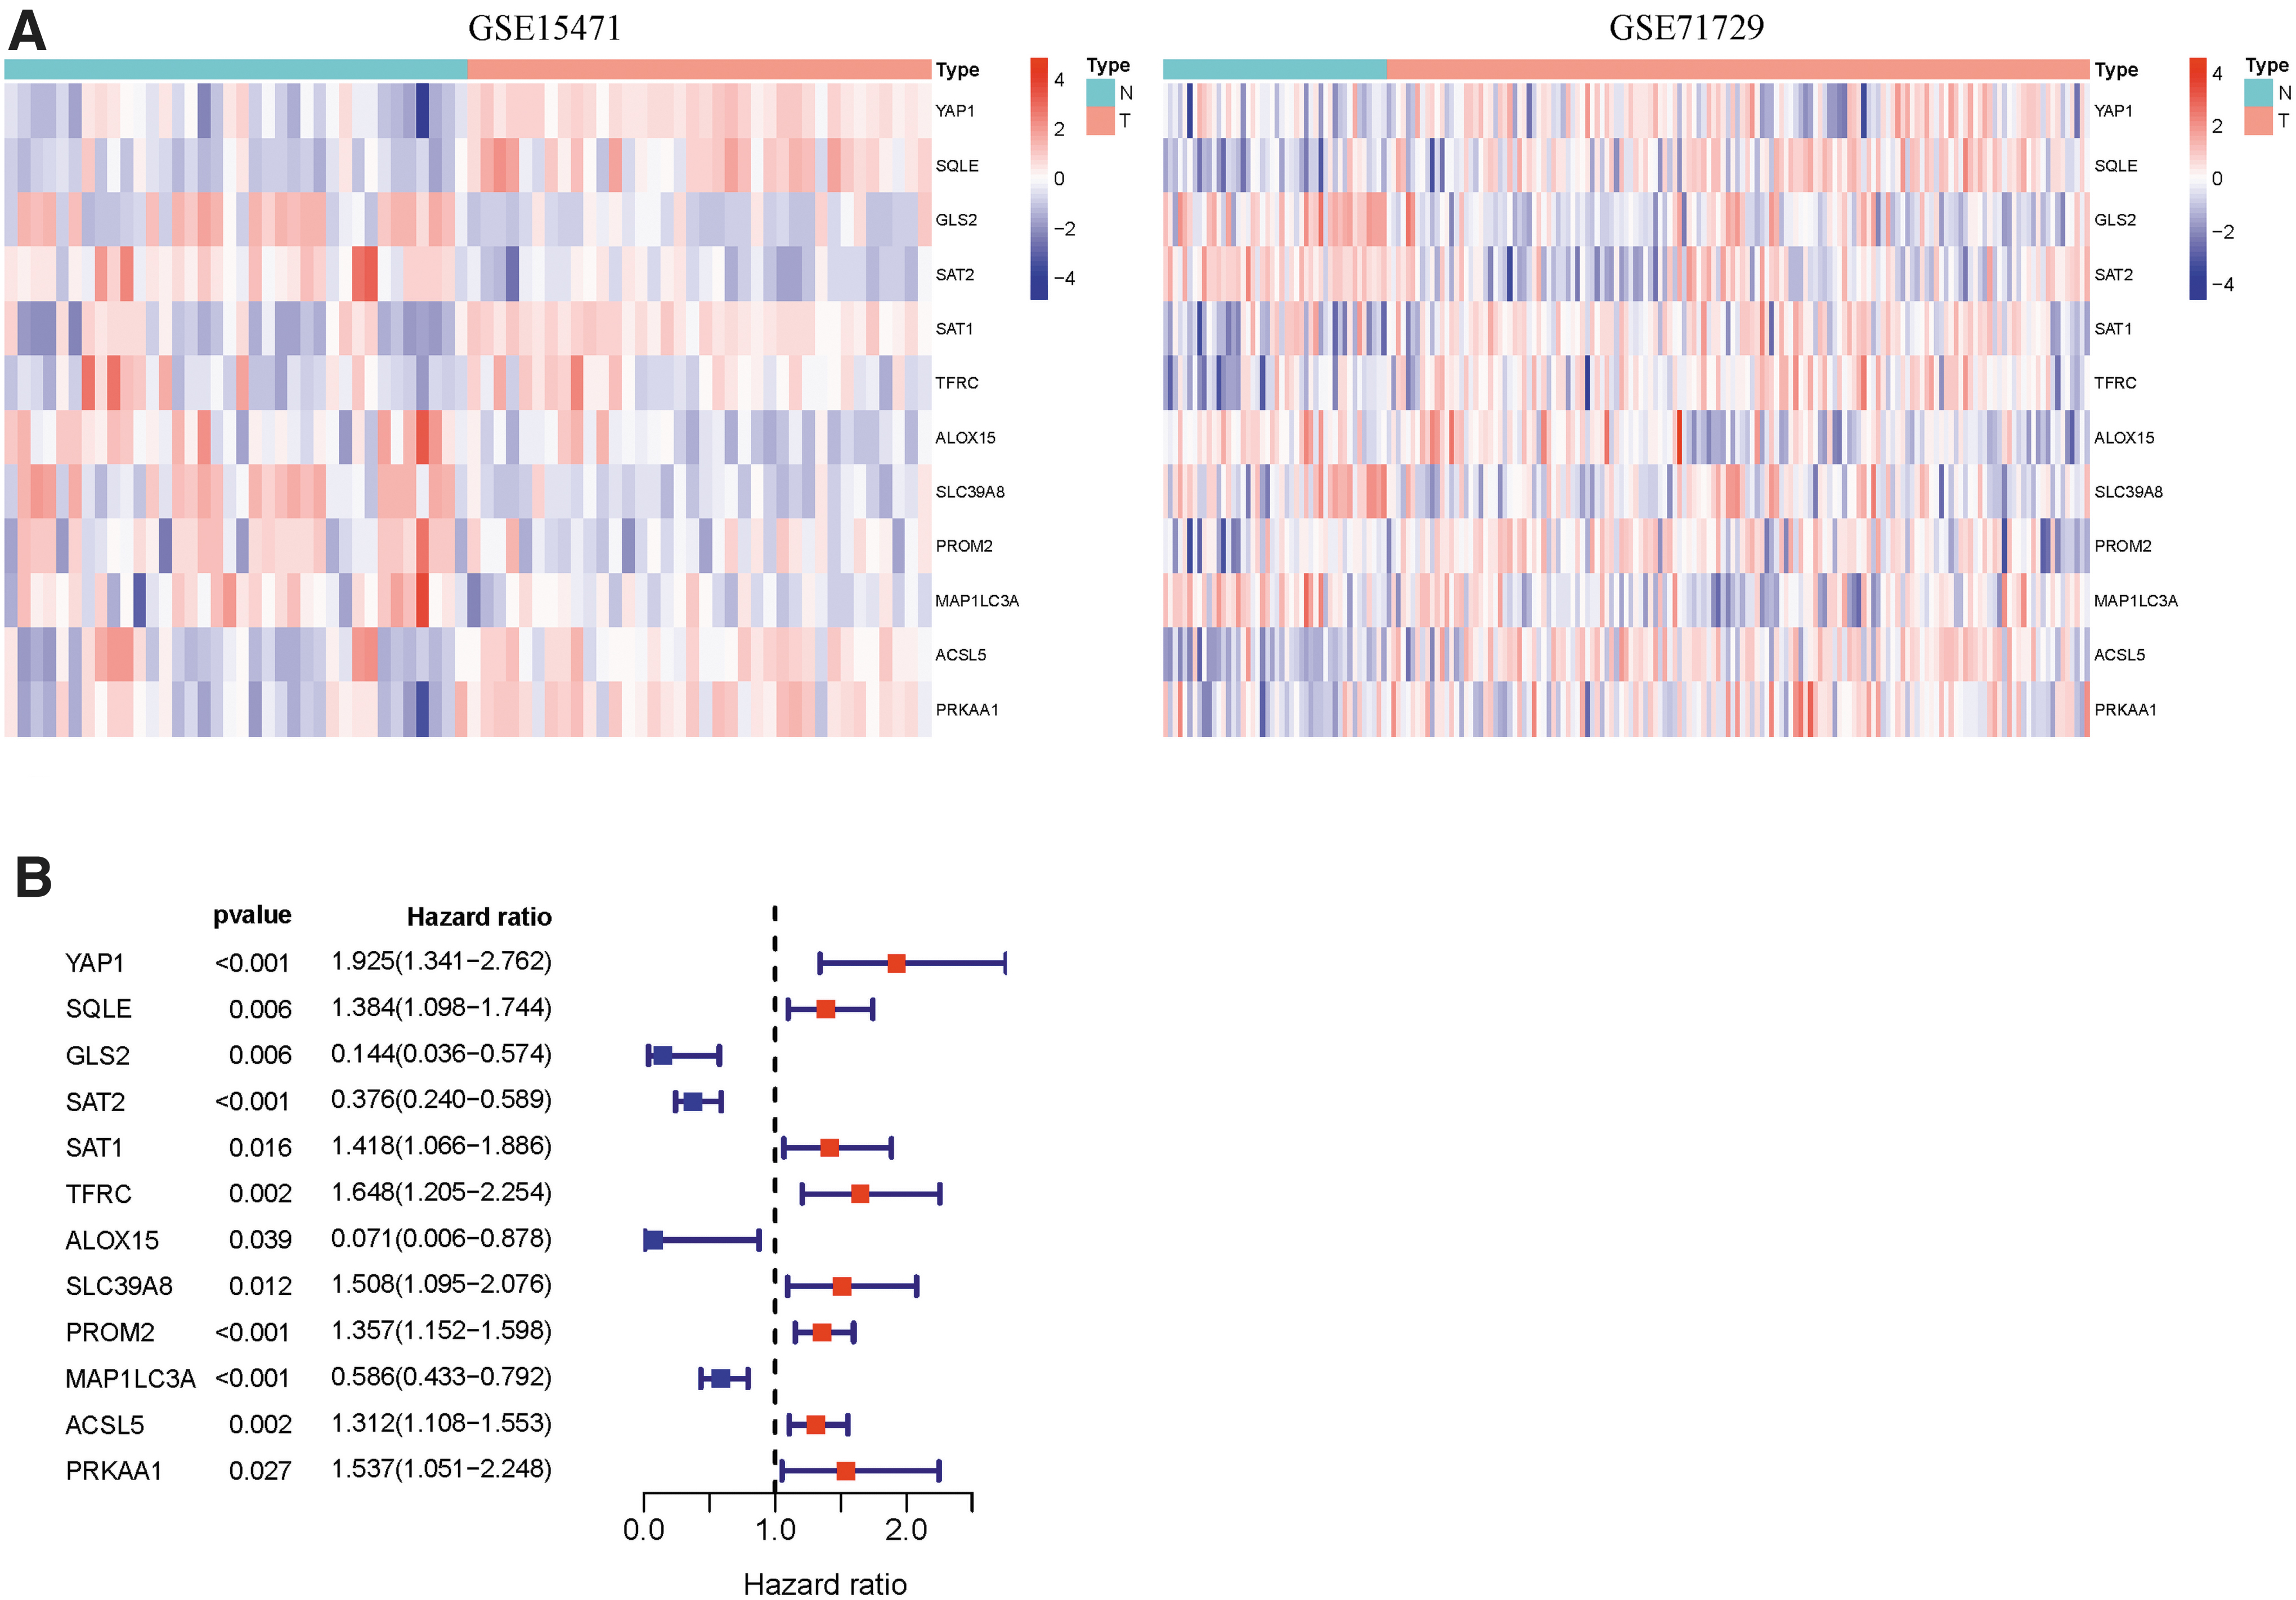
Find prognostic-related differential FRGs.
Development of an FRGs risk model in the TCGA and ICGC
Based on the LASSO Cox regression results, we finally selected seven ferroptosis potential index genes (FPI genes) (SAT2, SAT1, TFRC, SLC39A8, MAP1LC3A, ALOX15, and PROM2) to build a risk signature model. The risk score was calculated as follows: risk score = −0.47718 × expression of SAT2 + 0.10445 × expression of SAT1 + 0.06293 × expression of TFRC −0.88740 × expression of ALOX15 + 0.23625 × expression of SLC39A8 + 0.14397 × expression of PROM2 − 0.24947 × expression of MAP1LC3A.
The ICGC cohort acceded to this study as a test set. According to the risk-formula and the median risk score, the patients with PAAD from the TCGA or ICGC cohort were stratified into high-risk or low-risk groups. Patients with high-risk scores had a significantly poor survival outcome in the training set (p = 0.0000245) (Fig. 3A). The area under the curve values of the training group for 1-, 2-, and 3-year OS were 0.718, 0.702, and 0.689, respectively (Fig. 3B). Similar to the results obtained from the TCGA cohort, the Kaplan-Meier curve (Fig. 3C) and ROC curves (Fig. 3D) of the ICGC cohort verified that the ferroptosis-related risk model can forecast the survival condition definitely.
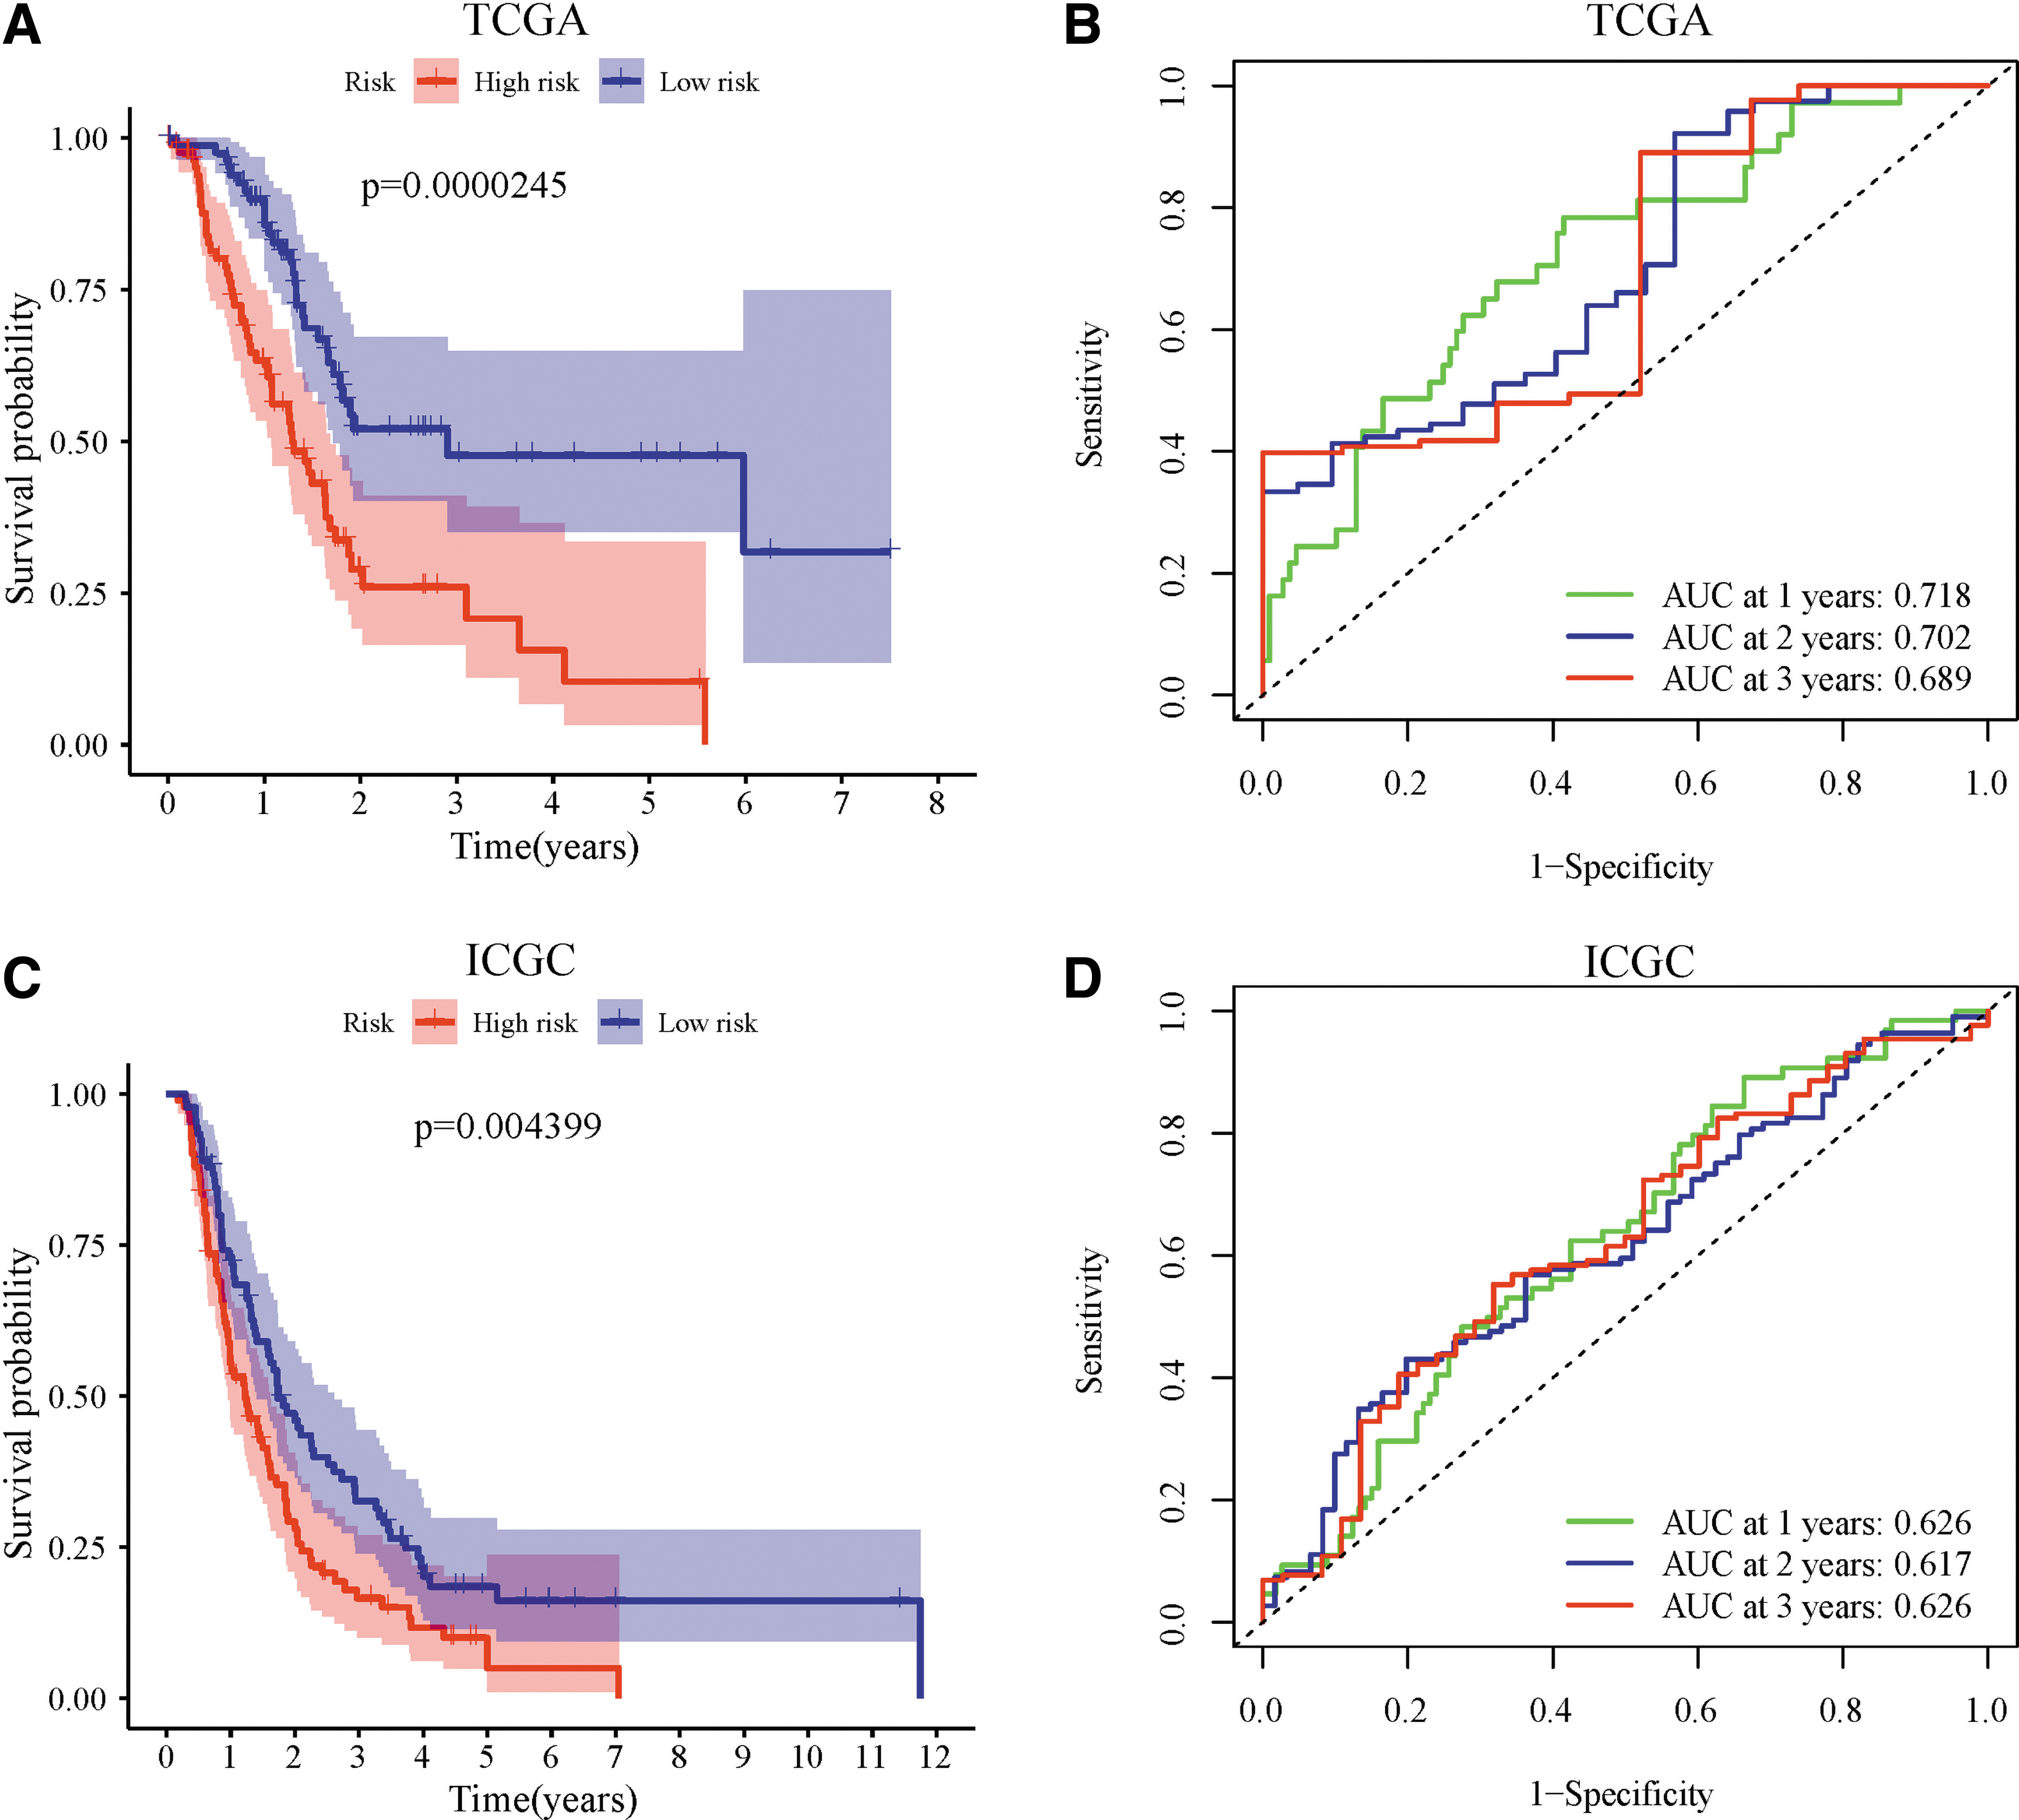
Construction of the prognostic model in TCGA cohort and external validation in ICGC cohort.
Prognostic value of FRGs risk model in PAAD
The univariate Cox regression model was used to analyze the relationship between OS, age, gender, grade, stage, and 7-FRG risk signature in the TCGA cohort (Fig. 4A). The risk signature could act as an independent prognostic factor for OS in the TCGA in the multivariate analysis (hazard ratio [HR] = 3.543, 95% confidence interval [CI] = 2.1315.890, p < 0.001) (Fig. 4B).
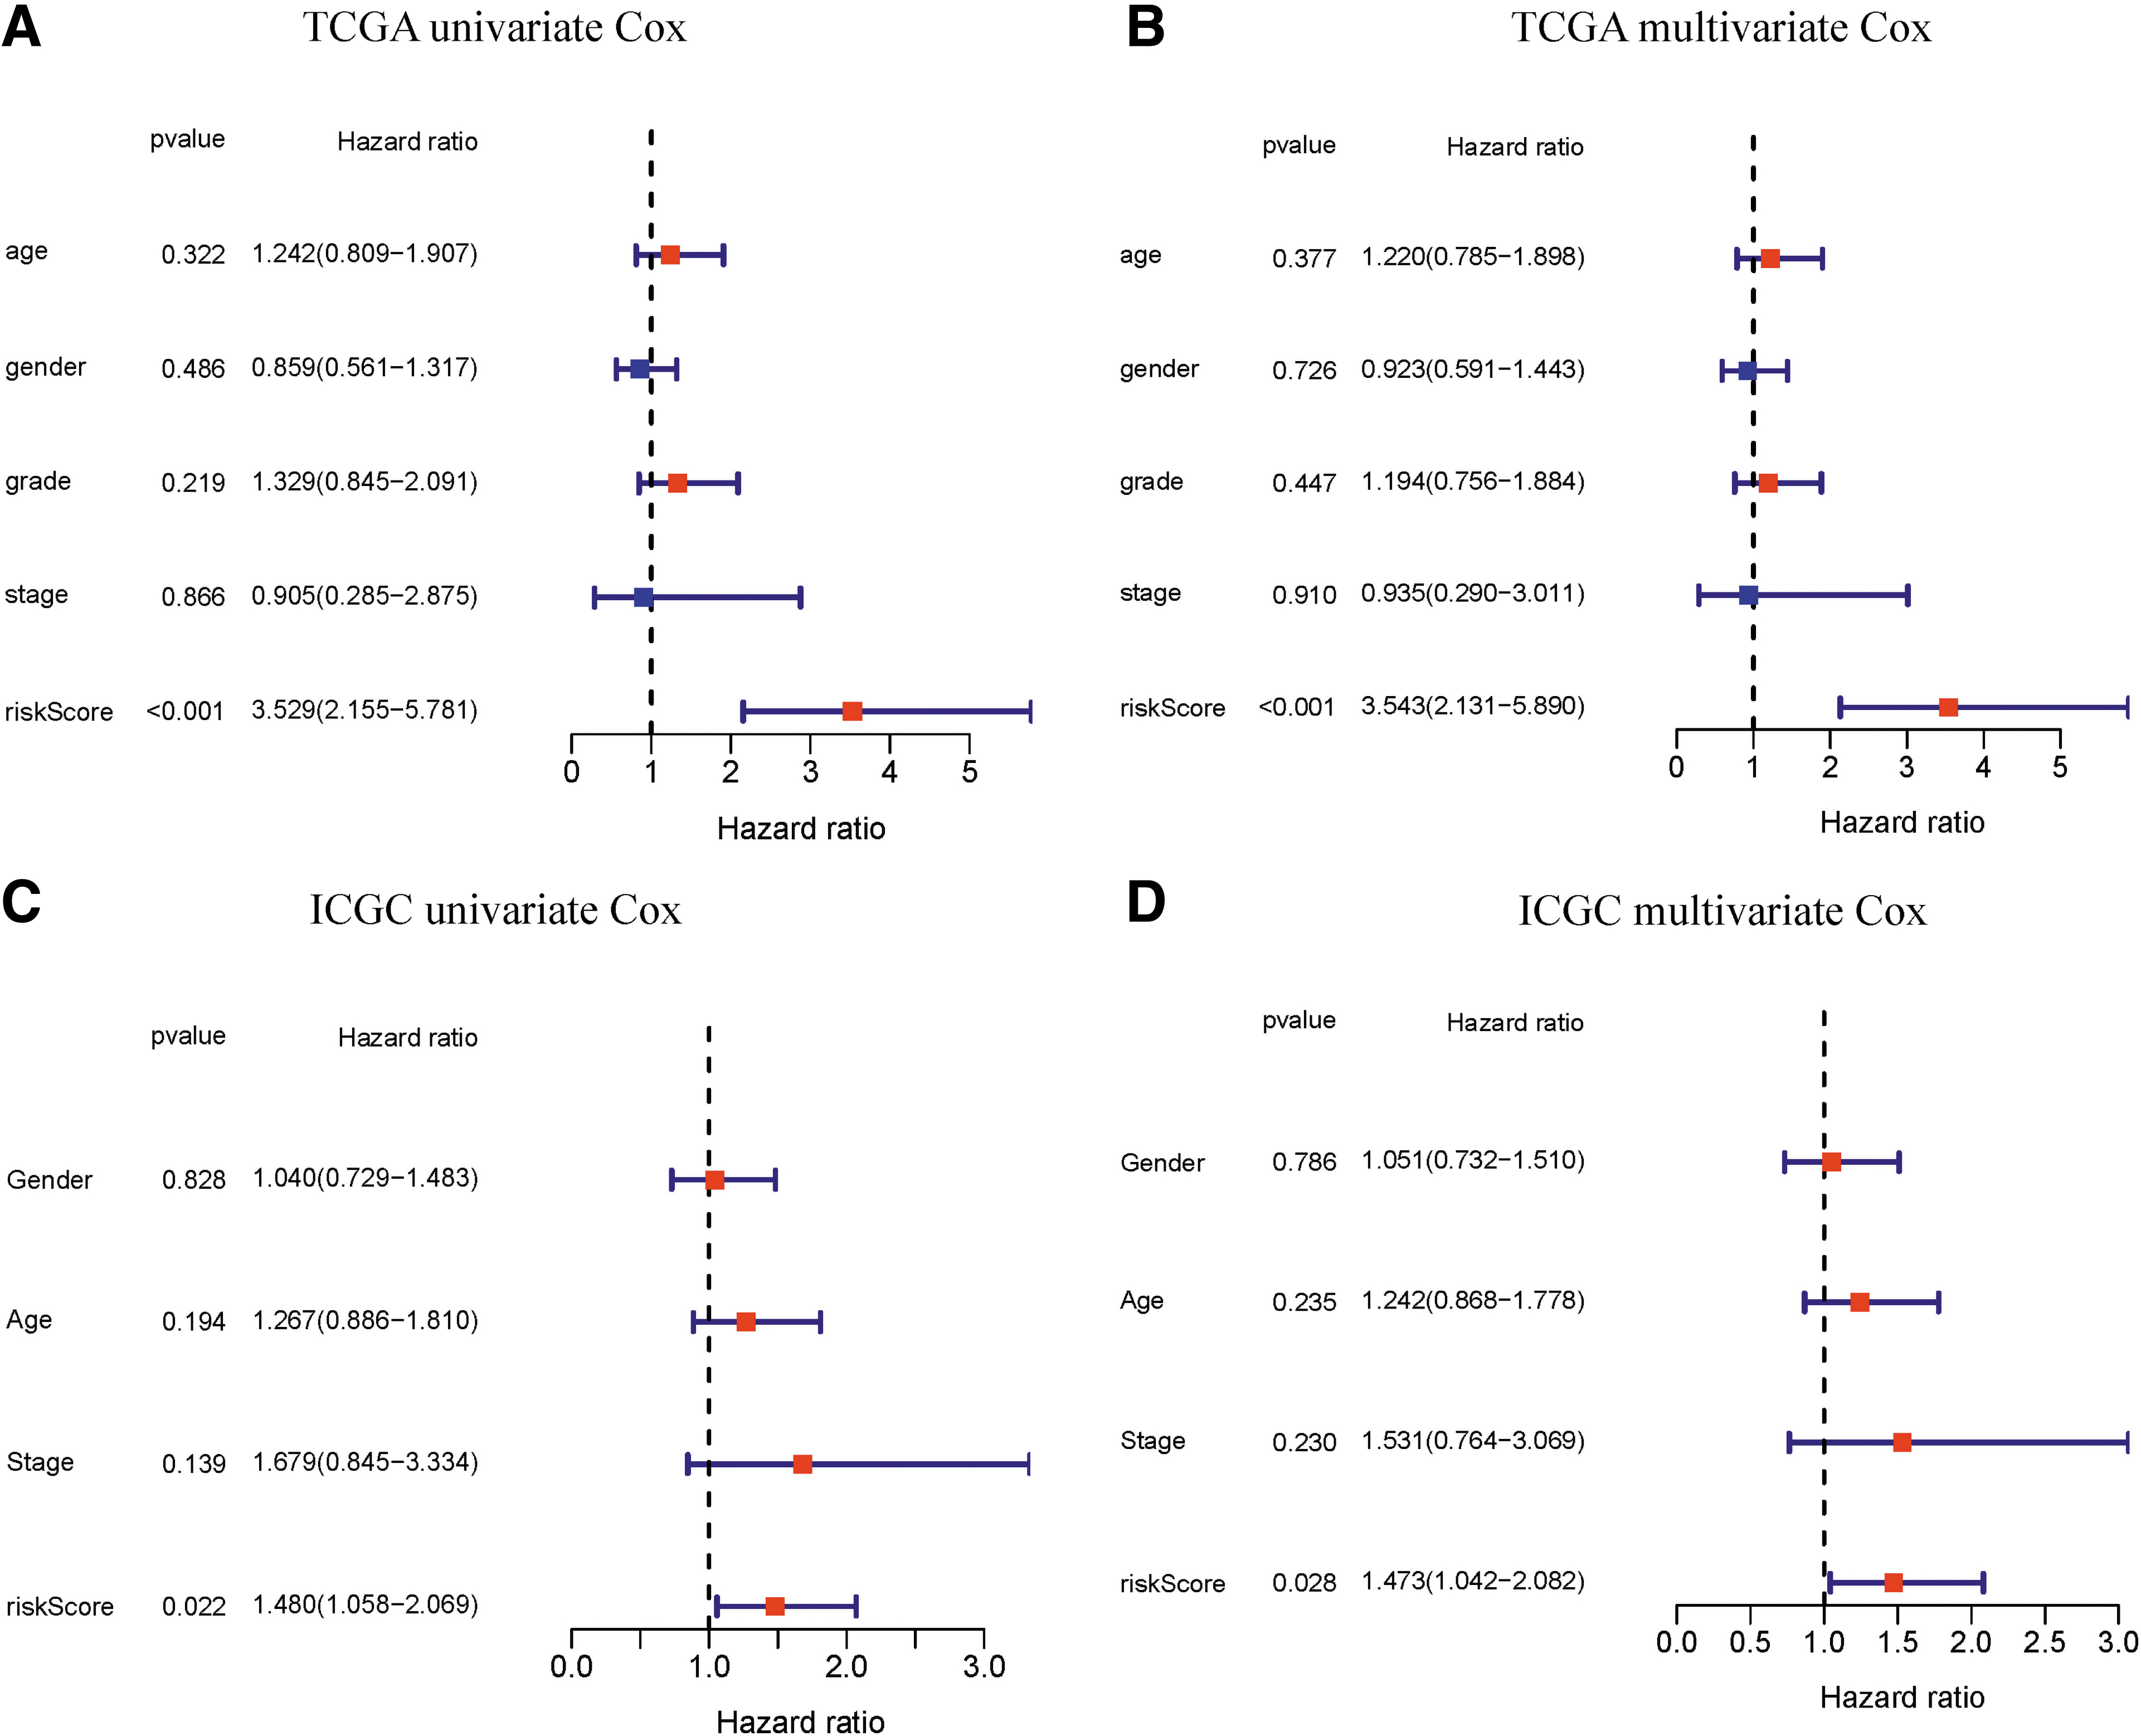
The risk score generated from the FRG genes demonstrated as an independent indicator in PAAD.
The risk score was also an effective predictor in the ICGC cohort, as evidenced by univariate (HR = 1.480, 95% CI = 1.058-2.069, p = 0.022) (Fig. 4C) and multivariate (HR = 1.473, 95% CI = 1.042-2.082, p = 0.028) Cox regression analyses (Fig. 4D). Then, we validated the nomogram in the TCGA-PAAD cohort (Supplementary Fig. S1E) and performed the calibration curves of the nomogram (Supplementary Fig. S1F, G), which showed great consistency between the predicted OS rates and actual observations.
FRGs involved in chemoresistance
Through comprehensive research of the correlation between gene expression and drug sensitivity in The NCI-60 cell lines dataset (Fig. 5A) and GDSC (Fig. 5B), we found that FRGs, especially the seven prognostic ferroptosis-related DEGs mentioned earlier, have an intimate relationship with drug sensitivity.

FRGs involved in chemoresistance.
To investigate the role of 70 FRGs in PAAD chemoresistance, we searched two chemotherapy-resistant PAAD cell line datasets in GEO (GSE73978 and GSE80617). There are seven genes that express cisplatin-resistant cells and cisplatin-sensitive cells differently (Fig. 5C). Similarly, 11 sense genes were identified in the gemcitabine-resistant dataset (Fig. 5D). Then, we took the intersection and finally determined that four genes (SLC7A11, SAT1, GCLM, and SLC40A1) were significantly associated with cisplatin and gemcitabine resistance (Fig. 5E).
Identifying the role of SAT1 in PAAD chemosensitivity by bioinformatics
Interestingly, SAT1 was consistently downregulated in cisplatin- and gemcitabine-resistant cells (Fig. 6A). Then, we divided patients in the TCGA-PAAD cohort into SAT1 high-expression group and low-expression group and compared the DEGs (Fig. 6B). We found 565 DEGs (FDR <0.05, (|log2FC| > 2), including 485 upregulated and 80 downregulated genes in SAT1 high-expression group. To further detail the function of DEGs mentioned earlier, we conducted GO and KEGG pathway enrichment analysis. Apoptosis, cell cycle, glutathione metabolism, and oxidative phosphorylation pathways were enriched (Fig. 6C, D).
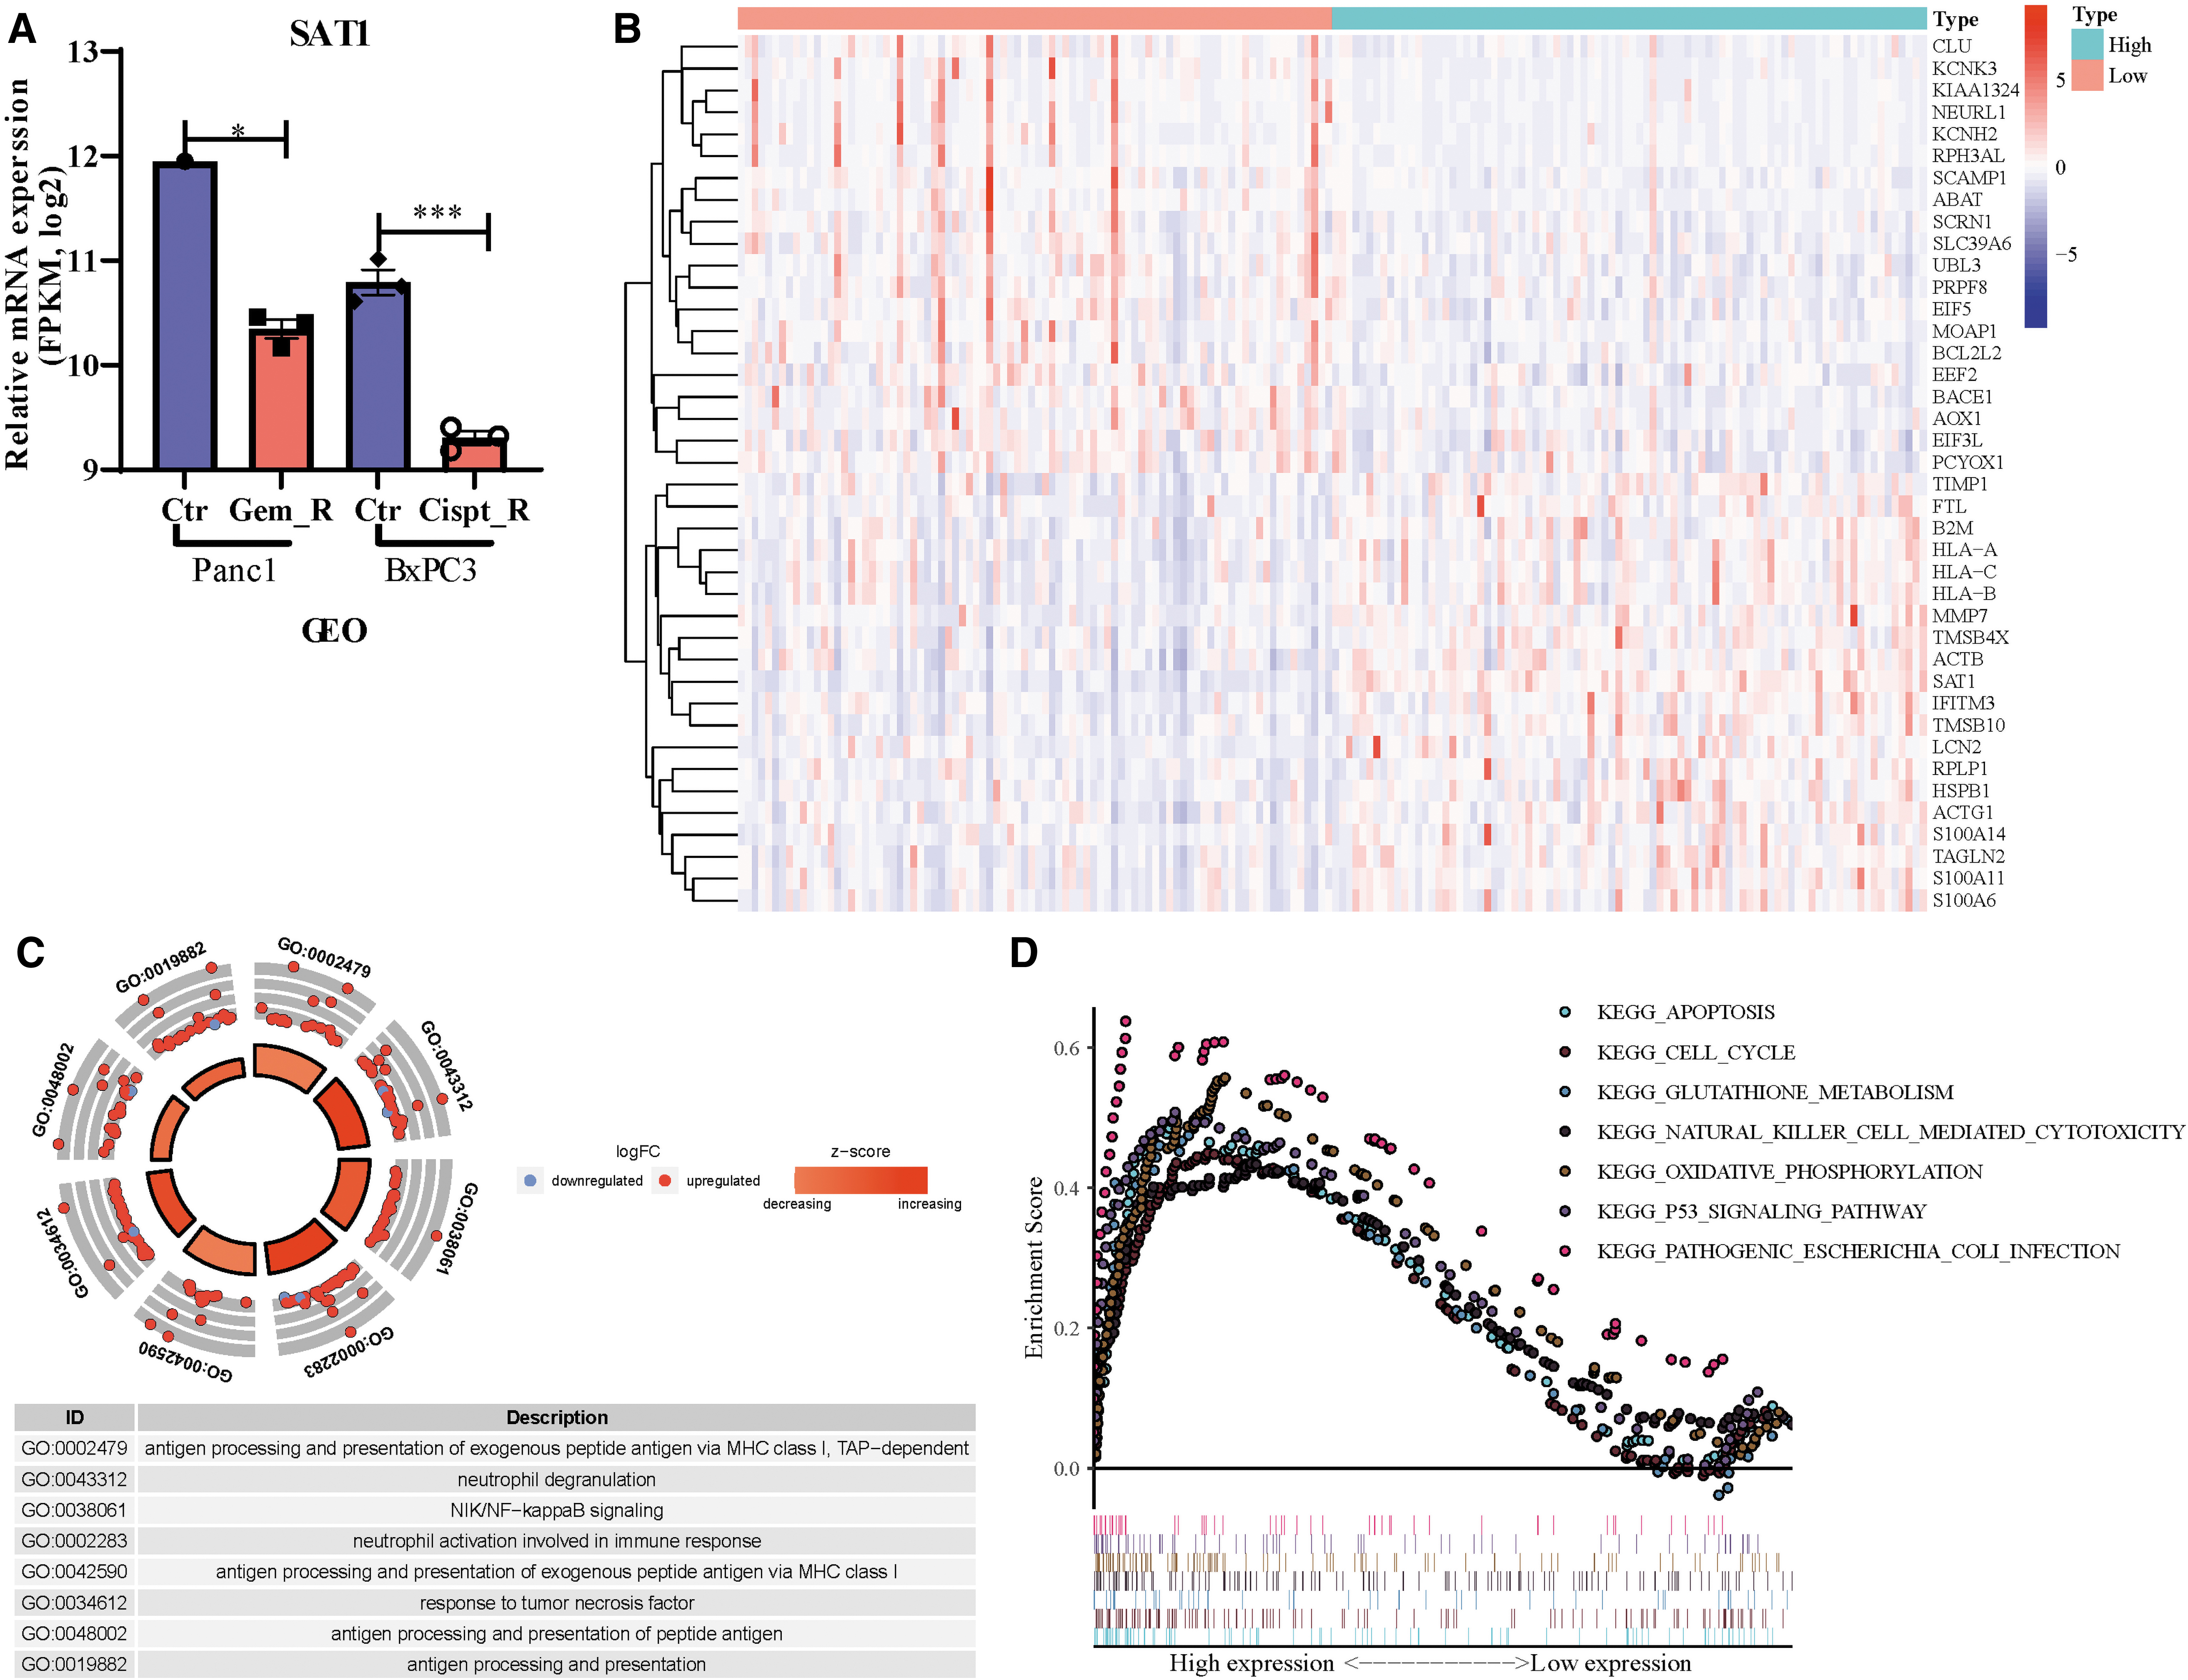
SAT1 investigated as one of the chemotherapeutic-resistant related FRGs.
The combination of cisplatin and gemcitabine can induce ferroptosis by elevated SAT1
We treated AsPC1 cells with cisplatin and gemcitabine and found that the combination can induce significant cell death (Fig. 7A). Then we determined the features of ferroptosis on the cells treated with chemotherapy drugs (Fig. 7B, C). The level of cellular lipid ROS significantly increased on cisplatin but not gemcitabine (Fig. 7B). On the other hand, gemcitabine-treated cells exhibited more intracellular Fe2+, whereas cisplatin-treated cells showed no significant difference (Fig. 7C).
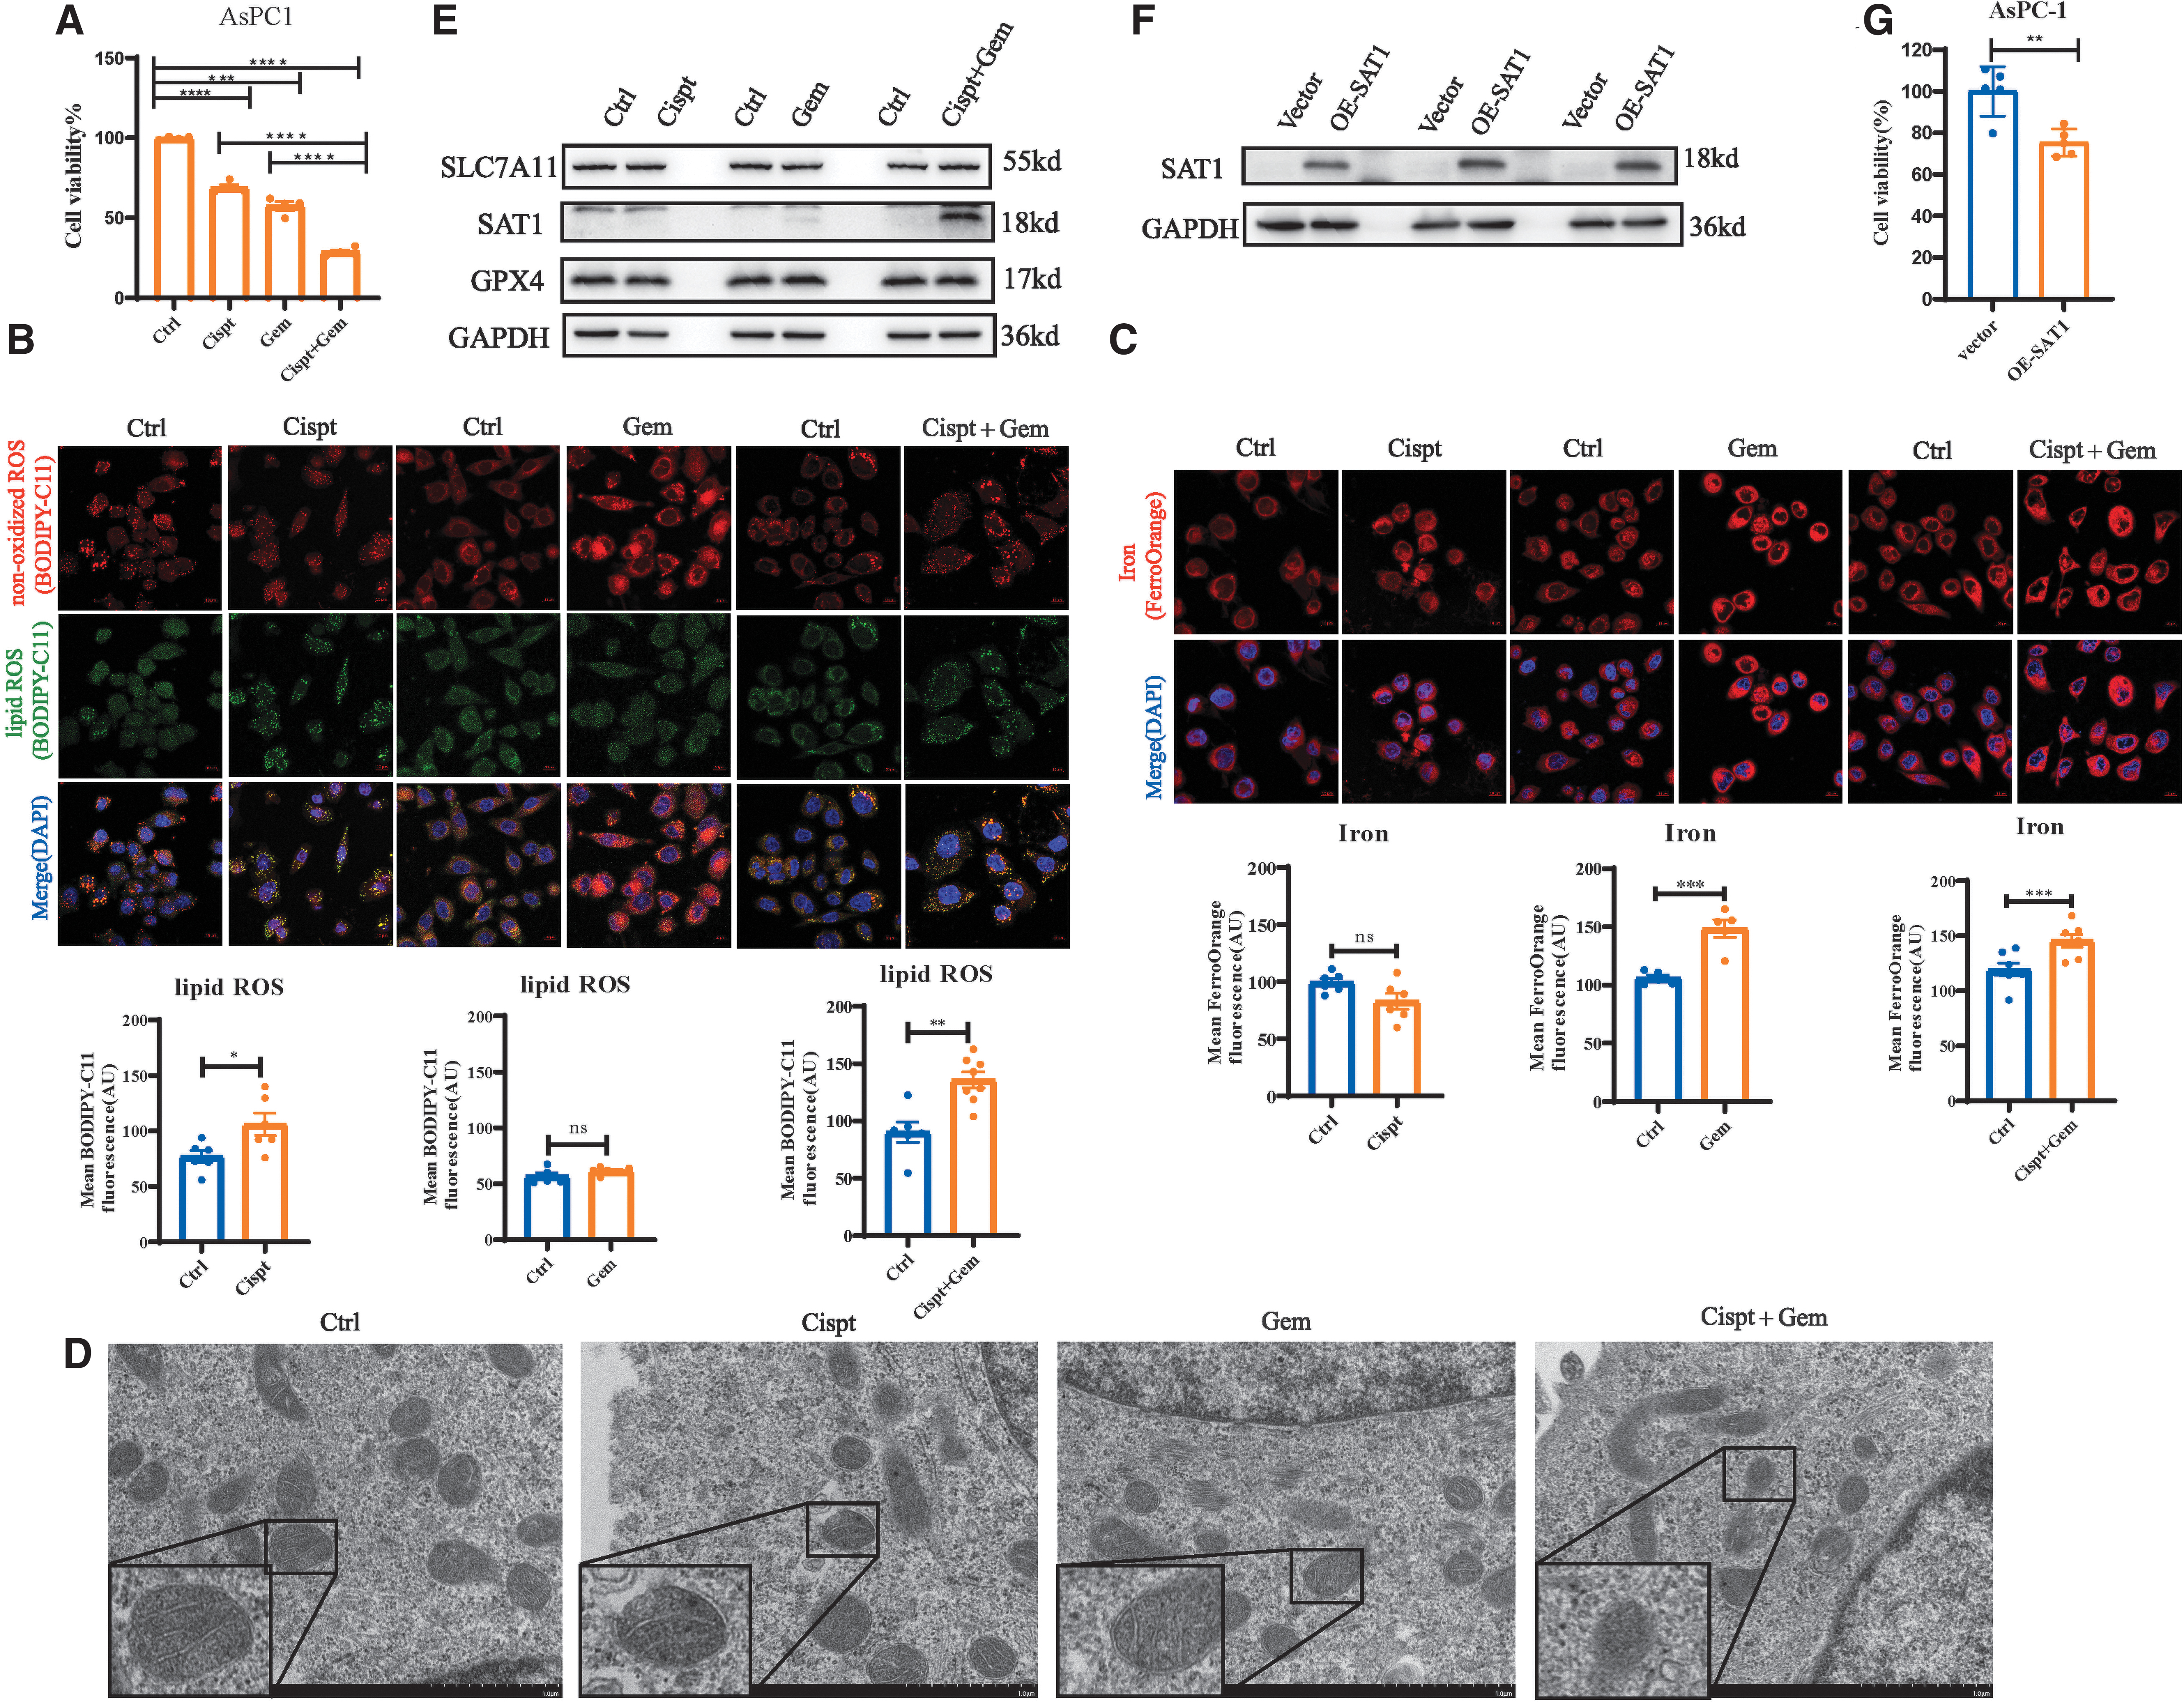
The combination of cisplatin and gemcitabine can induce ferroptosis by elevated SAT1.
Then, we used gemcitabine and cisplatin combinations to treat cells and found that both lipid ROS and intracellular Fe2+ were increased remarkably (Fig. 7B, C). The transmission electron microscope images revealed that the changes in the morphology of mitochondria in cells treated with the combination dwindle in size, result in the reduction or disappearance of mitochondrial cristae, and exhibit some structural damage.
However, the morphology of mitochondria in cells treated with cispt or gem showed no significant change compared with the control group (Fig. 7D). These findings suggested that the combinations rather than cisplatin or gemcitabine alone could induce ferroptosis.
We further explored how chemotherapy drugs induced ferroptosis in PAAD. Since chemotherapeutic drugs such as platinum derivatives can induce SAT1 (Hector et al., 2004) and SAT1 is defined as a ferroptosis positive regulator (Ou et al., 2016), we examined SAT1 expression on the administration of chemotherapy drugs. On the addition of the combinations, SAT1 protein level was increased significantly, but no obvious SAT1 was observed on cisplatin or gemcitabine induction (Fig. 7E).
Then, we overexpressed the SAT1 (Fig. 7F) and found that the cell viability was decreased (Fig. 7G). In addition, GPX4 and SLC7A11, central regulators of antioxidant response in ferroptosis by glutathione metabolism, exhibited no change on chemotherapy drug treatment (Fig. 7E), which indicated that the ferroptosis induced by the combination was independent of the GPX4 or SLC7A11 pathway. Taken together, these data demonstrate that the combination of cisplatin and gemcitabine can induce ferroptosis by elevated SAT1.
Discussion
Due to the rapid progression of PAAD, mortality still remains at a high level in the world. It is essential to predict the prognosis of PAAD and give corresponding treatments in time. Accordingly, regulating ferroptosis pharmacologically or genetically renders new opportunities to improve cisplatin or gemcitabine sensitivity (Zhu et al., 2017; Lee et al., 2020; Ye et al., 2021). Previous studies have confirmed that ferroptosis is an effective mechanism for inducing PAAD cell death (Badgley et al., 2020), but its specific molecular changes and mechanism are not fully understood.
In this study, we found that the prognosis model constructed by seven genes (TFRC, SLC39A8, MAP1LC3A, ALOX15, PROM2, SAT2, and SAT1) independently predicted the prognosis of patients with PAAD with superior prediction performance. Besides, the corresponding nomogram based on the seven-gene model also helps clinicians make better clinical decisions and develop treatment strategies.
Among these seven genes, TFRC encoded transferrin receptors (TFR), a membrane glycoprotein, which can import iron and maintain iron homeostasis (Lopez et al., 2016). Ryschich et al. (2004) investigated specimens of human pancreatic cancer and concluded that TFR is a marker of the malignant phenotype.
SLC39A8, a member of the SLC39 family of solute-carrier genes, is a transporter for zinc, cadmium, and other essential trace nutrients (Park et al., 2015).
Wang and Zhou (2010) demonstrated that SLC39A8 mediates the uptake of iron from ferric citrate, the predominant form of non-transferrin bound iron (NTBI) in the plasma of individuals with iron overload. SLC39A8 might play a key role in keeping the balance of iron in pancreatic cells, as the pancreas is one of the major organs clearing NTBI (Knutson, 2019).
As an autophagosome marker and a measure of autophagic flux (Klionsky et al., 2016), MAP1LC3A could involve ferritinophagy, a selective autophagy to degrade ferritin, and release iron into the cell to activate ferroptosis (Mancias et al., 2014; Levy et al., 2017).
Regarding ALOX15, it is a lipoxygenase for polyunsaturated fatty acids and generates a number of bioactive lipid metabolites (Singh and Rao, 2019). Shintoku et al. (2017) detected the ALOX15 activator enhanced ferroptosis of Panc-1 cells treated with low concentrations of RSL3.
As a transmembrane glycoprotein, PROM2 can stimulate iron export to drive ferroptosis resistance (Brown et al., 2019).
Li et al. (2020) have provided evidence that PROM2 promotes gemcitabine chemoresistance via activating the Akt signaling pathway in pancreatic cancer and identified PROM2 as a biomarker for the poor prognosis in PAAD.
The proteins encoded by SAT1 and SAT2 belong to the acetyltransferase family. SAT1 is the enzyme in the catabolic pathway of polyamine metabolism. Ou et al. (2016) have suggested that SAT1 is a transcription target of p53, and activation of SAT1 expression induces lipid peroxidation and sensitizes cells to undergo ferroptosis. Nevertheless, the roles of SAT1 and SAT2 in PAAD remain largely undefined.
The results of drug sensitivity analysis suggested that SAT1 was strongly correlated with drug sensitivity. SAT1 was downregulated in cisplatin- and gemcitabine-resistant PAAD cells based on the gene expression in the GEO dataset. Similarly, some studies have found a much lower expression level of SAT1 in cisplatin-resistant cells than cisplatin-sensitive cells in bladder cancer (Yeon et al., 2018) and ovarian cancer (Marverti et al., 2001).
In consideration of SAT1 also being one of the model genes used earlier to predict survival, we proposed that SAT1 plays a more significant role in PAAD chemotherapy. The gene enrichment analysis revealed that SAT1 might regulate cell redox system and glutathione metabolism, both of which were essential in the biological metabolism for ferroptosis. Thus, we speculate that the high expression of SAT1 in PAAD is related to drug resistance through sensitizing cells to ferroptosis.
Previous research revealed that cisplatin resistance was correlated with ferroptosis (Zhang et al., 2020), and cisplatin was found to be an inducer for ferroptosis (Guo et al., 2018; Hu et al., 2020; Mei et al., 2020). In addition, Ye et al. (2021) demonstrated that ferroptosis inducers could significantly potentiate the cytotoxic effect of gemcitabine. However, whether ferroptosis participates in cisplatin and gemcitabine treatment of PAAD has not been defined.
Given the increased lipid ROS and intracellular Fe2+ induced by cisplatin plus gemcitabine, we concluded that the combination could induce ferroptosis in PAAD. And the elevation of SAT1 protein level indicated that SAT1 played a vital role in this process. To our knowledge, we are the first to validate that cisplatin plus gemcitabine can induce ferroptosis in PAAD.
There are still some limitations in our study. First, we used the external data set for verification, but the prognostic model still needs to be verified in a large-scale and multicenter clinical cohort. Second, only cells were used in our study, and the results need to be verified further with in vivo experiments. Finally, due to SAT1 status as a polyamine metabolism enzyme, it is necessary to investigate whether polyamine metabolism is also involved in ferroptosis, and we are carrying on experiments to explore it.
Conclusion
Our 7-FRG signature has significant value in predicting the PAAD patients' OS. Moreover, we found that SAT1, as one of the signature genes, is relative to chemotherapy drug-induced ferroptosis, which also brings new insights into the molecular mechanisms of chemotherapy in PAAD.
Footnotes
Authors' Contributions
W.W., Q.H., and Q.Z. designed the study. W.W. and Q.U. collected the data. M.L. and W.L. analyzed the data. Y.L. and J.Y. carried out the experiments in vitro. S.D. and Y.P. supervised the data and provided statistical advice. W.W. and Q.H. wrote the article. Q.Z. and L.L. reviewed the article. All authors approved the final article.
Ethical Approval
The study did not involve animal experiments and human specimens, and there were no ethics-related issues.
Availability of Data and Materials
All the analysis data were accessed from TCGA database (
Disclosure Statement
No competing financial interests exist.
Funding Information
This work was supported by the National Natural Science Foundation of China (nos. 81870390 and 8180032142) and the Discipline and Platform Construction Project of Zhongnan Hospital of Wuhan University (no. ZLYNXM202017).
Supplementary Material
Supplementary Figure S1
References
Supplementary Material
Please find the following supplemental material available below.
For Open Access articles published under a Creative Commons License, all supplemental material carries the same license as the article it is associated with.
For non-Open Access articles published, all supplemental material carries a non-exclusive license, and permission requests for re-use of supplemental material or any part of supplemental material shall be sent directly to the copyright owner as specified in the copyright notice associated with the article.
