




Abstract
The aim of this study was to study the relationship between the methylation level of the promoter region of follicle-stimulating hormone receptor (FSHR) gene and the mRNA expression of Duolang sheep fed different energy diets. In this experiment, three groups of diets with different energy levels (dietary nutrient level reference (NY/T816 - 2004)) were designed to obtain medium energy level diets with metabolic energy of 10.88 MJ/d. The treatments with high and low energy levels increased and decreased by 15%, 12.51, and 9.25 MJ/d, respectively, on the basis of medium energy level. Total RNA and genomic DNA were extracted from the ovaries of Duolang sheep, and qPCR was performed. Bisulfite genomic sequencing PCR and sequence alignment were used to detect the relationship between the relative expression level of FSHR and methylation. The results showed that the expression of FSHR in high-energy group and medium-energy group was significantly higher than that in low-energy group (p < 0.01), and there was no significant difference between high-energy group and medium-energy group (p > 0.05). The methylation rate of the target fragment in the promoter region of FSHR gene was 41.67% in the high-energy group, 75.00% in the medium-energy group, and 83.33% in the low-energy group. This study revealed that different dietary energy levels had certain effects on DNA methylation level of FSHR gene and then affected gene expression, and the expression level was negatively correlated with methylation level.
Introduction
Duolang sheep is an excellent meat-fat dual-purpose sheep breed unique to southern Xinjiang. Because of its early sexual maturity, prominent double lamb rate, and high reproductive survival rate, it has always attracted people's attention. During the development of sheep breeds, many traits come from different selection pressures and become permanent attributes (Arandas et al., 2017). Nutrition level is highly correlated with productivity and reproductive maturity to better ensure that animals achieve faster slaughter weight or show developmental characteristics to enter the reproductive stage in advance. Studies have found that malnutrition in ewes 6 months before ovulation has a negative impact on ovulation. Studies have found that malnutrition in ewes 6 months before ovulation has a negative impact on ovulation. It is well known that animal life is essentially a process of gene expression.
Although these processes are genetically precoded, dietary nutrition is the “driving force” of these processes. One of the ultimate goals of animal nutrition research is a thorough understanding of how dietary nutrition affects or drives genetic coding in animal lives (Sato, 2016). In addition, nutrition interacts with gene expression, which is involved in the regulation of animal behavior. Nutrition genomics is applied to cellular and molecular responses of animals to various dietary nutrients, revealing the global impact of nutrition on animal genomes, methylsome/epigenetic genomes, transcriptomes, proteins, and metabolic groups (Pareek et al., 2011).
Further, a thorough understanding of animal gene expression driven by dietary nutrients can be regarded as the basis of advanced animal nutrition research. Animal performance depends on the interaction of genotype, nutrition, and physiological conditions. Among the effects of nutrition on sheep production, energy supplements affect weight gain, which is essential for the function, cellular activity, and metabolism of important organs, as well as nutritional utilization and reproductive processes (Mahgoub et al., 2000). However, in the context of physiological reactions that determine the growth, development, and health of livestock, the role of epigenetics and its effect on potential cellular mechanisms remain to be fully elucidated. DNA methylation has been most studied in livestock, with major concerns being the total supply of nutrients such as methionine, folic acid, betaine and choline, or mothers (i.e., excessive or restricted) (Anderson et al., 2012).
It is essential for normal development and participates in various biological processes, such as gene expression regulation, genomic imprinting, X chromosome inactivation, repetitive element suppression and carcinogenesis (Li and Zhang, 2014). Although current studies on pigs, cattle, and small ruminants have provided evidence that maternal dietary energy levels, carbohydrate types or intestinal supply of methyl donors can cause tissue and molecular changes in embryos, fetuses or newborns, few data have linked epigenetics to biochemical and physiological results. This experiment will further explore the relationship between dietary energy levels and epigenetic, physiological, and developmental outcomes through the relationship between DNA methylation levels and expression levels of the follicle-stimulating hormone receptor (FSHR) gene promoter region in the diestrus of Duolang sheep at different energy dietary levels. These findings can understand the efficiency of nutrient use and the effects of livestock health and reproductive efficiency.
Materials and Methods
All experimental animals conducted animal research in accordance with the regulations and guidelines for experimental animals formulated by the Ministry of science and technology and the guidelines of animal Ethics Committee (SYXK 2018-009).
Materials
Test main reagents
Blood/Tissue/Cell Genome Extraction Kit (DP304) and Fluorescence Quantitative Kit (Q201) were purchased from Tiangen Biochemical Technology Co. Ltd. Red blood cell lysate (RT122), DL700 (2000) molecular weight Marker, Hotstarttaq polymerase, agarose, fast AGAR gel DNA recovery kit, pMD19-T carrier, EDTA, anhydrous ethanol, reverse transcription Reagent box, TRIzol reagent, and so on were purchased from TAKARA. Isopropanol, glacial acetic acid, and chloroform were purchased from Zhiyuan, Tianjin. The methylation kit (EZ DNA Methylation-Goldkit D5005) was purchased from Zymo Research company.
Main instruments
Ultralow temperature refrigerator of −80°C: (brand Thermo ExF24086V) low temperature and high-speed freezing centrifuge: (brand Sigma 3K30) clean bench: (brand Boxum SHC-CT-22) high-pressure steam sterilizer: (TOMY SX-500) nucleic acid concentration detector: (brand Thermo ND-One) PCR instrument: (brand BIO R AD model C100) constant temperature incubator: (brand Shanghai yiheng model MCO-15A) qPCR instrument: (brand BIO RAD model CFX96) gel imaging system: (brand Hisense kelon model GelDoc 2000) constant temperature water bath pot: (brand Shanghai boxun model HHS-21-4)
Reagent preparation
The reagent was prepared with sterilized distilled water as solvent under high-pressure sterilization conditions. High-pressure steam sterilization 30 min. Other reference “Guide to Molecular Cloning Experiment” third edition Li Zai Equality (Zaiping, 2002).
Experimental animals and design
The experimental sheep are uniformly raised in the leading sheep breeding base in Yingjisha County, Kashgar, Xinjiang. Single factor experiment design was used to randomly divide 36 Duolang ewes with good health, disease-free health, and similar weight into three groups. The middle energy group was fed with diets designed according to the energy requirement in the Chinese mutton sheep feeding standard (NY/T-2004). Medium energy level was 10.88 MJ/d. The high- and low-energy groups increased and decreased by 15%, 12.51, and 9.25 MJ/d, respectively, on the basis of the middle energy level. Except for different dietary energy levels, protein and other nutritional indexes in each group were basically consistent. Forage formula and nutritional level are given in Table 1
Feed Formula and Nutrients
The medium energy level was 10.88 MJ/d according to the Chinese mutton sheep feeding standard (NY/T816 - 2004). The high- and low-energy groups increased and decreased by 15%, 12.51, and 9.25 MJ/d, respectively, on the basis of medium energy level. Other nutritional levels basically no difference in the case only change the energy level.
Note. Nutrition level was calculated.
Total RNA extraction
Laboratory animal management and sample collection
During the experiment, different energy diets were divided into three groups: high, medium, and low. During the experiment, the dietary except energy level was different, and other nutrients were basically the same. Weigh the weight on an empty stomach before morning feeding. According to the principle of similar weight, they are randomly divided into three groups. Each group is fed with high, medium, and low diet, respectively, once at 9:00 a.m. and 21:00 p.m. each sheep is fed with 1.1 kg diet every day, mixed with refined and coarse materials, free drinking water, and the pretrial period is 15 days.
The health status of the experimental sheep is observed during the prefeeding period, and the sick sheep are removed, ear marked, and recorded in time. Before the sheep are put into the house, the sheep house shall be comprehensively disinfected, and the sheep house shall be disinfected and cleaned regularly. One month before the start of the experiment, each sheep was injected with 1 ml ivermectin to repel insects.
Three diestrus sheep were selected from each experimental group for slaughter after 30 days of feeding test, and water was stopped 2 h before slaughter. After slaughter, ovarian samples were collected and labeled in different energy groups and different periods. Rinse with phosphate buffer for a moment and immediately freeze in liquid nitrogen until DNA and RNA are extracted.
Extraction and identification of RNA
The total RNA of Duolang sheep ovarian tissue was extracted by TRIzol method, and it was strictly extracted according to the instructions of TRIzol reagent. Before extraction, the ultraclean table and pipetting gun should be wiped with RNA-free alcohol cotton ball and irradiated with UV lamp for 20 min; mortar, tissue scissors, tweezers, etc. are wrapped in tin foil and then baked at 180°C for 4 h; the head and centrifuge tube were soaked overnight in 0.1% DEPC water and then autoclaved; the electrophoresis tank should first be cleaned with detergent, washed with distilled water, dried with ethanol, then filled with 3%H2O2, placed at room temperature for L0 min, and finally thoroughly rinsed with DEPC treatment water and dried with ethanol.
All operations were performed in a ventilated kitchen (DEPC was a strong carcinogen), incubated at 37°C for at least 12 h (overnight), and then sterilized by high-pressure steam at 0.15 MPa for 20 min to inactivate the remaining DEPC. After the extraction, 1% agarose gel was used to detect the quality of electrophoresis. The gel imager was used to observe the genomic RNA on the agarose gel, and the 28 s and 18 s RNA bands were clearly visible. For example, the amount of 28sRNA is about twice that of 18sRNA, indicating that RNA integrity is good. The concentration and purity of RNA extracted from sheep ovary tissue were detected by nucleic acid concentration detector, and photos were taken.
Synthesis of cDNA
The 20 μL reaction system was used, and the reagents in Table 2 were successively added into the 0.2 mL PCR tube.
Reaction System of Reverse Transcription
According to the instructions of the reverse transcription kit, the following components were added into the PCR tube and gently mixed in the PCR instrument at 42°C for 15 min. After 5 s at 85°C, they were placed on ice for subsequent test or stored at −20°C for further use.
The above components were gently mixed and reacted at 42°C for 15 min, 85°C for 5 s, then placed on ice for subsequent tests or stored at −20°C for later use.
PCR primer design
The FSHR and GAPDH Gene Sequences of sheep are from NCBI. The primers of FSHR gene are from the primer sequences reported by Jia Cunling et al. (2005). The internal reference gene GAPDH primers are designed by primer5 software according to the sheep mRNA sequence (gene ID: 443005). The primer sequence and parameters are shown in Table 3.
Parameters of Primer Pairs for the Target Genes
qPCR target gene and internal reference gene source, primer sequence, and fragment length.
Real-time fluorescent quantitative PCR
PCR amplification: PCR conditions (annealing temperature and cycle times) and competition control between primer pairs were optimized. The optimal reaction system was as follows: total volume 10 μL, including 2 × S6Universal SYBRqPCR mix 5 μL; 1 μL cDNA; downstream primer 0.25 μL each; sterilized water 3.5 μL; and the optimal PCR amplification condition was 95°C for 30 s, 94°C for 10 s, 61°C for 30 s, and a total of 40 cycles. The internal reference gene and the target gene were carried out in different PCR tubes to keep the reaction parameters consistent. After amplification, 2% agarose gel was used for electrophoresis to detect the quality, and gel imager was used to observe the size, position, and brightness of the target fragment.
Establishment of standard curve for screening primers
The cDNAs of samples No. 2 and No. 8 (4 μL each) were used as the templates for gradient dilution of 10, 100, 1000, and 10,000 times, respectively. After dilution, 1 μL each was used as the template, and the target gene primers and internal reference gene (GAPDH) primers were used for amplification, respectively. At the same time, the melting curve was analyzed at 60°C–95°C, and the standard curves of the target gene and internal reference gene were plotted. According to the amplification efficiency of the standard curve and the single peak of the dissolution curve, appropriate primers were selected for sample detection.
qPCR data analysis of gene expression
The expression level of target gene was detected and GAPDH gene was used as the internal reference. The target gene and the internal reference gene were set as negative controls (the template was H2O) to monitor the template contamination. At the same time, three parallel samples were set for each sample. The fluorescence quantitative PCR was performed on the Bio-Rad CFX96 fluorescence quantitative PCR instrument. The SYBR Green method was used to analyze the melting curve at 60°C–95°C. According to the original qPCR detection results, the relative quantitative results of the target genes of each sample were calculated by using the 2−△△ ct relative quantitative calculation formula, and then SPSS21.0 (ANOVA) software was used for statistical analysis.
Extraction and detection of genomic DNA
The genomic DNA of sheep ovarian tissue at different energy levels was extracted using the kit DP304 according to the steps. High-temperature and high-pressure sterilization and drying were done before extraction. After extraction, 2% agarose gel was used for electrophoresis detection. Gel imager was used to observe the size and brightness of genomic DNA fragments. Nucleic acid concentration detector was used to detect the concentration and purity of DNA extracted from sheep ovarian tissue and photographed.
Synthesis and prediction of primers for gene promoter region
With reference to the sheep FSHR gene sequence (Gene ID:443299), according to the FSHR gene promoter region, the MethPrimer online website (
Amplification and recovery and purification of gene promoter region
The methylation-treated sheep ovarian DNA was used as the template to set the optimal PCR amplification system for FSHR gene. The PCR amplification program was set as 35 cycles (denaturation at 94°C for 30 s, annealing at 55°C for 30 s, extension at 72°C for 1 min) and stored at 4°C for further use. After amplification, 2% agarose gel electrophoresis detection, abandon amplification failed primers and take photos to record. The product was purified according to the instructions of agarose gel purification kit.
T-A cloning and heat shock transformation
After PCR amplification of the promoter region of sheep FSHR gene, the recovered product was ligated with pMD19 - T vector, and DH5α competent cells were added for monoclonal screening.
Identification of positive clones
Overnight culture produced blue-white plaque. One milliliter LB liquid medium and 1 μL AMP were absorbed and added into 1.5 mL centrifuge tube. The full-white colonies were picked out with sterilized toothpicks or the end of a gun and placed into the centrifuge tube. The colonies were placed in a constant temperature shaker (37°C, 200 rpm) for vibration culture for about 8 h.
Statistical analysis
CpG methylation level = CpG methylation/CpG total site. QUMA (online software) was used to analyze the cloning and sequencing results.
Results and Analysis
Analysis of qPCR results
Total RNA extraction and cDNA synthesis
Total RNA was detected by nucleic acid concentration detector. The results showed that A260/A280 was between 1.80 and 2.00, and the concentration was above 100 mg/μL. The total RNA extracted was detected by 1% agarose gel electrophoresis. The results showed that 28S and 18S were clearly visible, and the concentration of 5S band was very low (Fig. 1), indicating that the quality and concentration of RNA were good, and subsequent experiments could be carried out.
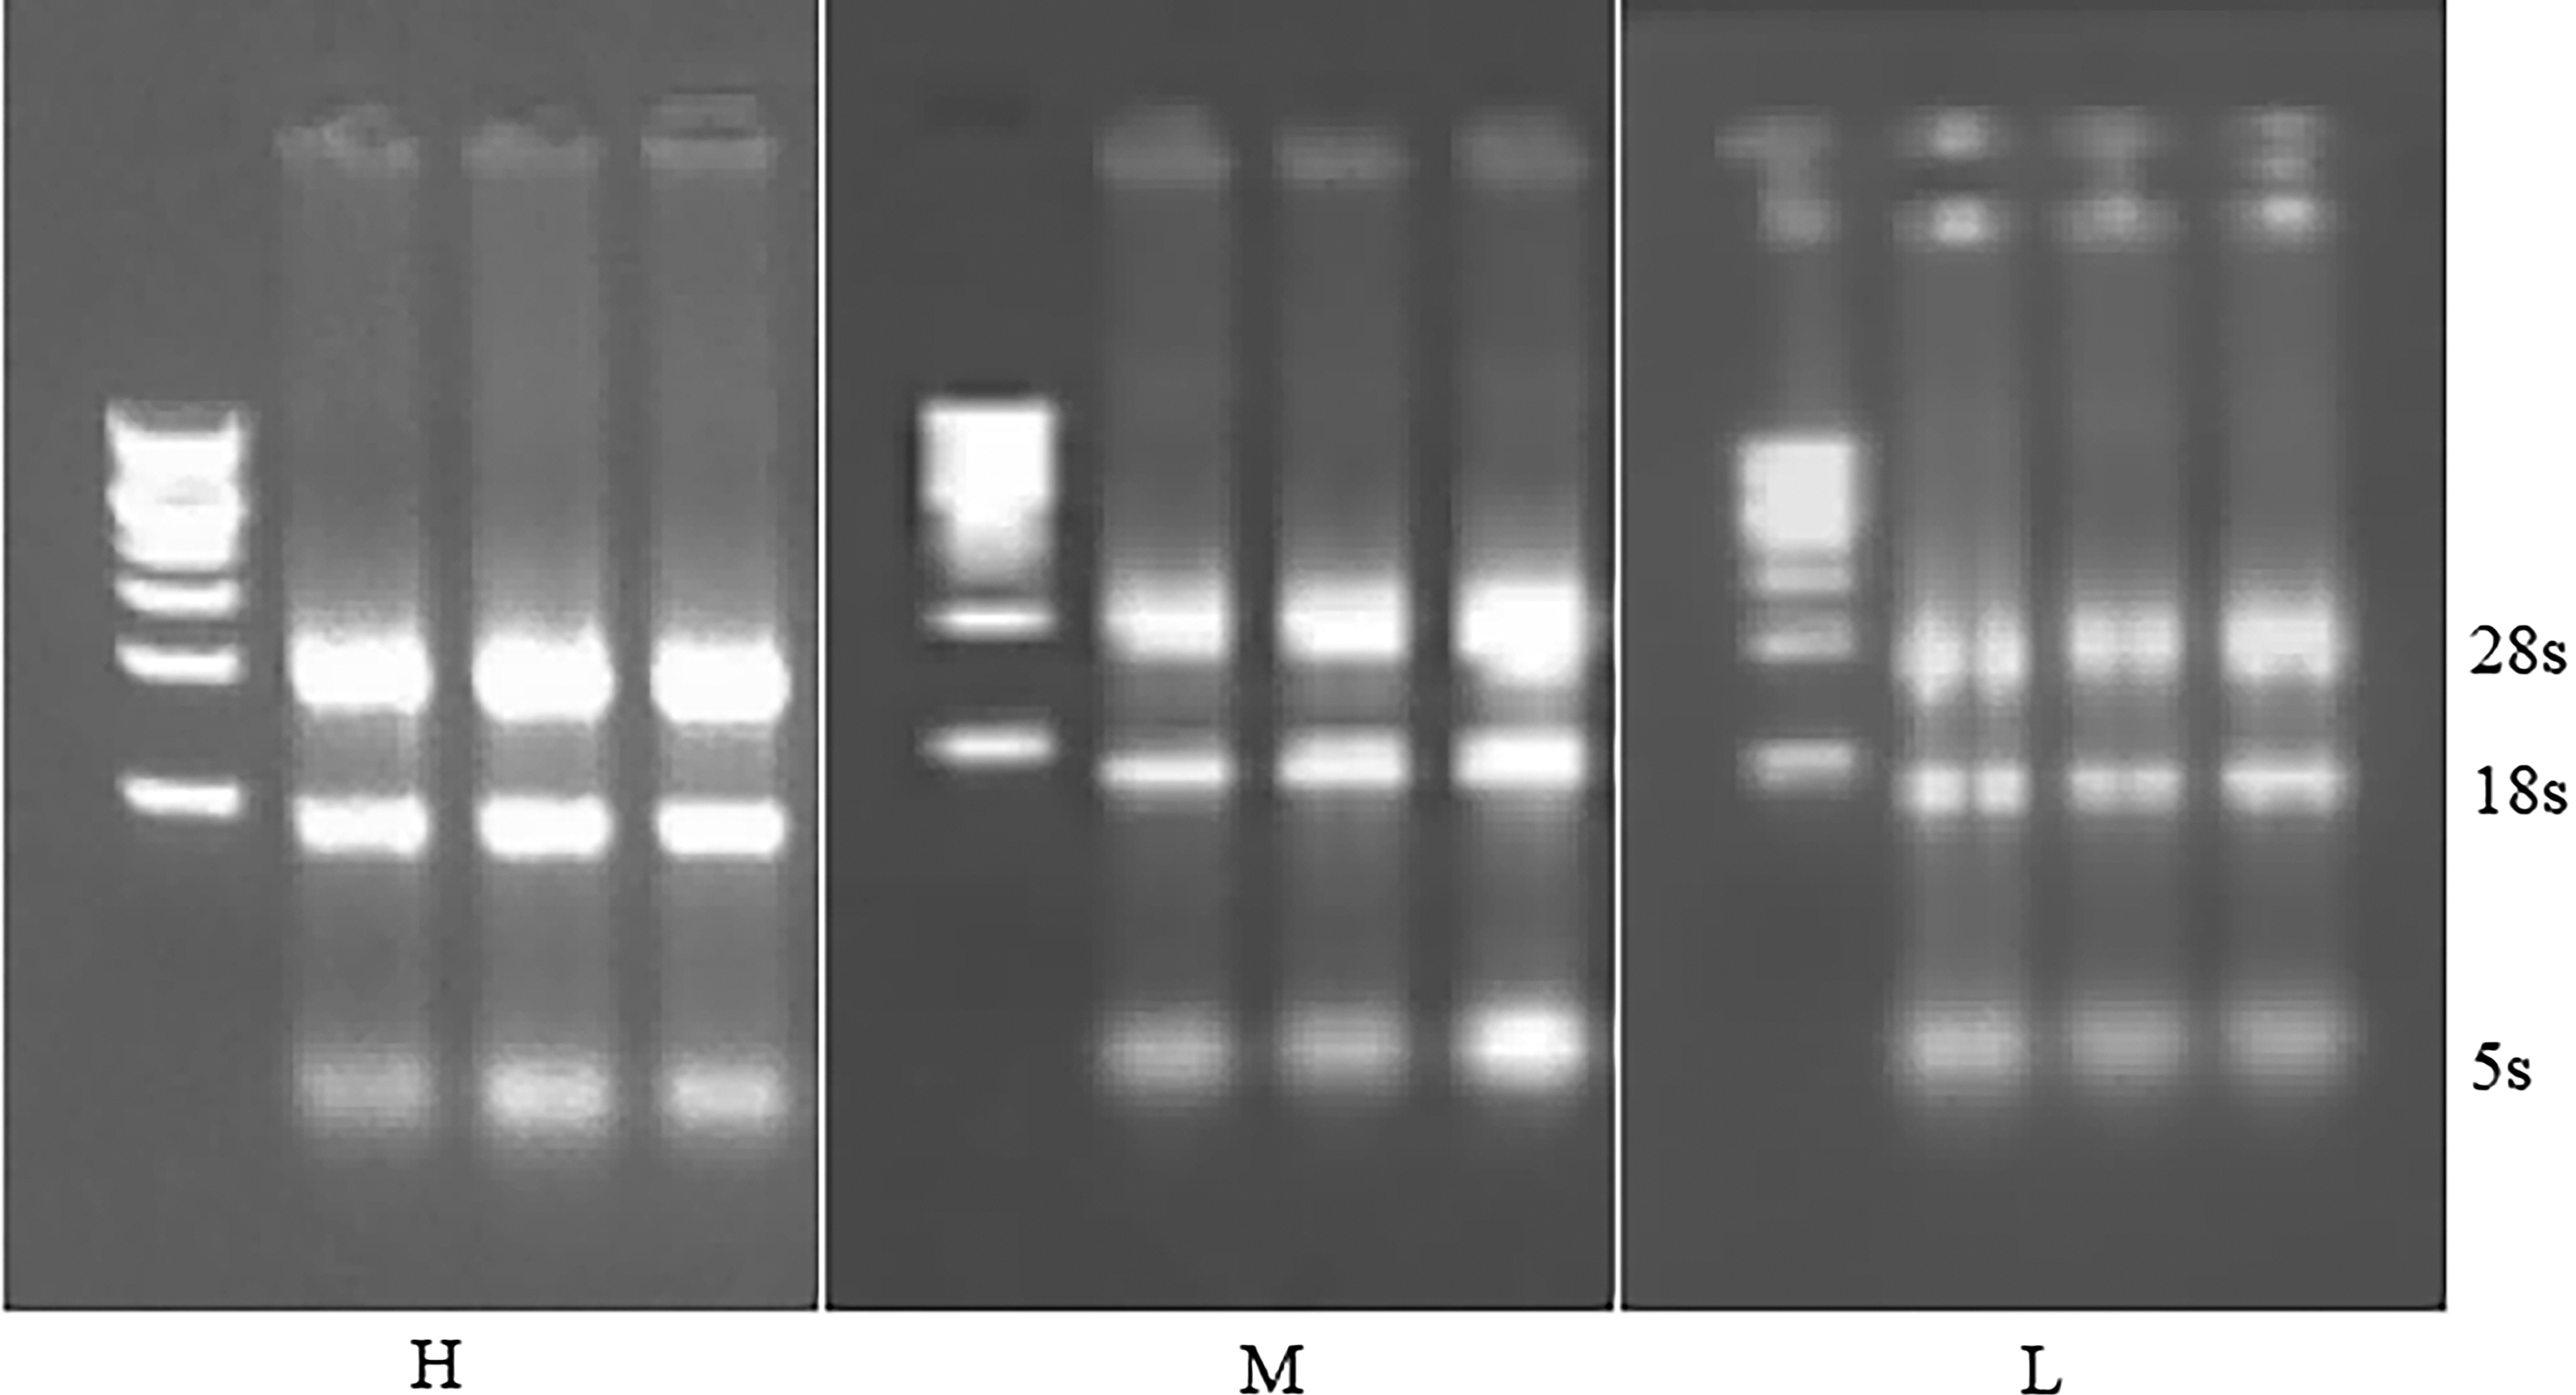
Result of agarose gel electrophoresis of total RNA from sheep. Total ribonucleic acid was extracted from ovarian tissue of diestrus Duolang sheep and detected by 1% agarose gel electrophoresis. The results showed that 28S and 18S were clearly visible, and the concentration of 5S band was very low, indicating that RNA quality and concentration were good, and subsequent experiments could be carried out. H, high-energy group RNA; M, medium-energy group RNA; L, low-energy group RNA.
Results of real-time fluorescent quantitative PCR
The amplification curves, dissolution curves and standard curves of FSHR and GAPDH genes are shown in Figures 2 –7.

Amplification curve of FSHR gene. FSHR gene amplification curve showed good specificity of primers. FSHR, follicle-stimulating hormone receptor.

Dissolution curve of FSHR gene. There was only one main peak in the melting curve of FSHR gene, and there was no nonspecific miscellaneous peak.
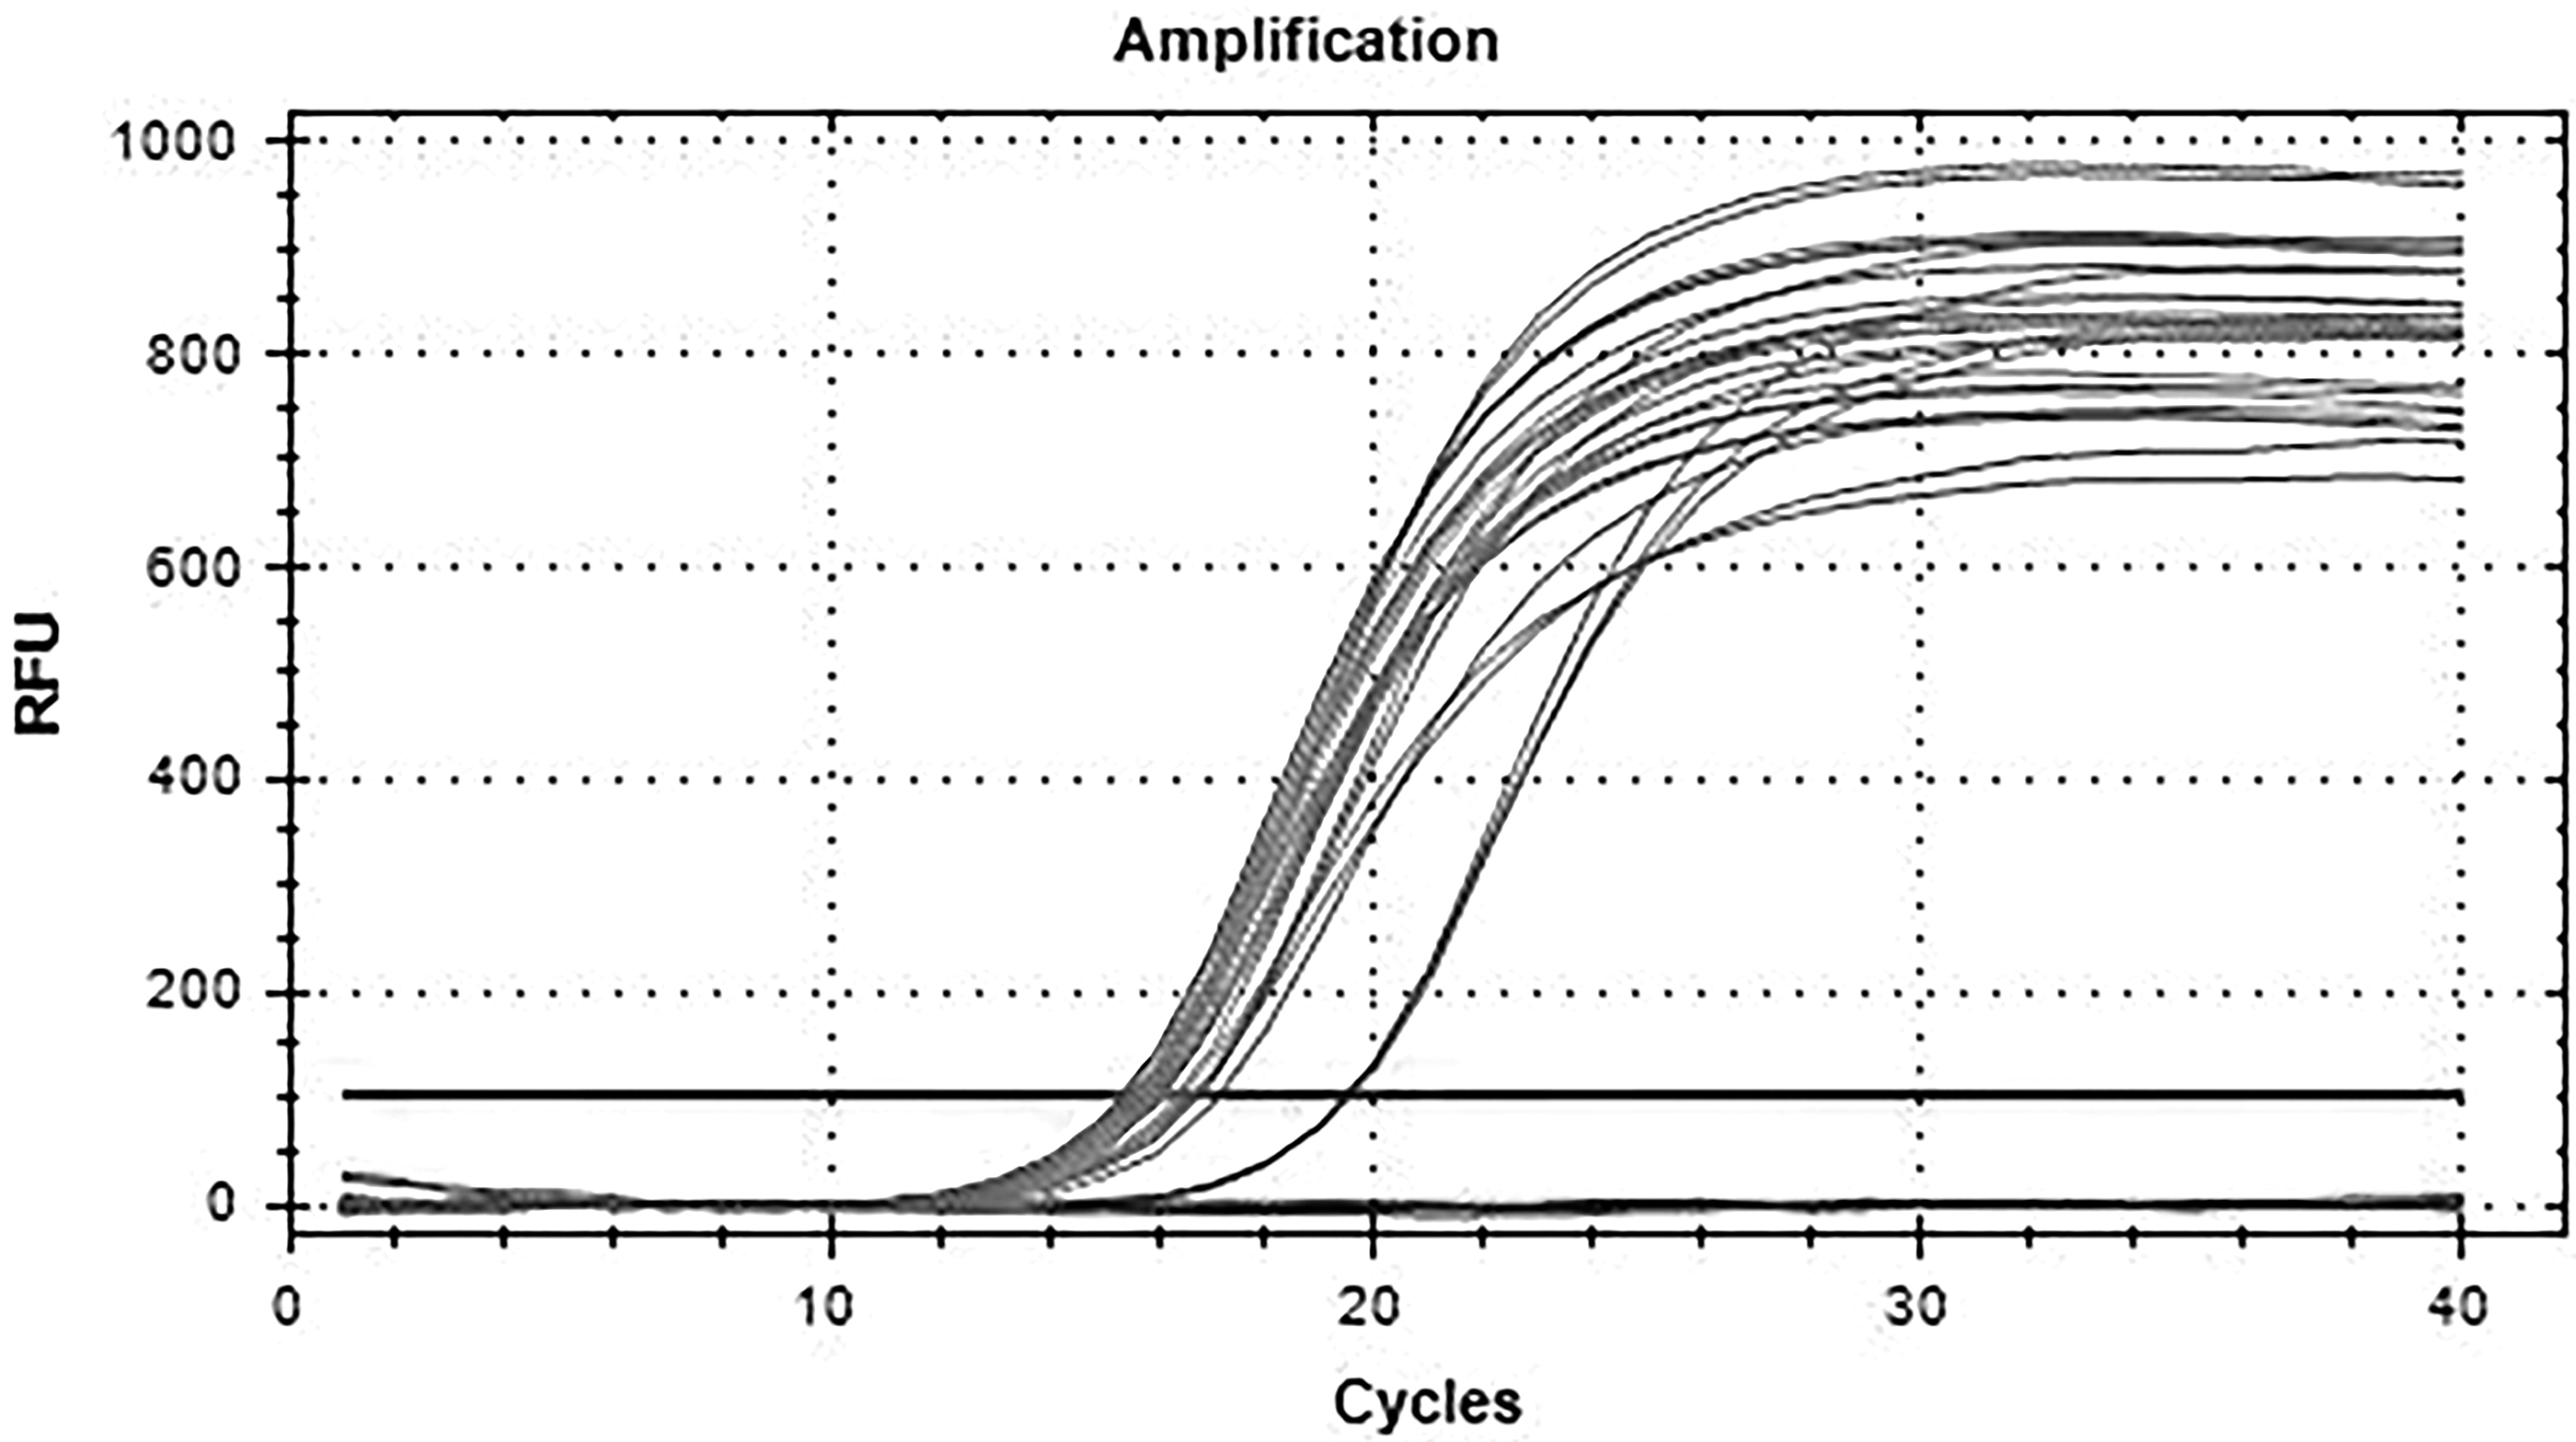
Amplification curve of GAPDH gene. GAPDH gene amplification curve showed good specificity of primers.
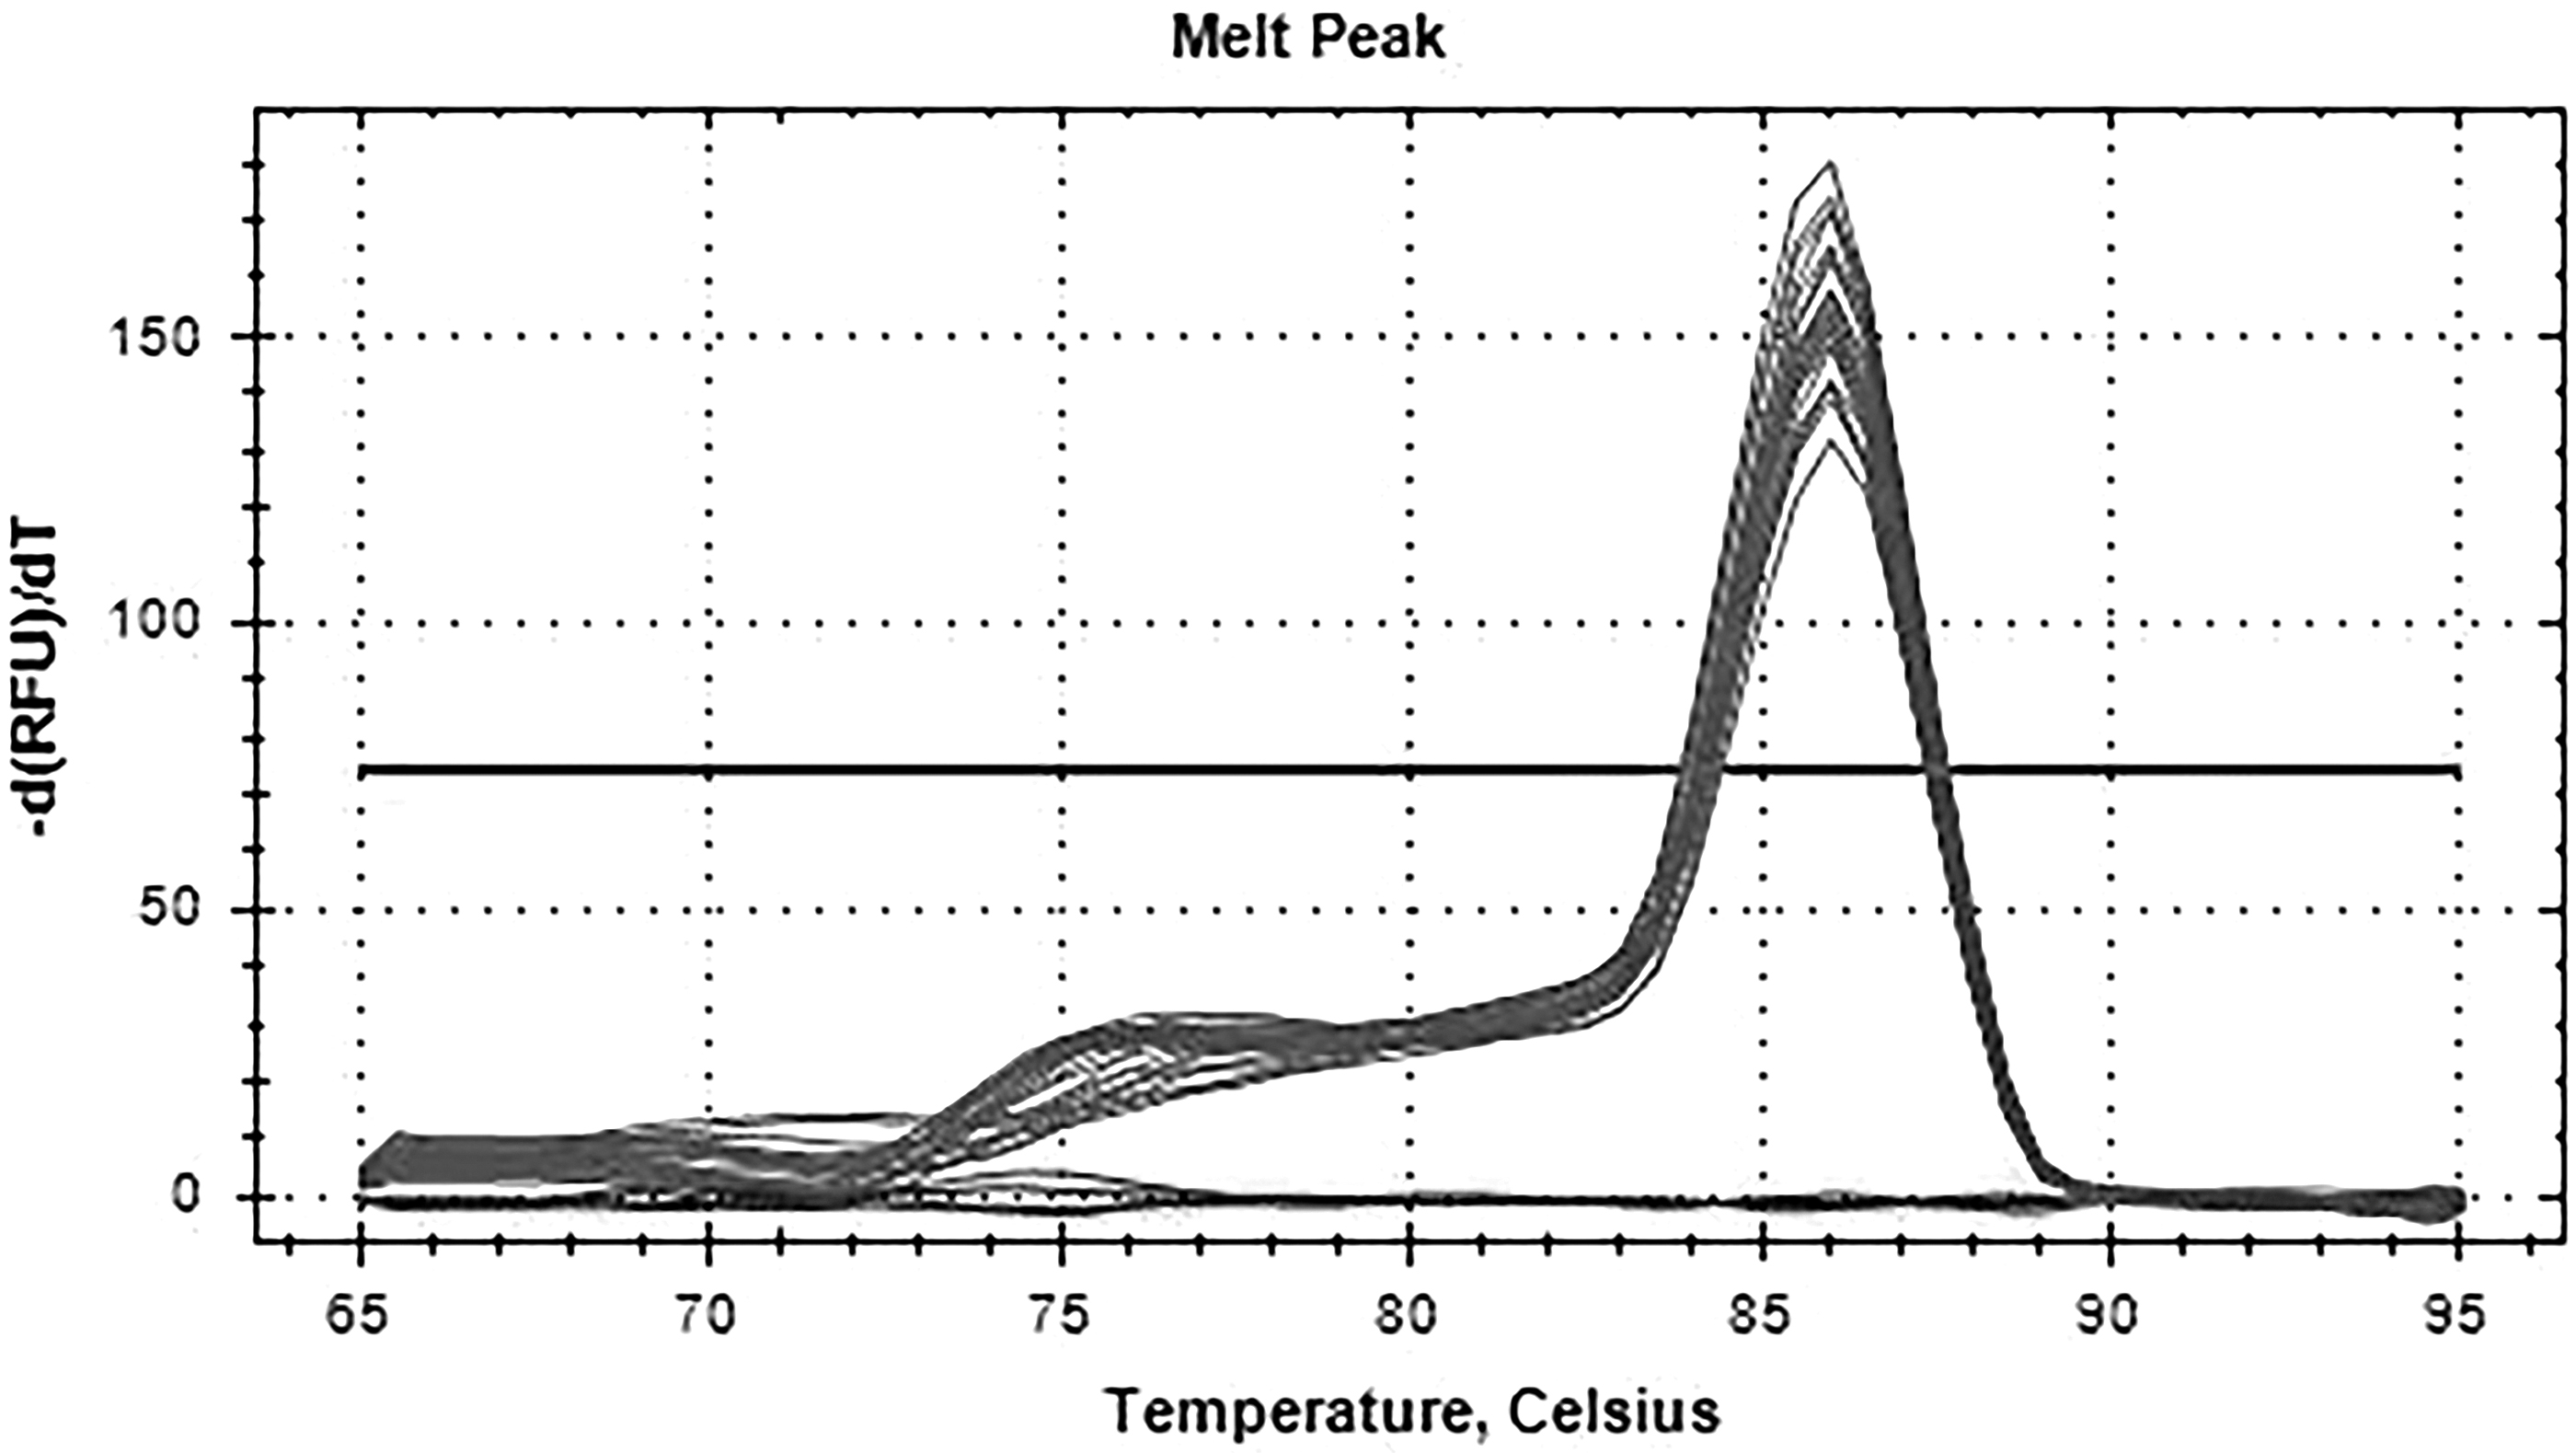
Dissolution curve of GAPDH gene. There was only one main peak in the melting curve of GAPDH gene, and there was no nonspecific miscellaneous peak.
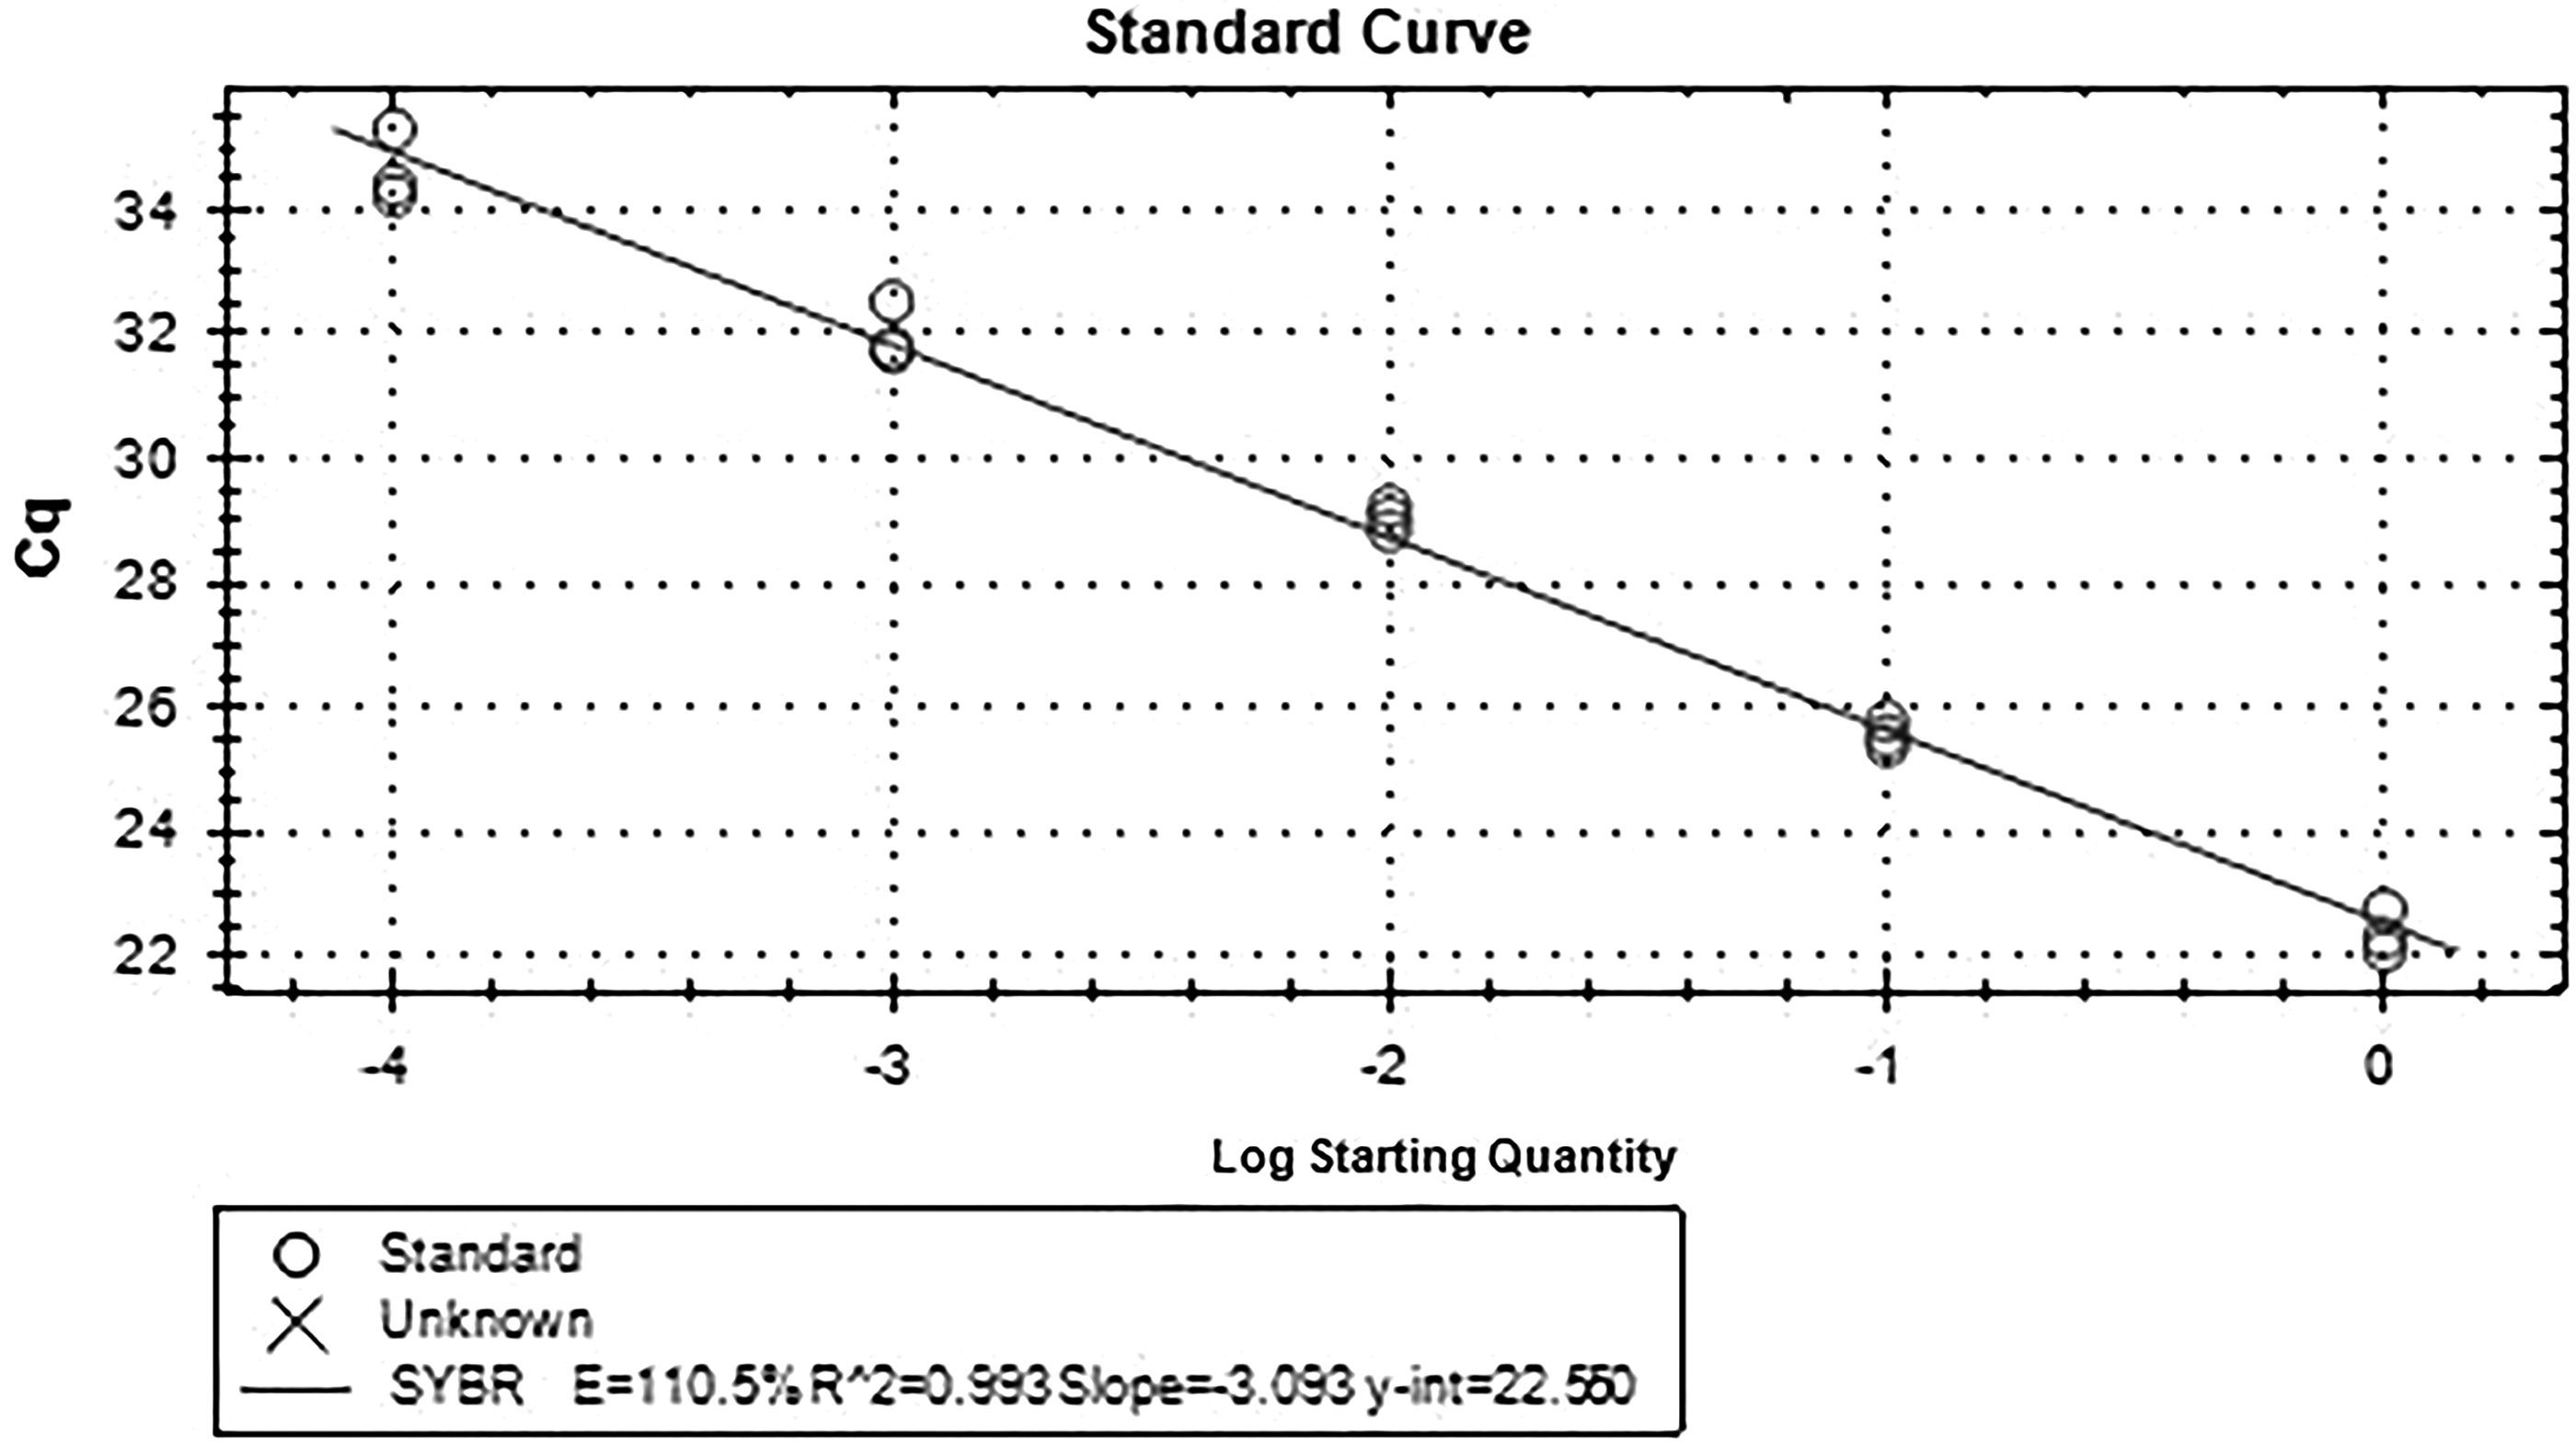
Standard curve of FSHR gene.
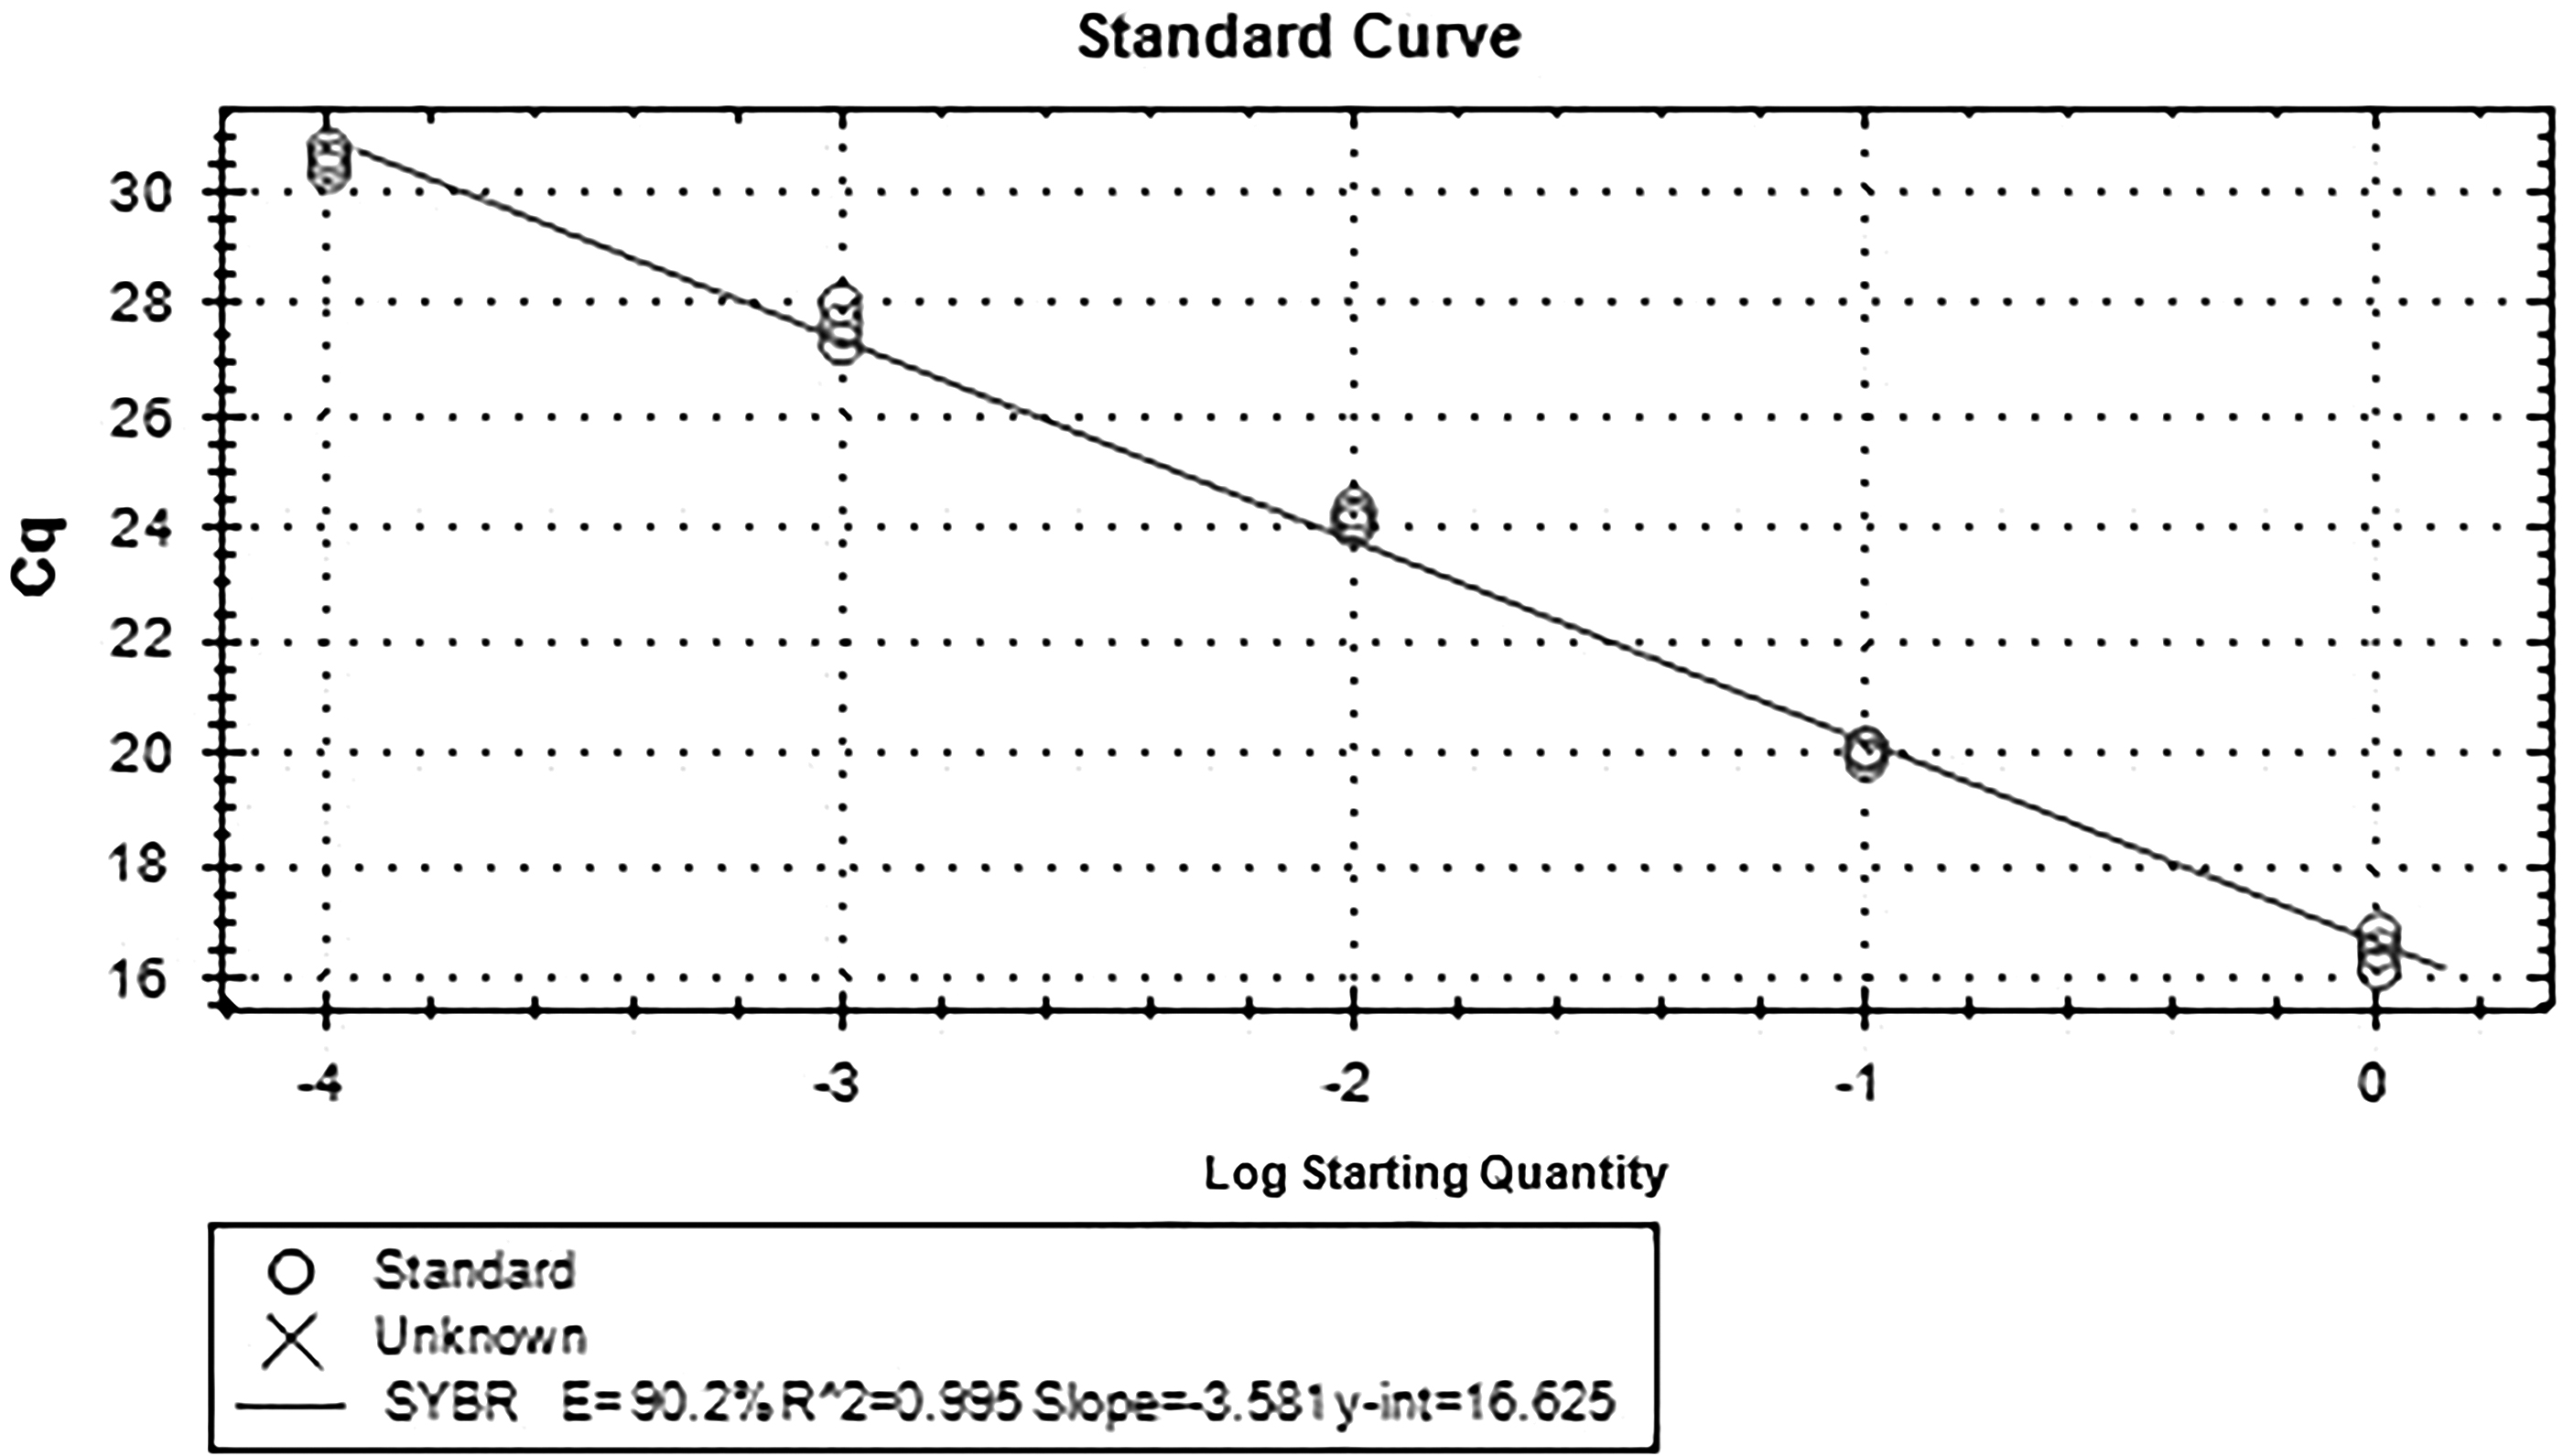
Standard curve of GAPDH gene. Sample 2 and sample 8 cDNA 4 μL, each was used as templates for 10, 100, 1000, and 10,000 times gradient dilution, respectively, and standard curves of target gene and reference gene were drawn.
FSHR and GAPDH gene products were amplified by qPCR using RNA reverse transcription product cDNA as template. The PCR products were detected by 2% agarose gel electrophoresis. The results are shown in Figures 8 and 9.
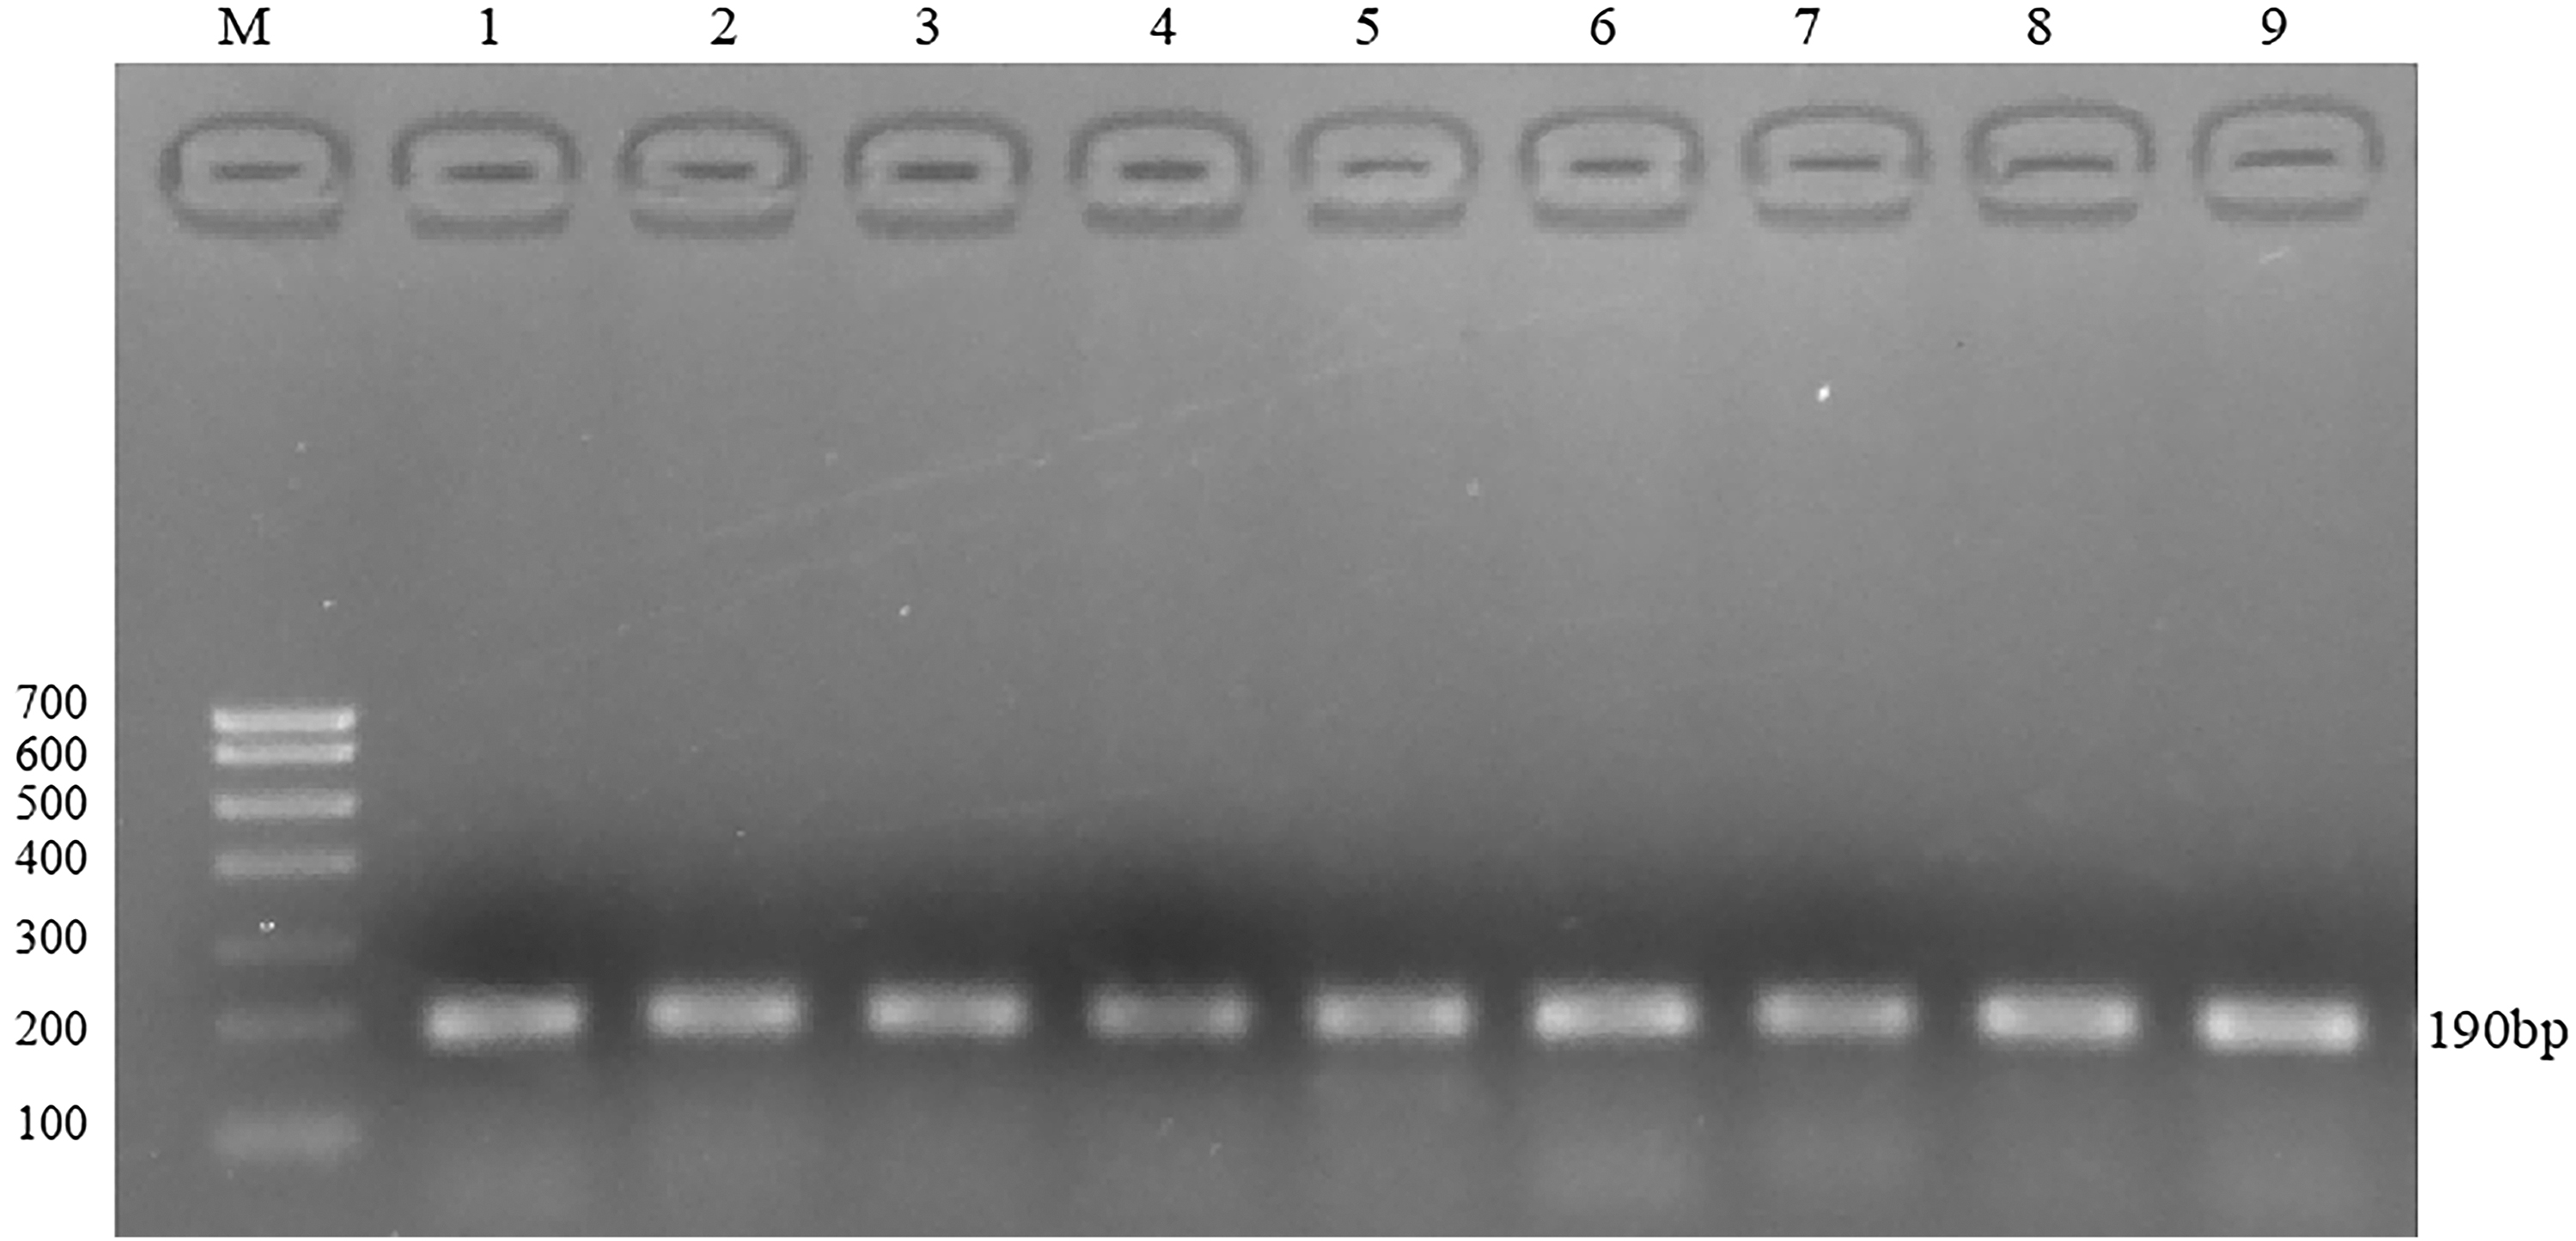
Electrophoresis diagram of qPCR product of FSHR gene.
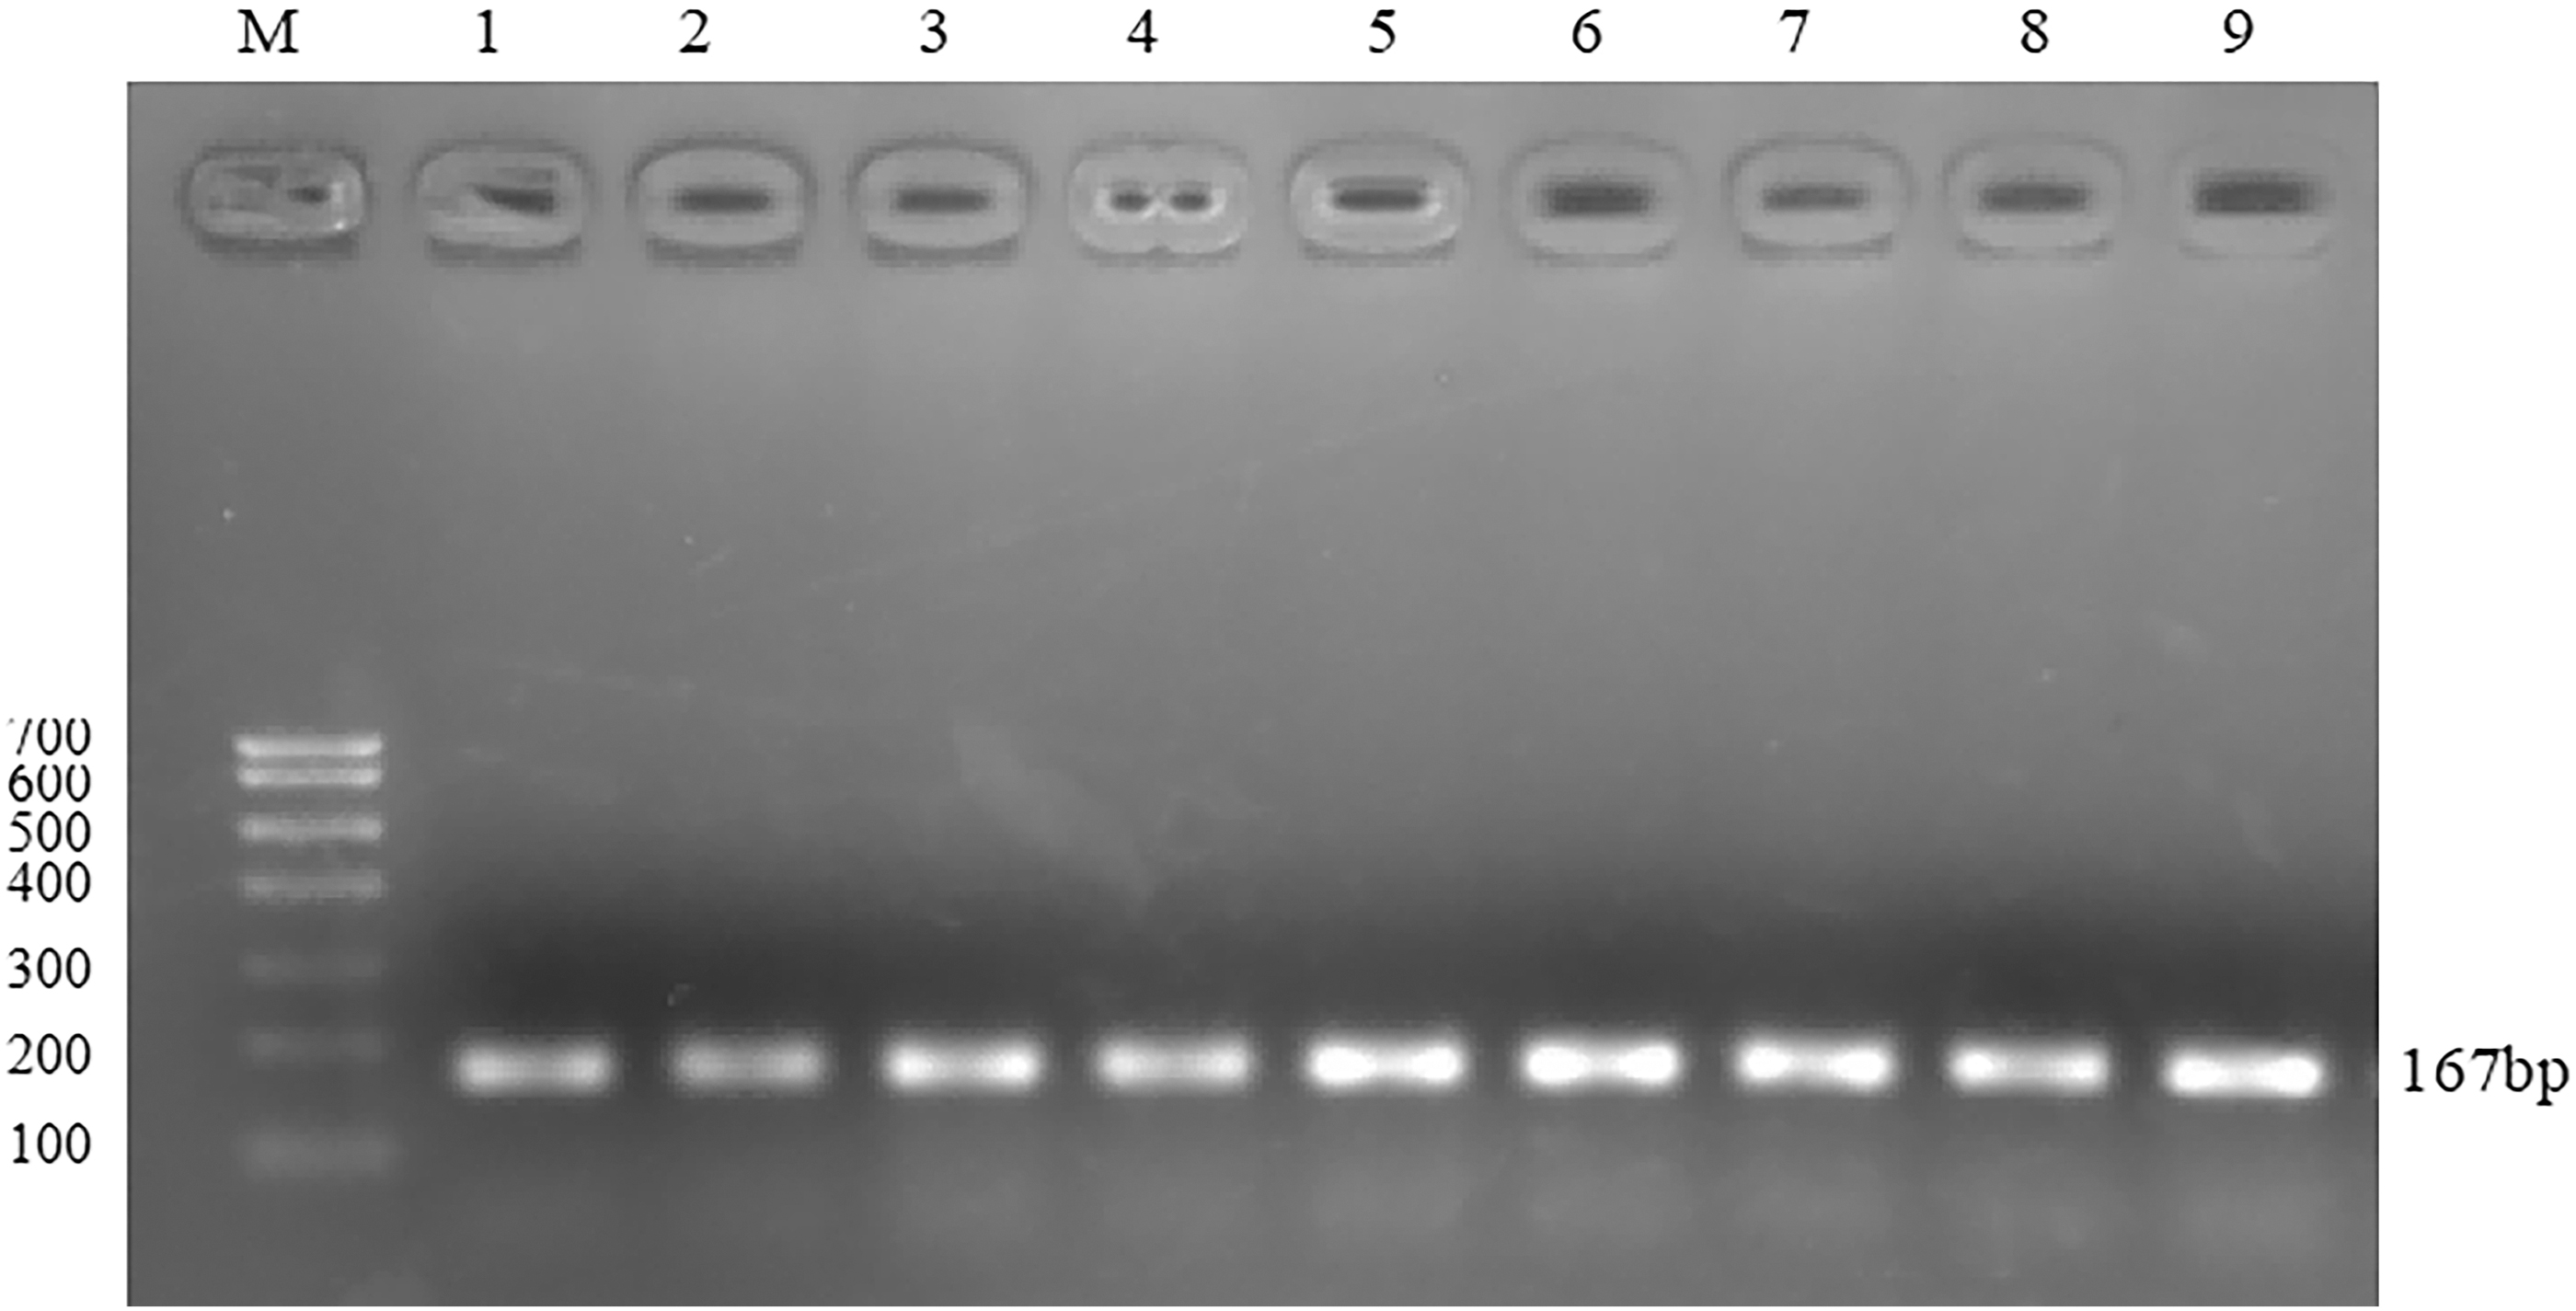
Electrophoresis diagram of qPCR product of GAPDH gene. Figures 8 and 9 FSHR (190 bp) and GAPDH (167 bp) gene products were amplified by qPCR using RNA reverse transcription product cDNA as template, and the PCR products were detected by 2% agarose gel electrophoresis. 1–3: high-energy group, 4–6: medium-energy group, 7–9: low-energy group.
The fluorescence quantitative results showed that there was a high correlation coefficient (R 2 > 0.99) between the standard curves of the three genes, indicating the accuracy of the standard construction. At the same time, the amplification curve of FSHR and GAPDH gene showed that the specificity of primers was good, so the standard curve was representative. There was only one main peak in the melting curve of FSHR and GAPDH gene, and there was no nonspecific miscellaneous peak, so the quantification was accurate. The electrophoresis results showed that there was only a single band in the product, which was no specific band. The length of FSHR band was 190 bp, and the length of GAPDH band was 167 bp, which was consistent with the designed length of the target fragment.
Effect of different energy level diets on FSHR mRNA in ovarian tissue of Duolang sheep
The differences in FSHR mRNA expression in ovarian tissues of Duolang sheep during diestrus between diets with different energy levels are shown in Figure 10. It can be seen from Figure 10 that the FSHR expression in high-energy group (H) during diestrus was significantly higher than that in low-energy group (L) (p < 0.01). The FSHR expression in high-energy group (H) was significantly higher than that in medium-energy group (M) (p < 0.05). The FSHR expression in medium-energy group (M) was significantly higher than that in low-energy group (L) (p < 0.05).
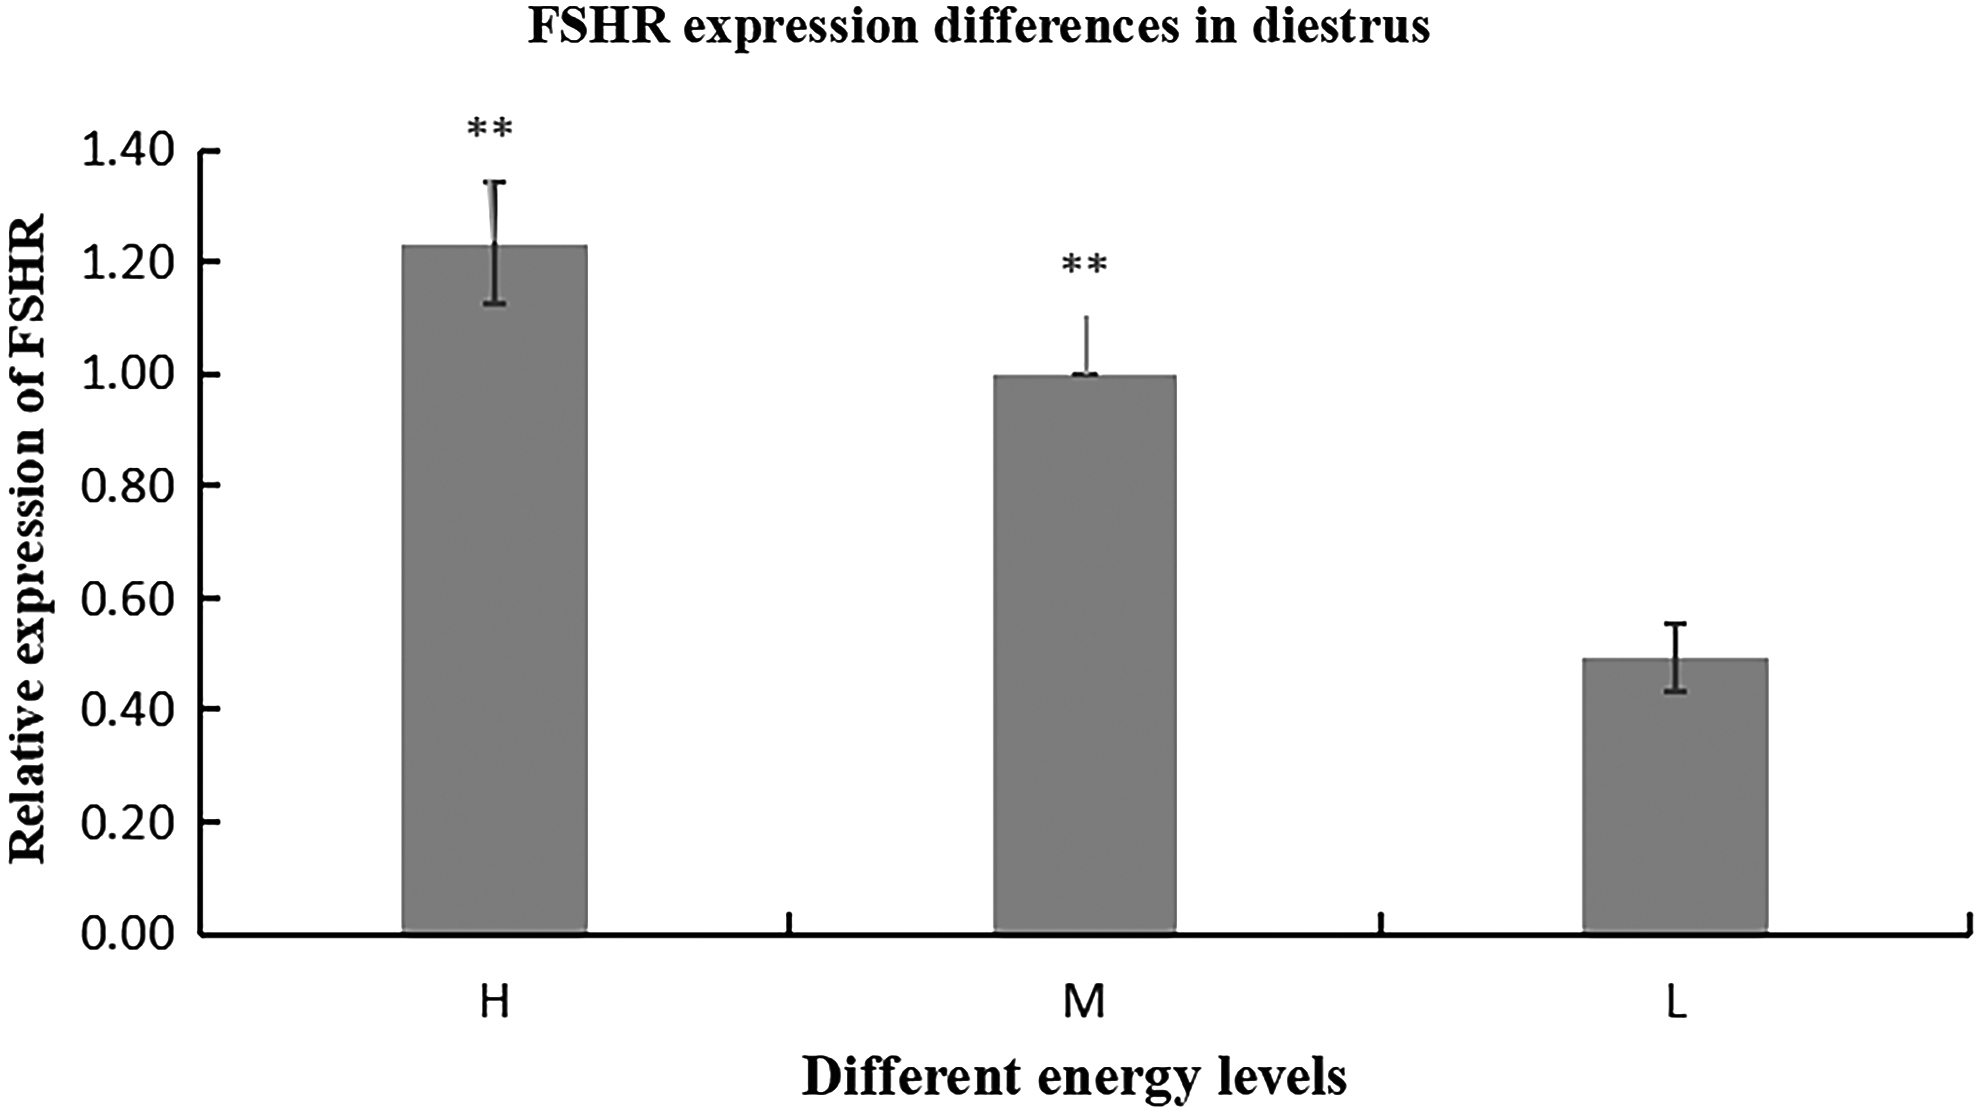
Expression difference of FSHR gene at different energy levels in oestrous ovarian tissue. FSHR expression in different energy groups (H > M > L, H M > > L). H, high-energy group; M, medium-energy group; L, low-energy group.
Analysis of DNA methylation results
Online prediction of CpG islands
The predicted results were as follows: CpG island length >100 bp, GC content >50%, and the expected value >0.6 detection area met the requirements of the experiment. The predicted results are shown in Figure 11.
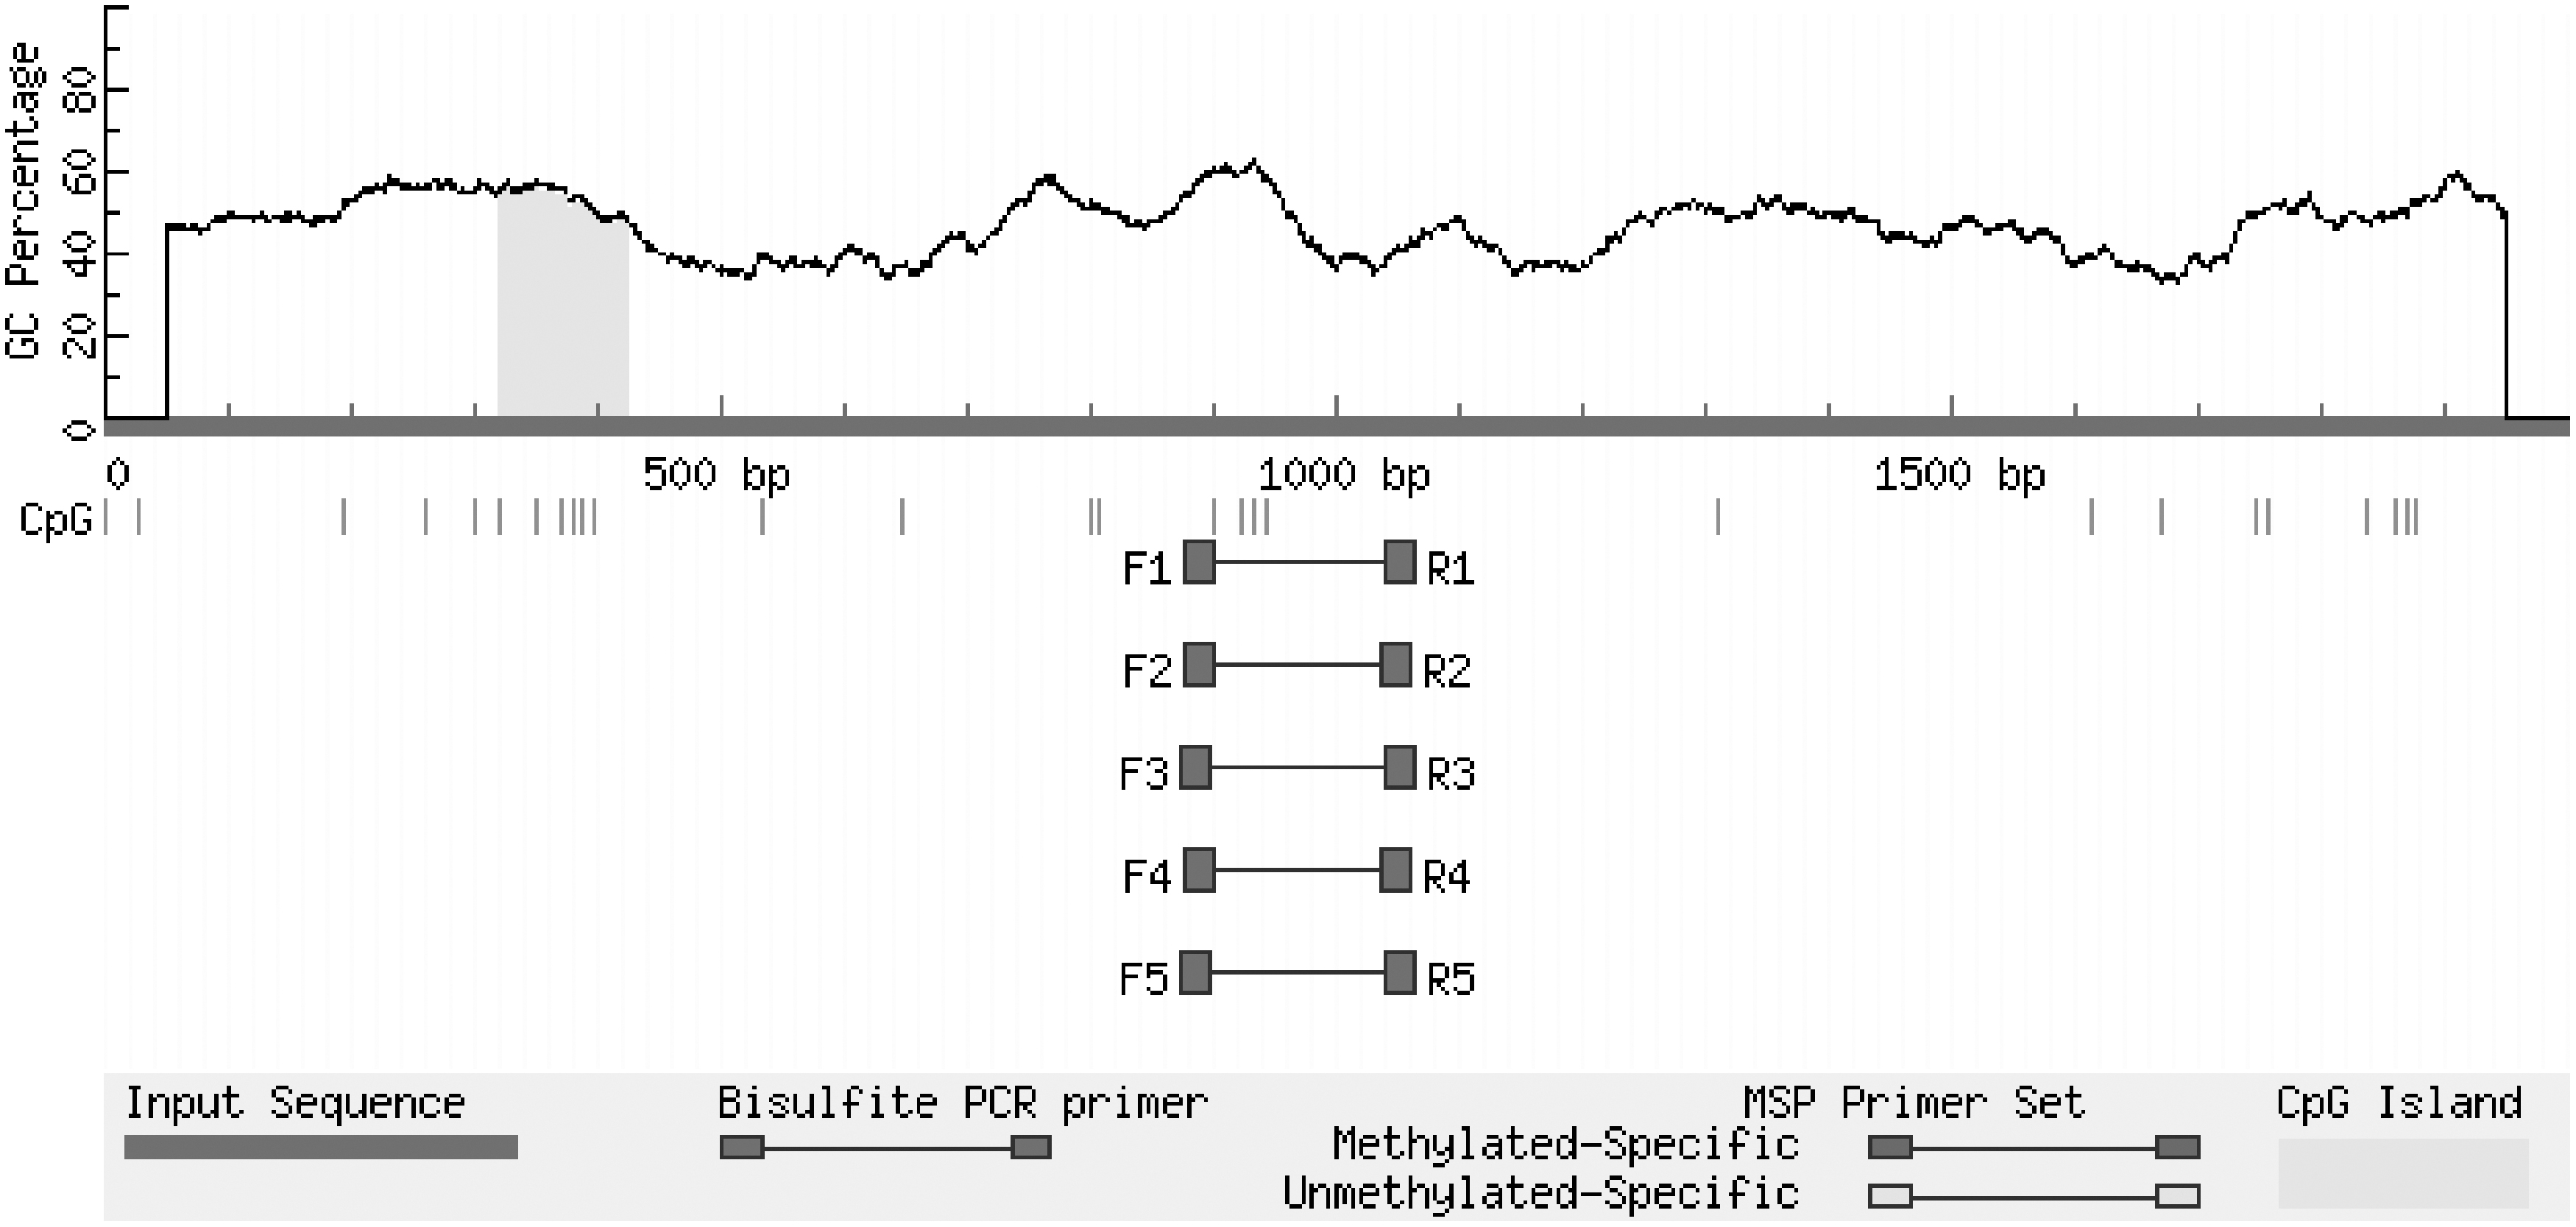
Prediction results of CpG island in promoter region of FSHR gene. The predicted results are: CpG island length >100 bp, GC content >50%, expected value >0.6.
Extraction of genomic DNA
Genomic DNA was extracted from the ovarian tissue of Duolang sheep using the genomic extraction kit according to the operation steps. The concentration and purity of genomic DNA were detected by 2% agarose gel electrophoresis and nucleic acid concentration detector, respectively. The concentration of extracted genomic DNA could reach more than 200 ng/μL, and the OD260/OD280 values were all between 1.8 and 2.0. Therefore, the quality of genomic DNA is good and meets the subsequent experimental conditions. The electrophoresis detection results are shown in Figure 12.

Distrus genomic DNA of Duolang sheep.
Genome DNA methylation bisulfite genomic sequencing PCR amplification
The promoter region of FSHR gene was amplified by PCR using the genomic DNA modified by diazosulfite as the template. The products were detected by 2% agarose gel electrophoresis. The length of the amplified fragment was 189 bp, and the size of the amplified fragment was consistent with the expected size of the amplified fragment. The electrophoresis results are shown in Figure 13.
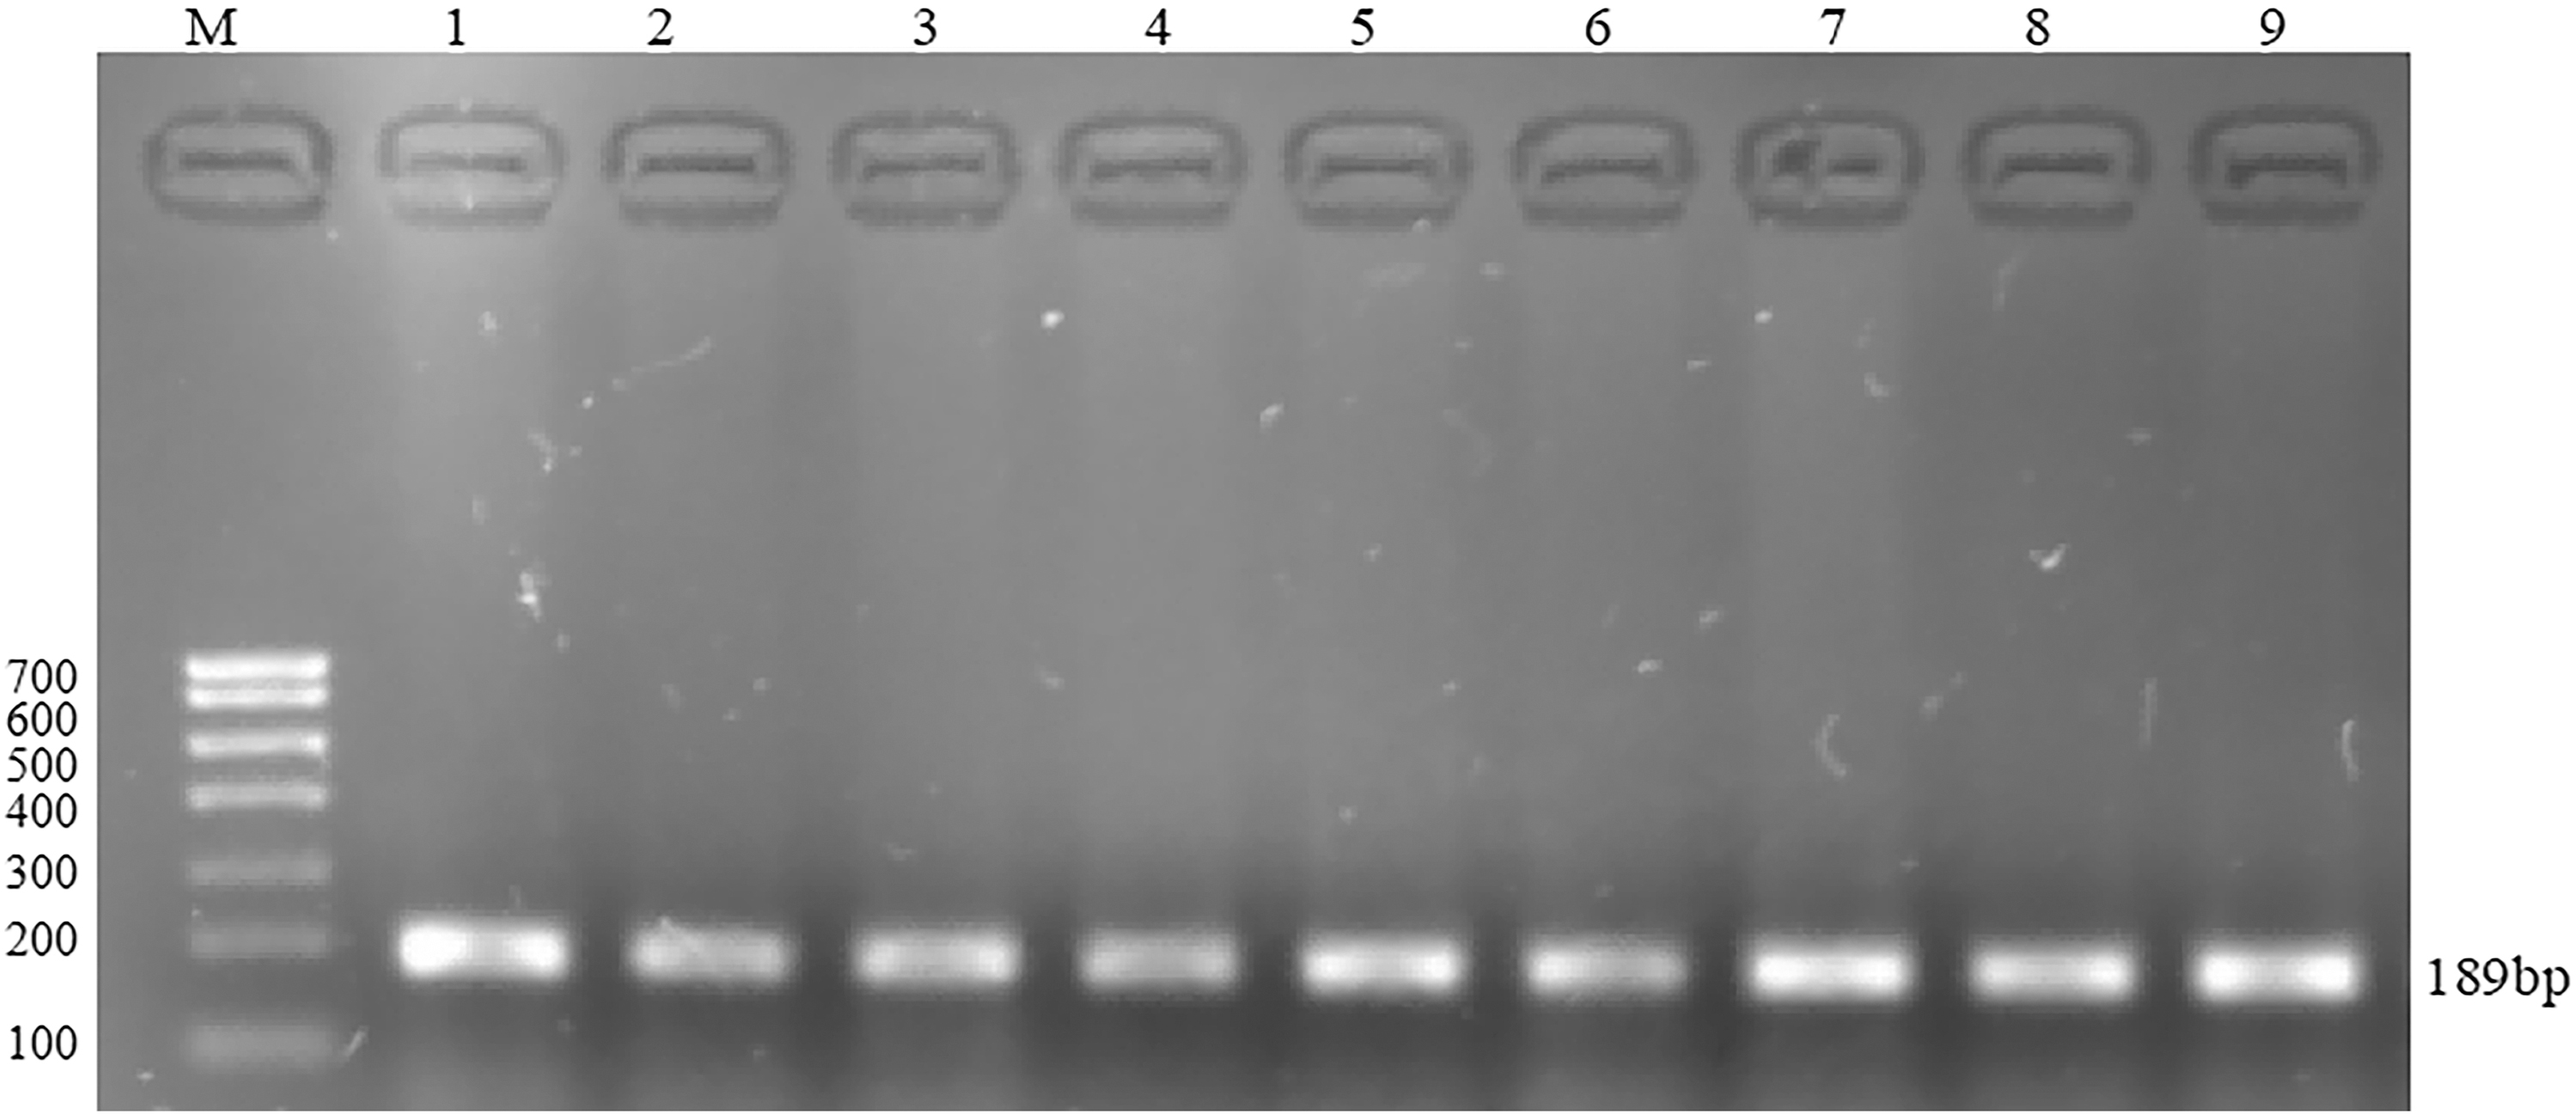
Electrophoresis results of FSHR amplification products after BSP treatment. BSP, Bisulfite genomic sequencing PCR.
DNA methylation bisulfite genomic sequencing PCR amplification product purification recovery and cloning
The recovered and purified DNA fragments were subjected to TA cloning and bacterial liquid PCR detection, respectively. The PCR amplification products of bacterial liquid were detected by 2% agarose gel electrophoresis, and the lengths of fragments were 189 bp, indicating that the recombinant cloning vector pGM-T was successfully constructed. The electrophoresis detection results are shown in Figure 14.
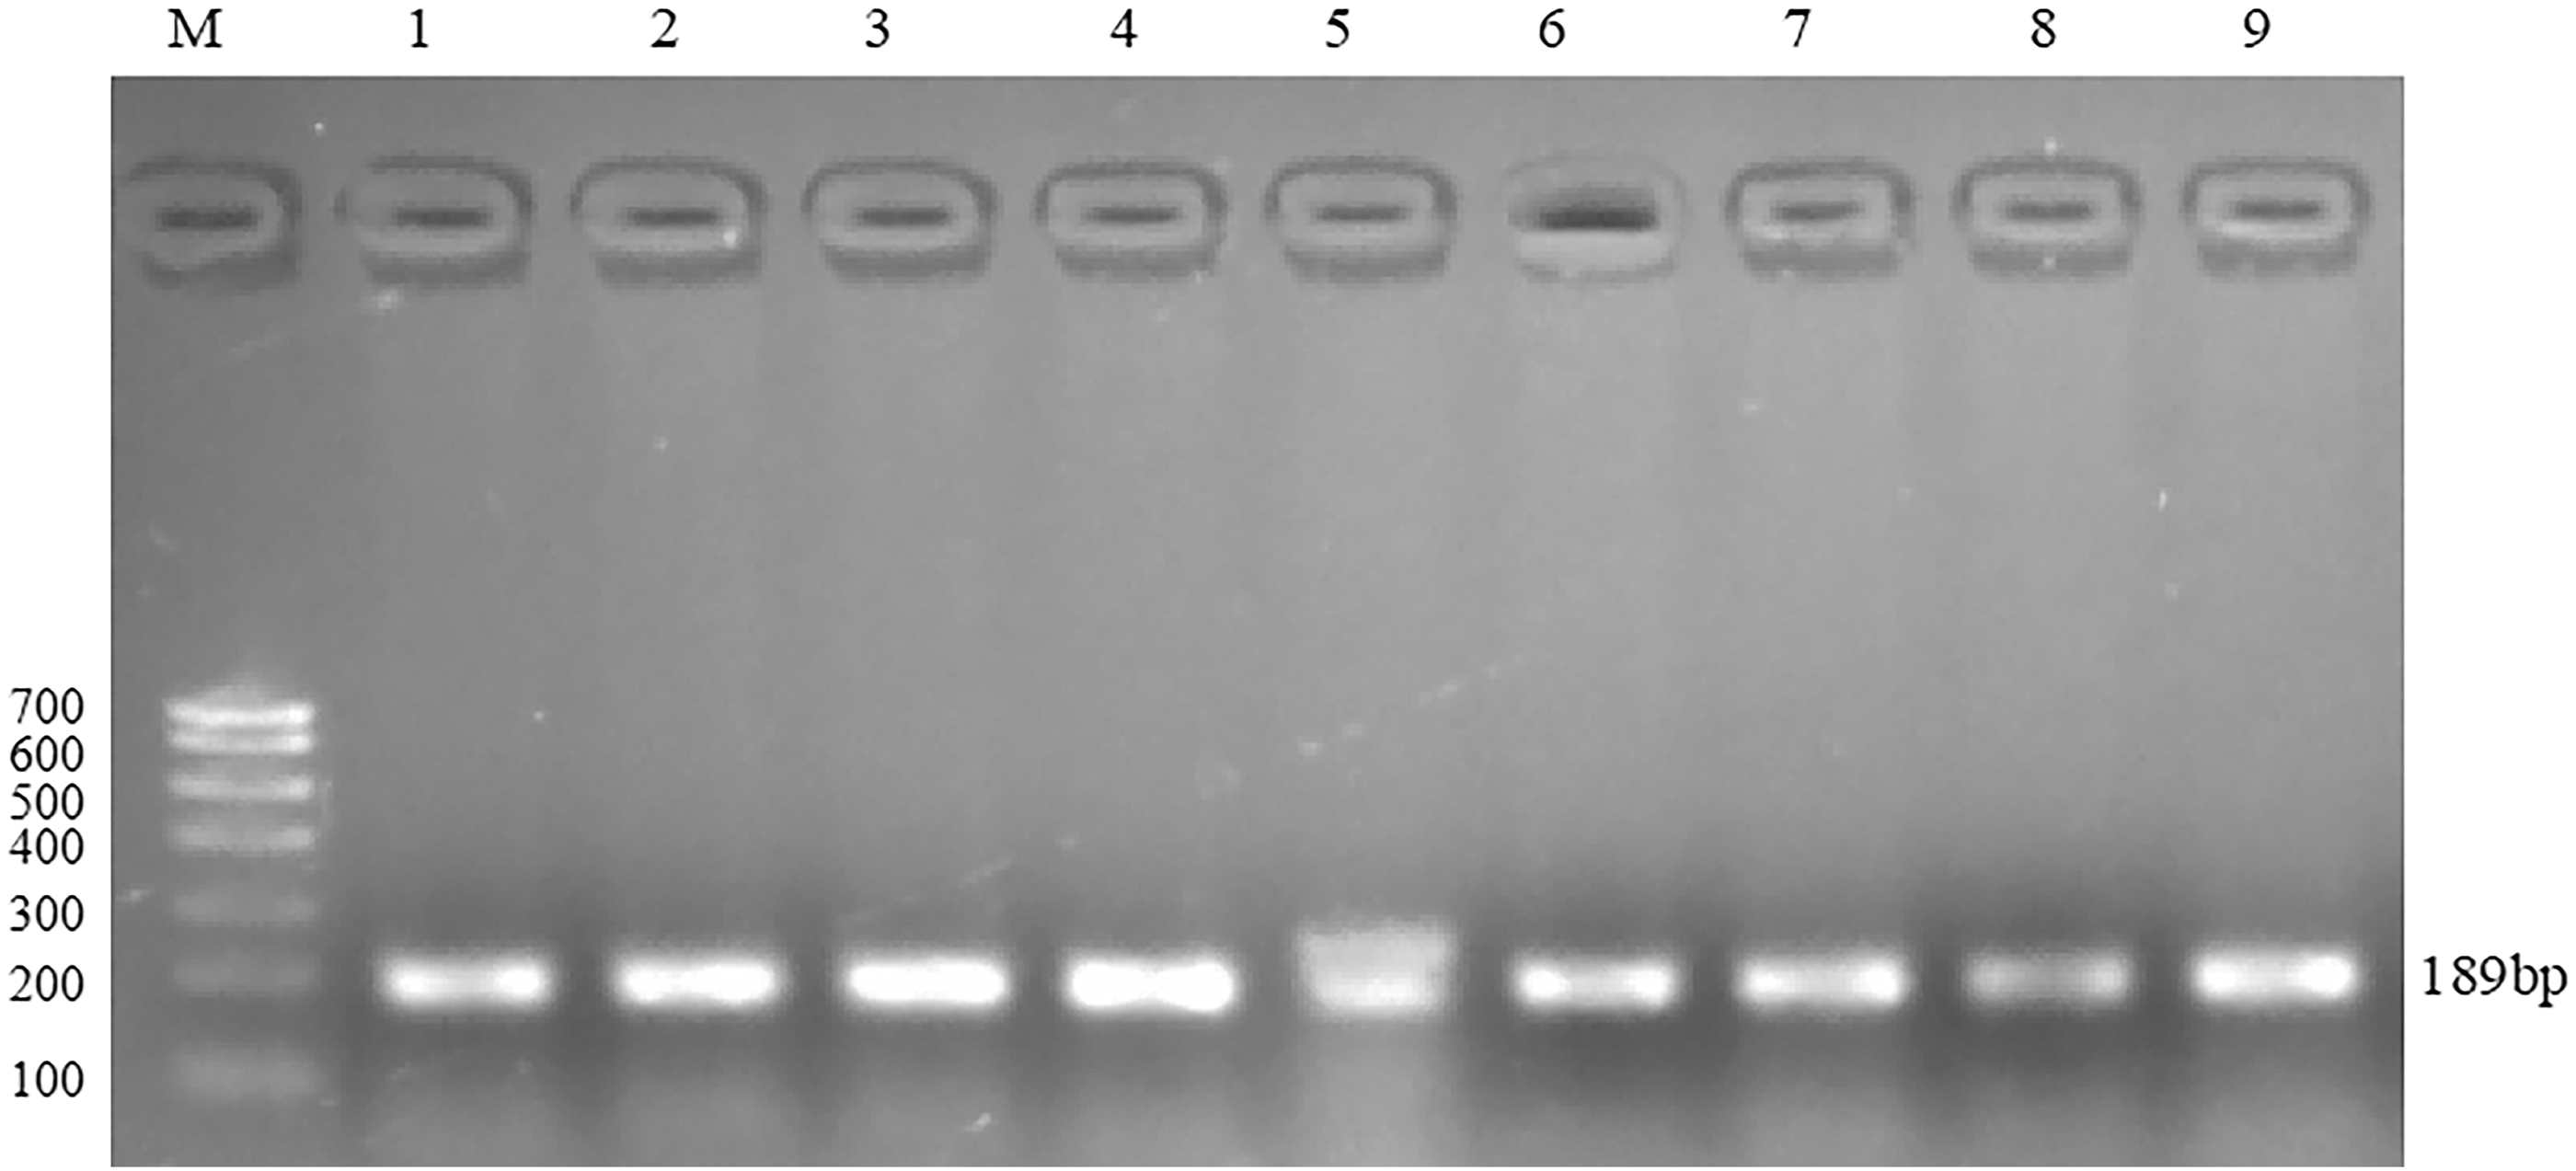
Electrophoresis results of PCR products of recombinant cloning vector. 1–3: high-energy group, 4–6: medium-energy group, 7–9: low-energy group.
Sequencing results and analysis
The sequence obtained by sequencing was analyzed and compared by DNAMAN software, and it was found that the nonmethylated “C” in the nonmethylated site was converted into “T”, while the rest of the bases were completely identical. The results are shown in Figure 15.
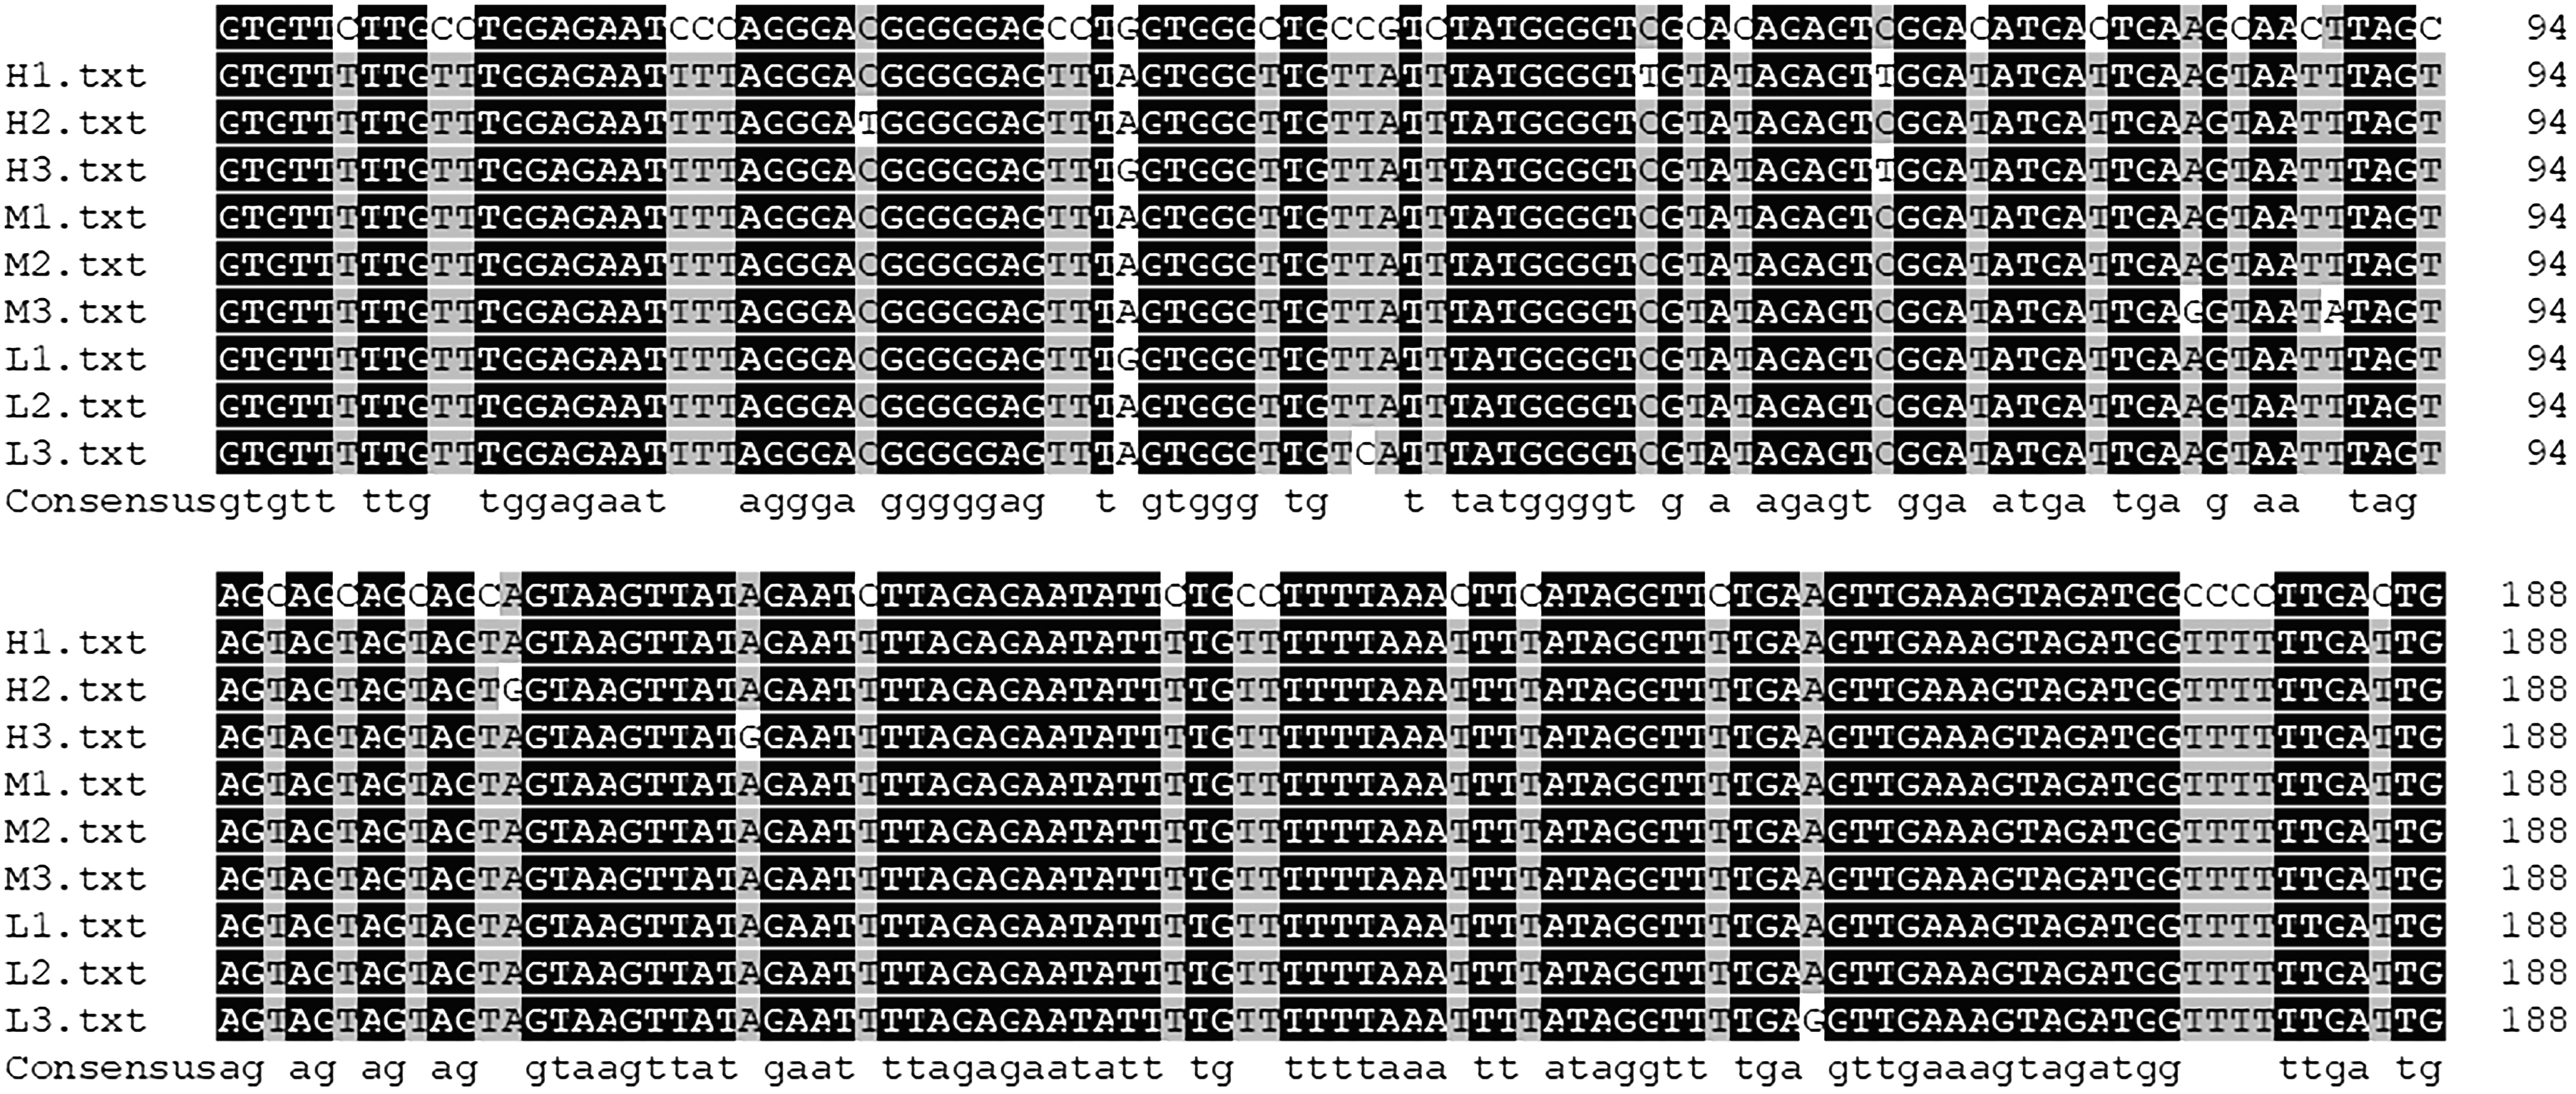
DNAMAN sequence alignment results. The lowest is the original sequence, H1–H3 is the high-energy group sequence, M1–M3 is the medium-energy group sequence, L1–L3 is the low-energy group sequence.
Methylation sites and methylation ratio analysis
The QUMA online website was used to analyze 9 sequencing sequences, and 4 sites in the target fragment were found to be methylated sites. From the matrix map, it can be seen that 49 sites in Duolang sheep did not occur methylation, and the methylation level from low to high was (high-energy group 41.67% < medium-energy group 75.00% < low-energy group 83.33%). The white circle was nonmethylated site, and the black circle was methylated site (Fig. 16).
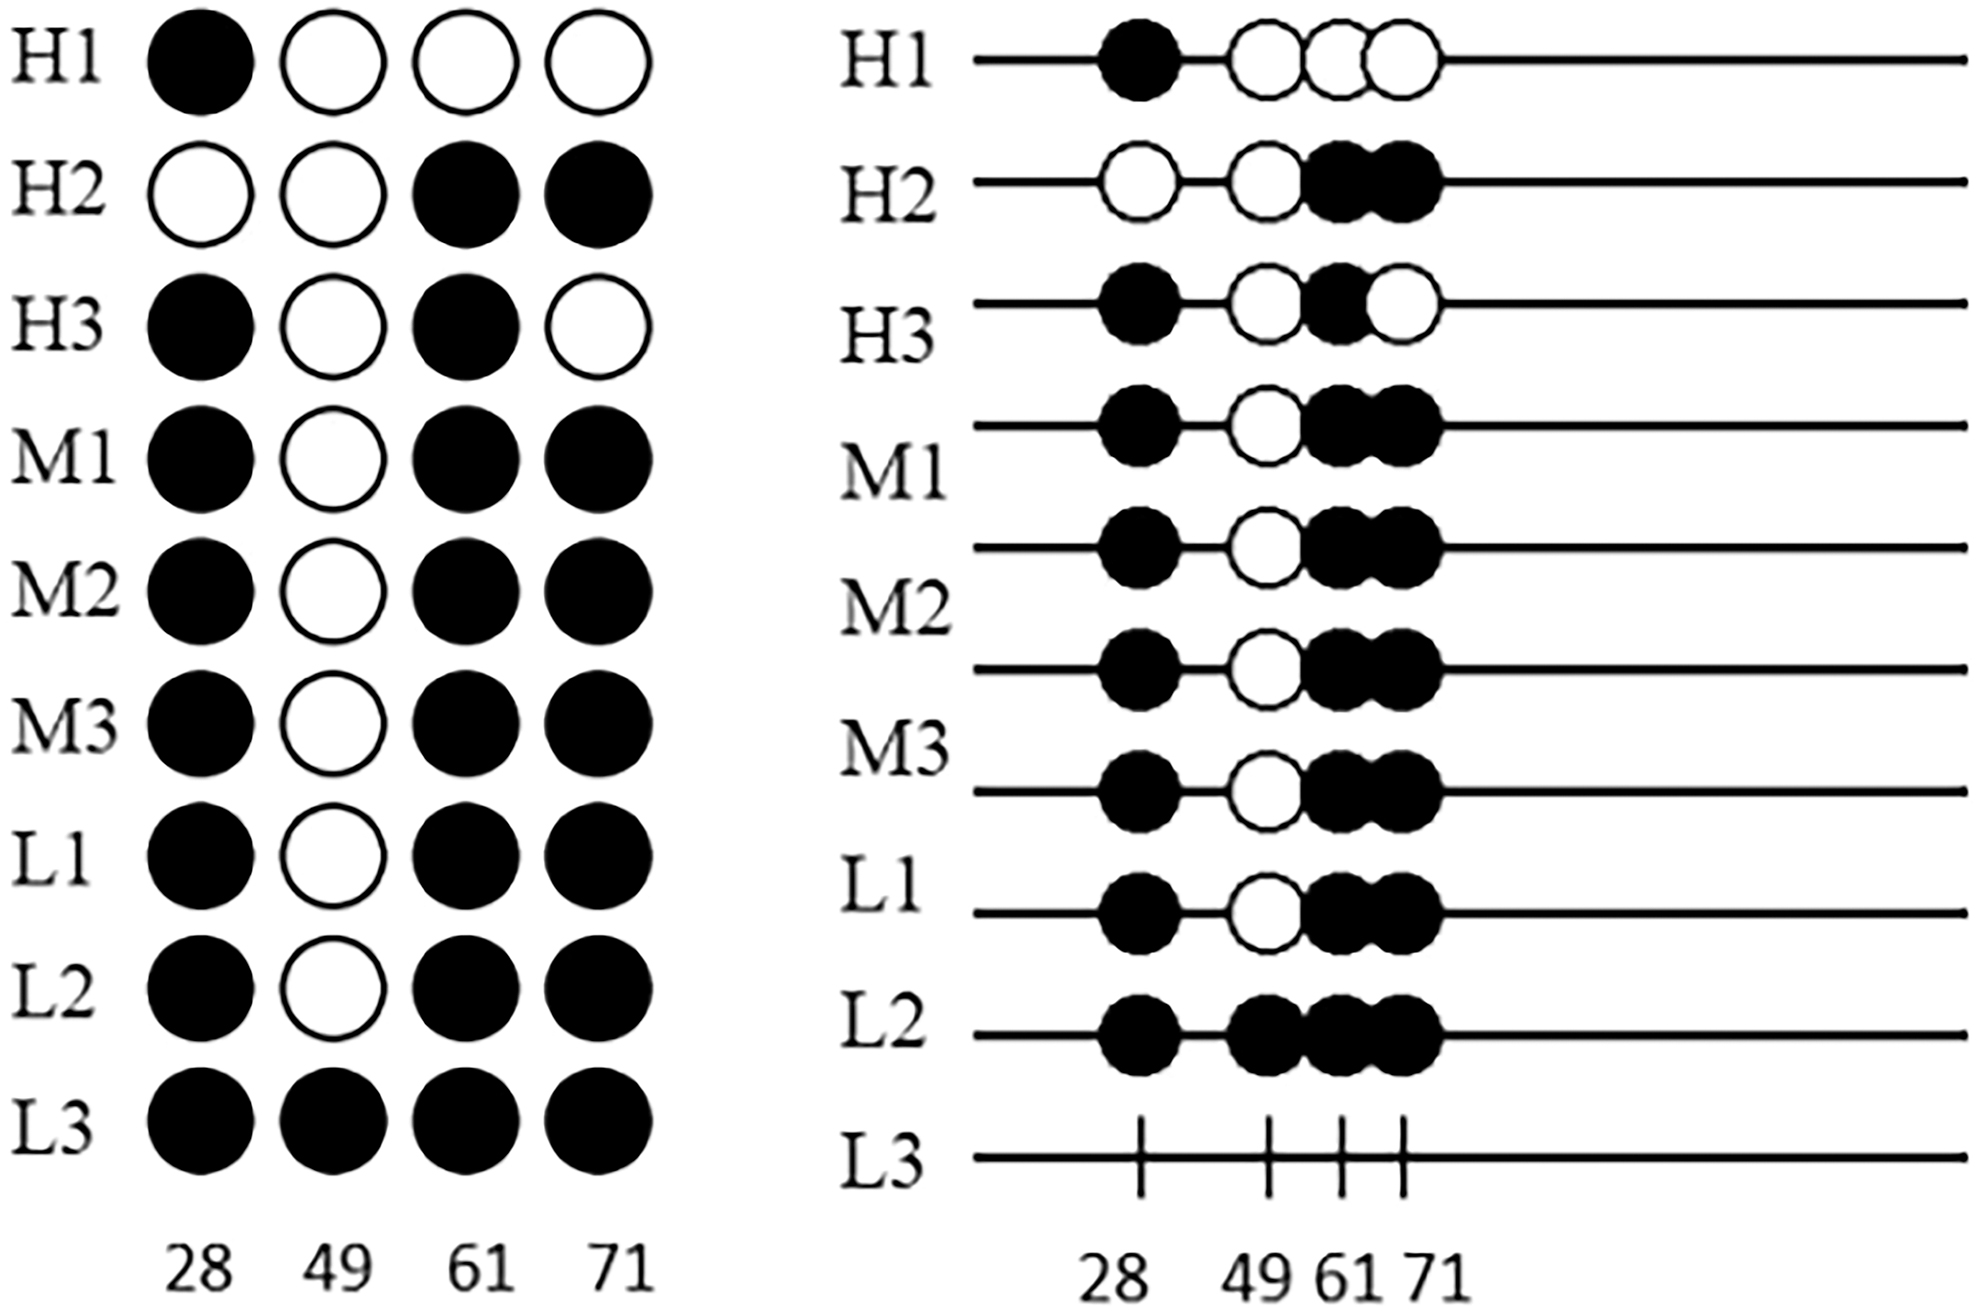
QUMA analysis results of methylation sites. Black circle represents methylation, while white circle does not. H1–H3: high-energy group, M4–M6: medium-energy group, L7–L9: low-energy group, 28 49 61 71 is the target fragment methylation site.
Figure 17 shows that the total methylation rate of Duolang sheep is 88.89% at site 28, 11.11% at site 49, 88.9% at site 61, and 77.78% at site 71.

QUMA analysis results of methylation sites. Methylation probability at 28 49 61 71.
Methylation of FSHR gene in Duolang sheep fed different energy levels and its correlation with FSHR expression
To study the correlation between the DNA methylation level of FSHR gene and the relative expression level of this gene in Duolang sheep fed diets with different energy levels, Pearson correlation coefficient analysis and regression analysis were conducted on the two groups of data (Fig. 18). Pearson correlation coefficient r = −0.8536, | r | > 0.8, R 2 = 0.7288.
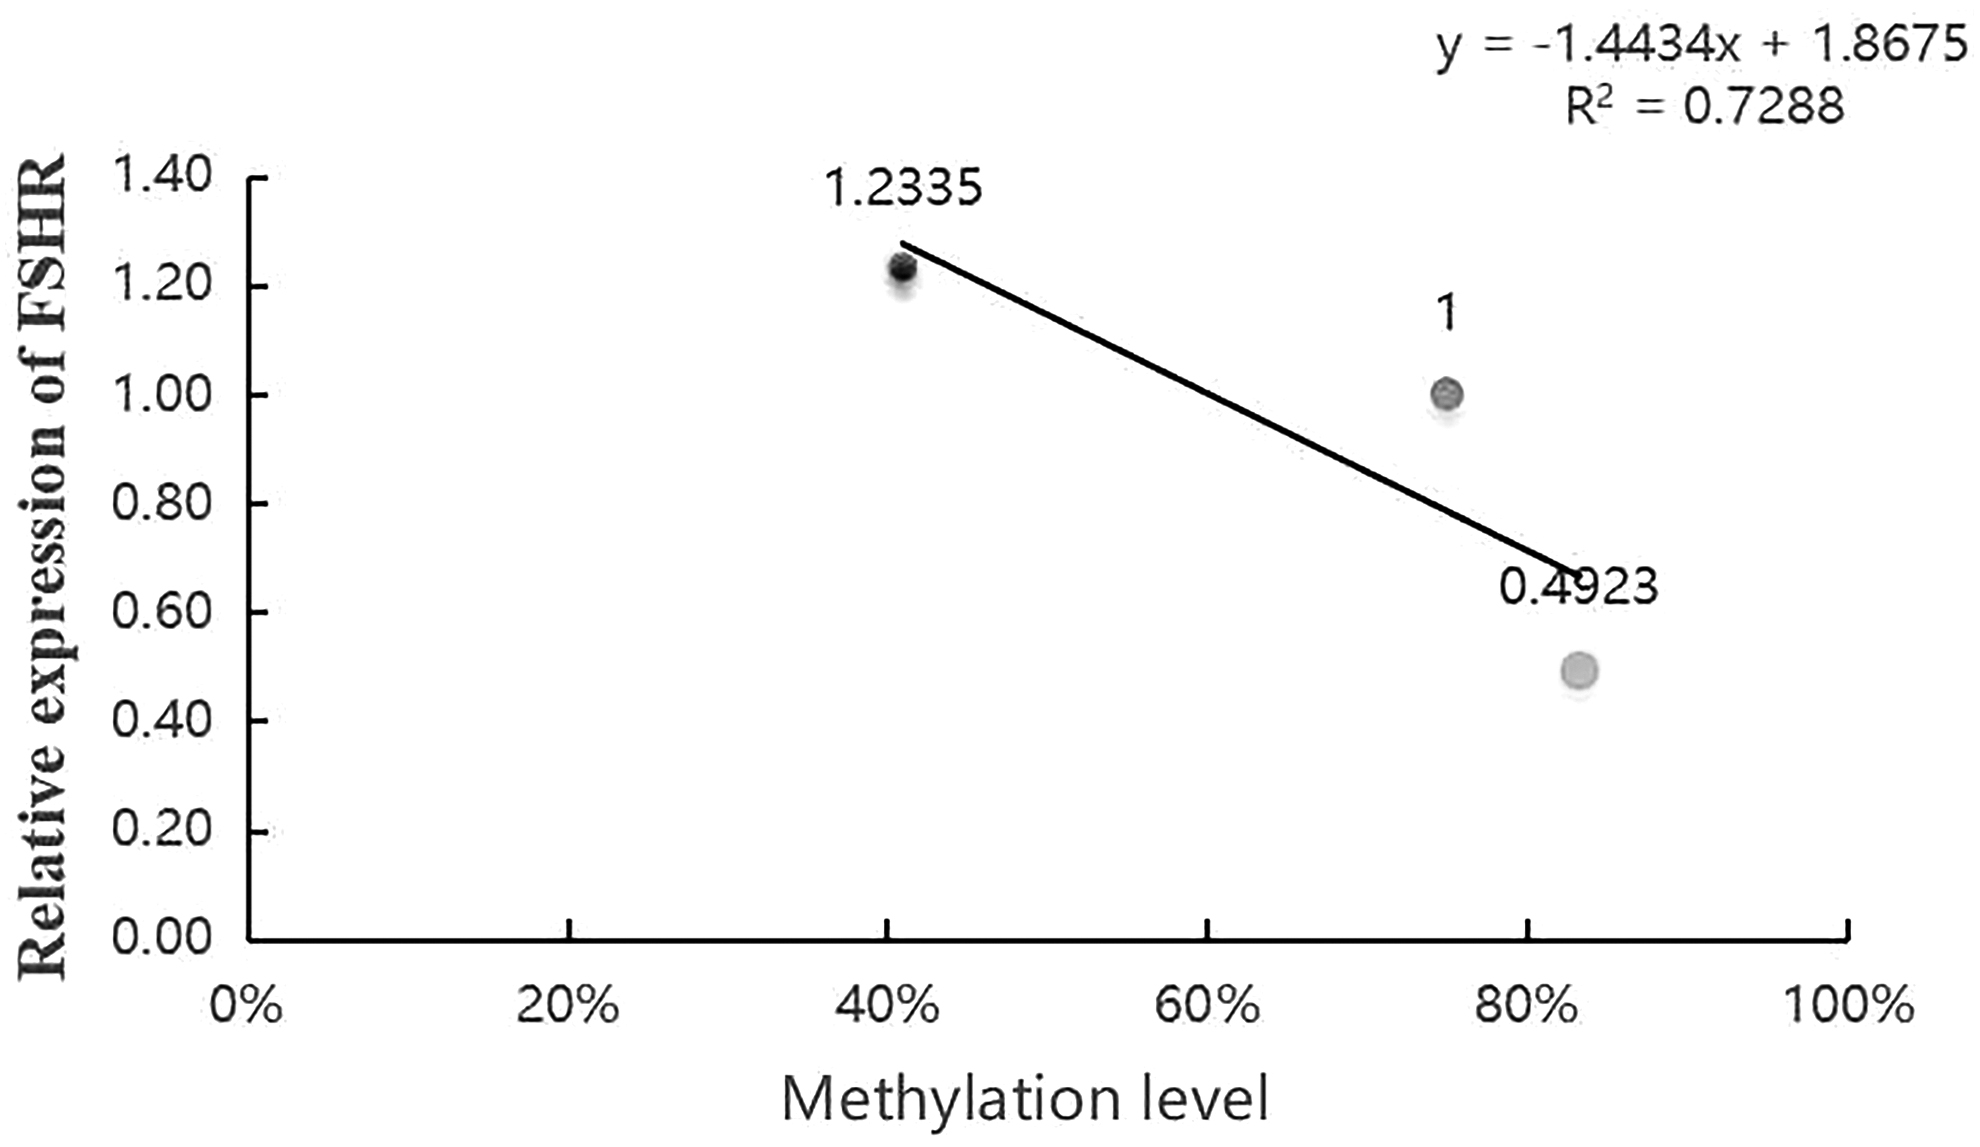
Correlation analysis between DNA methylation level and relative expression level of FSHR gene. Relative expression of FSHR in ordinate and methylation probability of FSHR in abscissa.
We generally believe that the correlation coefficient | R | is very strong between 0.8 and 1.0; There is a strong correlation between 0.6 and 0.8; 0.4–0.6 is a moderate correlation; there is a weak correlation between 0.2 and 0.4; 0.0–0.2 is very weak correlation or no correlation. The experimental correlation coefficient is 0.85, so there is a high negative correlation between the methylation degree of FSHR gene and the relative expression of FSHR in different energy groups.
Discussion
Effect of energy level on FSHR gene expression in Duolang sheep
Among the effects of nutrition on sheep production, energy supplement affects weight gain, which is crucial to the function, cell activity and metabolism of important organs, as well as nutritional utilization and reproductive process. Dietary energy content may affect follicular development through direct effects of nutrients on ovarian microenvironment (Grazul-Bilska et al., 2019). The response of animal cells to the nutritional environment (i.e., the availability or scarcity of nutrients) is closely linked through a series of biochemical and physiological events, including the digestion, absorption, intermediate metabolism, storage and excretion of nutrients, as well as information transmission such as gene expression (AP, 2010). The concept of molecular biology is increasingly applied to the study of food components and essential nutrients as factors controlling gene expression (García-Cañas et al., 2010).
However, the methodological progress in molecular biology and genetics has promoted the research on genetic diseases at the DNA level and nutrients at the molecular level. The increase of dietary energy supply of sheep before mating will have a positive impact on the ovulation rate. This practice is called nutritional “flushing” in the livestock system. The short-term increase in the availability of dietary energy can stimulate the final stage of folliculogenesis, resulting in the increase of ovulation rate, thus increasing the twinning rate (Scaramuzzi et al., 2006). FSHR is essential for ovarian follicle growth and ovulation, and the expression of FSHR is the key to accelerate follicle growth. The effects of FSHR gene expression on follicular development of Duolang sheep fed with different energy levels were studied.
The results showed that the expression of FSHR in high-energy group and medium-energy group was significantly higher than that in low-energy group (p < 0.01), and there was no significant difference between high-energy group and medium-energy group (p > 0.05). The follicular development of high-energy group and medium-energy group was better than that of low-energy group. A large number of studies have found that in the ewes using FSH for superovulation, the ovulation rate of ewes providing half of the energy requirement is lower than that of ewes providing twice the energy requirement. This result is consistent with that observed in this experiment. It is well known that nutrition can change the ovulation rate and lambing rate of ewes. The rapid improvement of physical condition is usually related to the increase of ovulation rate and litter size.
The change of ovulation rate may be related to the cell entry rate of high nutritional glucose in animals. Dietary supplements containing high energy and protein have been shown to improve ovulation in ewes (Downing et al., 1995). Nutritional intake plays an important role in regulating reproductive performance of ewes. Nutritional supplementation promotes the selection and growth of dominant follicles during follicular development and improves the quality of oocytes, depending on the number and duration of supplementation (Chavarro and Schlaff, 2018). Xu et al. (2015) found that the transcription levels of FSH and LH in the normal nutrition group were higher than those in the nutrition restriction group (p < 0.05) in the study of reproductive hormones and transcriptomics responses of pituitary tissue in the diestrus sows induced by nutrition restriction.
Viñoles et al. (2005) found that ewes with better body condition had more gonadotropin-dependent follicles than ewes with worse body condition, accompanied by lower estradiol and higher FSH concentration during follicular phase. Maternal malnutrition during lactation resulted in a significant decrease in plasma LH levels in mid-breeding ewes, and these malnourished ewes did not recover their periodicity until the onset of seasonal diestrus (Lozano et al., 1998). LH and FSH work by binding and activating their specific receptors LHR and FSHR. FSH is the main stimulating factor for follicular differentiation from preantral to preovulation. Due to the lack of hormones or receptors, the FSH signal of female mice was ineffective, showing that follicles could not differentiate at the preantral stage, and the E2 produced was very few, so they were sterile (Burns et al., 2001).
Current data show that maternal malnutrition during lactation leads to changes in the expression of ovarian FSH, androgen, and estrogen receptor subtypes. Follicular development changed, showing a large number of primary follicles, preantral follicles, and small follicles, corpus luteum and primordial follicles decreased. Women lacking FSHR have thin uterus and small ovaries, and their follicular development is blocked before the formation of antral follicles, resulting in infertility. In women, FSHR is expressed in granulosa cells and is thought to closely regulate the various stages of follicular maturation released by periodic pituitary FSH. In the reproductive process, only a small fraction of follicles differentiate, and more than 99% of follicles enter the degradation process known as atresia.
There is little evidence that negative energy balance has any direct effect on ewe ovaries, which has nothing to do with its effect on the hypothalamic-pituitary axis (Lozano et al., 2003). However, there is strong evidence that negative energy balance has some direct inhibitory effects on follicular development and oocyte quality in lactating dairy cows (Gong, 2002). Female mice lacking FSHR are also infertile due to blocked preantral follicle development (Dierich et al., 1998). On the contrary, positive energy balance increased blood leptin and insulin concentrations and glucose uptake. These changes seem to directly affect the ovary and are related to the increase of follicular development and ovulation rate in sheep. There is little evidence that positive energy balance has a specific stimulating effect on hypothalamic-pituitary axis (Wade and Jones, 2004). If the positive energy balance continues, it will inevitably increase weight.
However, the stimulating effect of nutrition on follicular development may occur before weight gain. Studies have found that nutrients and metabolites can directly or indirectly alter gene expression by upregulating or downregulating transcription processes (Dey, 2012). Although a large number of literatures have described the effect of dietary energy on follicular development and ovulation rate, there are relatively few studies on the intrafollicular mechanism affected by dietary energy content. In this experiment, three groups of Duolang sheep with different energy levels were added as experimental subjects. It was found that the key gene FSHR regulating ovarian development had a certain effect. The expression of FSHR gene in high-energy group was the highest, followed by medium-energy group, and the lowest expression was low-energy group. Although the expression of FSHR has been reported to be epigenetically regulated, the mechanism remains unclear.
Effect of energy level on DNA methylation in FSHR promoter region of Duolang sheep
In recent years, there is growing evidence that dietary factors may alter epigenetic markers. Feeding high-fat, low-protein, or energy-limited diets in animal models has been shown to alter epigenetic markers (Widiker et al., 2010). The influence of diet on epigenetic patterns is mostly limited to specific nutrients, including micronutrients and other non-nutritional dietary components, such as lignin or polyphenols. These nutrients can alter DNA methylation of gene-specific promoters closely related to gene expression. DNA methylation can lead to phenotypic changes in feeding and environmental conditions, leading to changes in productivity and animal disease risk, research suggests (Tanwar et al., 2020). In this experiment, Duolang sheep fed with diets with different energy levels were selected as the research objects, and the methylation level of FSHR gene promoter region was detected by using the “gold standard”—bisulfite genomic sequencing PCR for DNA methylation detection.
The results showed that the methylation level in the promoter region of FSHR gene in the high-energy group was lower than that in the medium energy group and lower than that in the low-energy group. Lillycropet et al. (2008) observed that protein restriction during pregnancy led to hypomethylation in the promoter region of PPARc and glucocorticoid receptor (GR) genes in the liver and found that the methylation level in the promoter region of genes was regulated by nutritional level. Canani et al. (2011) study found that maternal undernutrition and overnutrition may interact with genes controlling lipid and carbohydrate metabolism, resulting in changes in epigenetic regulation. Epigenetic regulation plays an important role in development and is necessary for stable expression or suppression of genes in specific cell types or developmental stages (Stover and Caudill, 2008).
Epigenetic modifications may be a mechanism, through which exposure to altered intrauterine environments or metabolic disturbances may affect gene expression and regulate the phenotype of organisms at later stages of life (SIMMONS, 2011). The promoter regions of many genes contain several CpG dinucleotides, at which methylation-induced changes may occur, resulting in epigenetic regulation. Epigenetic and nutritional factors in the study of placenta have found that it may be a function of genes encoding high-affinity glucose transporters (GLUT1 and GLUT3). The relationship between DNA methylation and gene expression may affect the glucose flow between maternal and fetal circulations (Novakovic et al., 2013) Although we know that some nutrients and other food derived compounds can change DNA methylation patterns, the amount of nutrients and the way of eating are uncertain.
Waterland et al. (2006) support the view that nutritionally induced epigenetic changes can lead to phenotypic consequences, despite evidence in animal models. However, little is known about the dietary factor dose or exposure/consumption time required to cause changes in epigenetic markers. Therefore, in this experiment, by increasing the energy requirement of the feeding standard reference (NY/T816-2004) by 15%, it was found that the expression of FSHR was higher than that of other groups when the feeding standard was 15% higher than the feeding standard followed by the normal group. The lowest expression was lower than the feeding standard group, and DNA methylation was negatively correlated with gene expression. YANGShao-hua (2012) studied the effects of different dietary energy levels on the expression of FSHR gene in sheep ovary.
When the feeding standard (NY/t816-2004) increased and decreased by 30%, it was found that the expression of FSHR gene in high- and low-energy groups was lower than that in medium-energy group, and the difference between medium-energy group and low-energy group was very significant (p < 0.01); There was significant difference between medium-energy group and high-energy group (p < 0.05), but there was no significant difference between high-energy group and low-energy group (p > 0.05). This result is inconsistent with the results of this experiment, so different energy gradients may lead to different DNA methylation and thus affect gene expression. However, in rodents and humans, DNA methylation and histone acetylation can be modified by dietary compounds (Canani et al., 2011).
Weaver et al. (2004) found that there were differences in DNA methylation in the promoter region of GR gene in young mice receiving different degrees of maternal care, which was negatively correlated with GR expression and lasted until adulthood. Maternal health, nutritional status or exposure to common exogenous contaminants in food can cause epigenetic effects. For example, different methylation profiles were detected in placentas of women with gestational diabetes (Finer et al., 2015). These data emphasized the potential of livestock nutrition management to control gene expression related to energy metabolism, glucose homeostasis, and insulin signal through DNA methylation changes. It provides a basis for the application of nutrition to the cellular and molecular responses of animals to various dietary nutrients, as well as the study of nutrition on animal genome, methyl/epigenetic genome, transcriptome, proteome, and metabolome.
Conclusions
For Duolang sheep fed with this energy gradient level diet, with the increase of energy gradient, the average methylation level of FSHR gene promoter and target fragment decreased, while the expression of FSHR mRNA increased. The expression of FSHR gene mRNA in high-energy group tended to be the highest, and there was no significant difference between high-energy group and medium-energy group (p > 0.05). The expression of FSHR gene mRNA in high-energy group and medium-energy group was significantly higher than that in low-energy group (p < 0.01).
The average methylation levels of the target fragment in the promoter region of FSHR gene were the following, respectively: high-energy group 41.67%, medium-energy group 75.00%, and low-energy group 83.33%. The total methylation rate was 88.89% at site 28, 11.11% at site 49, 88.89% at site 61, and 77.78% at site 71. The methylation level of FSHR gene was highly negatively correlated with the relative expression of FSHR.
Footnotes
Authorship Confirmation Statement
We declare that submitted article does not contain previously published material, and is not under consideration for publication elsewhere. The article is truthful original work without fabrication, fraud, or plagiarism. All authors listed have read the complete article and have approved the submission of the article.
Ethics Approval and Consent to Participate
All animal experiments were conducted according to the Regulations and Guidelines for Experimental Animals established by the Ministry of Science and Technology (Beijing, China, revised in 2004). The present study was approved by the Institutional Animal Care and Use Committee of Tarim University.
Availability of Data and Material
All data generated or analyzed during this study are included in this published article/as Supplementary Information Files.
Acknowledgments
Thanks to the above authors for their help in various aspects. Thanks for the project support of the Efficient Utilization of Tarim Sheep Germplasm Resources (2019CB010).
Disclosure Statement
The authors declare that there are no competing interests associated with the article.
Funding Information
This study was supported by the Efficient Utilization of Tarim Sheep Germplasm Resources (2019CB010) bankroll.