




Abstract
We have assessed the impact of three single nucleotide polymorphisms (SNPs) of Forkhead Box O1 (FOXO1) and their interaction on susceptibility of type 2 diabetes mellitus in geriatric population from northern India. We genotyped three SNPs (rs2721068, rs17446614, and rs4581585) of FOXO1 gene in 190 elderly individuals with diabetes and 182 unrelated healthy controls of similar ethnicity by using TaqMan SNP assays. SNP-SNP and SNP-environment interactions among polymorphic loci were studied by the multifactor dimensionality reduction (MDR) method. The AA genotype carriers of rs17446614 was associated with the increased susceptibility of diabetes in both adjusted and unadjusted model, whereas rs4581585 was associated with the risk in unadjusted model only. Genotype and minor allele interaction with quantitative parameters revealed that AA genotype of rs17446614 had significantly higher fasting plasma glucose (FPG) in diabetic subjects, also minor allele (A) in patients was positively associated with FPG and glycated hemoglobin. Haplotype Trs2721068Grs17446614Trs4581585 increases the risk of diabetes, whereas carrier of haplotypes Crs2721068Grs17446614Crs4581585 and Crs2721068 Grs17446614Trs4581585 were protective. The MDR analysis revealed that interaction of rs17446614 with body mass index (BMI) increased the susceptibility of diabetes. Therefore presence of rs17446614 variant and its interaction with BMI and haplotype Trs2721068Grs17446614Trs4581585 modulates the risk of diabetes and can be used as a promising tool for identifying high-risk individuals.
Introduction
Multiple genetic and environmental factors as well as their interaction are involved in the aging and pathogenesis of type 2 diabetes mellitus (T2DM). Both aging and T2DM are linked at the molecular level; even T2DM can be considered as an accelerated model of aging (Geesaman, 2006). Aging increases the incidence of T2DM in genetically susceptible individuals. The genetic factors contribute ∼25% variation in the human life span and are mainly apparent after the age of 60 years (Skytthe et al., 2003).
Forkhead Box O1 (FOXO1) gene is located on chromosome 13q14.11 and encodes the FOXO1 protein, which acts as one of the regulating factor in various physiological pathways related to aging, diabetes, and other age-related pathological conditions (Geesaman, 2006). FOXO1 could combine with a promoter by shuttling into the nucleus and activating the transcription activity of the target genes (Xu et al., 2017). The FOXO1 gene encodes a transcription factor that regulates the transcription of genes involved in the various physiological and pathological conditions like cell cycle, apoptosis, gluconeogenesis, adipogenesis, β-cell proliferation, inflammation, and oxidative stress (Myatt and Lam, 2007; Golson and Kaestner, 2016).
Single nucleotide polymorphisms (SNPs) are associated with T2DM, either in the form of regulatory noncoding SNPs or as missense coding SNPs that cause direct changes to amino acids within a protein (Mahajan et al., 2018). Genes that are considered to predict or be associated with T2DM disrupt energy homeostasis, β-cell function and proliferation, insulin action, and adiposity (McCarthy and Zeggini, 2009; Wheeler and Barroso, 2011). The functional role and their molecular mechanism of these FOXO1 SNPs are not well established; however, it might be possible that these variants altered β-cell function. SNPs in FOXO1 were found to be associated with, impaired glucose tolerance, T2DM, and diabetic nephropathy in different population.
In complex and multifactorial diseases such as T2DM, the effect of each single SNP is too small to explain the significant disease association; therefore, proper selection of SNPs and their interaction studies are important. Selected SNPs (rs2721068, rs17446614, and rs4581585) reported to affect various interlinked pathways involved aging and diabetes (Müssig et al., 2009; Tan et al., 2013; Zhao et al., 2017); therefore, we chose to established the role of three variants of FOXO1 in the risk of T2DM in the elderly population.
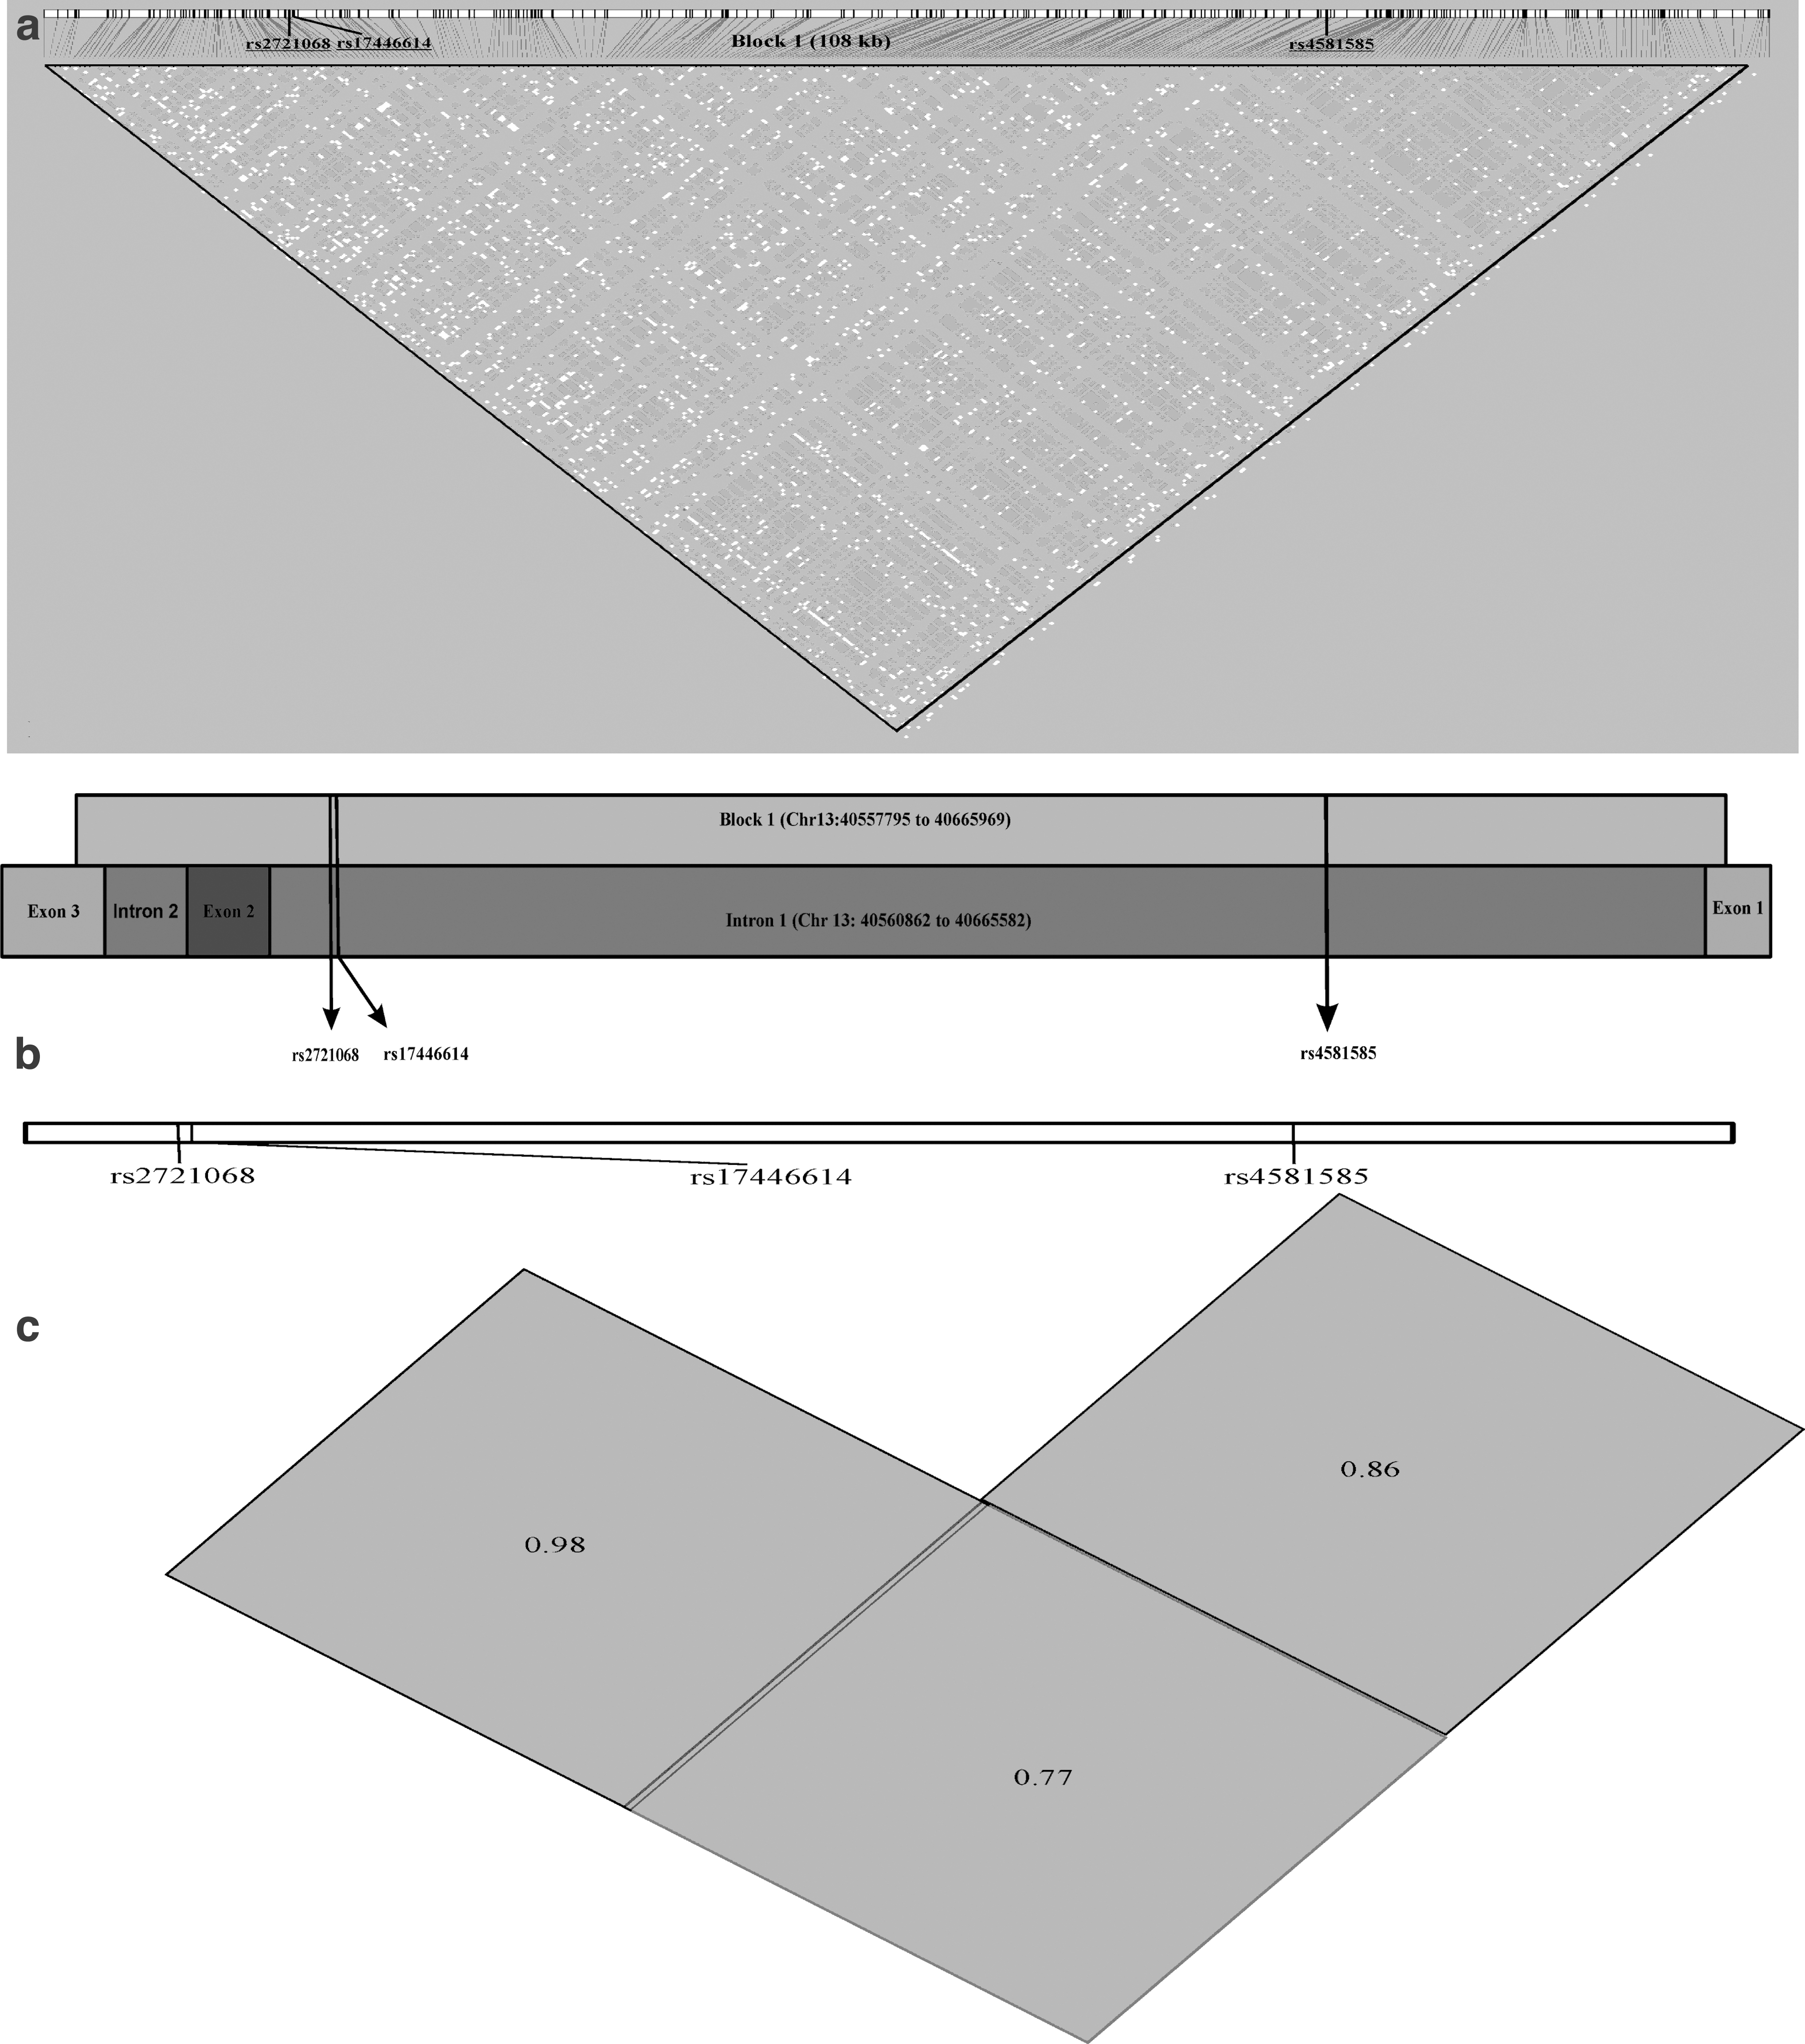
The Haploview plot indicating the boundaries of the block of linkage disequilibrium (LD) and relative positions of selected SNPs of FOXO1 are given in Figure 1a–c. We have drawn the genome coordinates and schematic representation of introns/exons covered by LD block harboring all three SNPs (Gabriel et al., 2002). Along with genetic risk, we also investigated how the genotypes affect the various clinical determinants of diabetes and aging in determining the outcomes in our target population, that is, north Indian geriatric population.
Materials and Methods
Study design, selection of patients, and ethical aspects
The protocol was approved by the institutional ethics committees (Ref. code: 90th ECM II
All subjects were recruited from the outpatient department of internal medicine of a tertiary care medical institute from northern India. The individuals defined as healthy controls were individuals of either sex who were 60 years of age and older, nondiabetic, and not on any regular medication for any disease, and having fasting plasma glucose (FPG) < 100 mg/dL and HbA1c < 6.5%. The inclusion criteria for T2DM subjects were age 60 years and older, diagnosed as per International Diabetes Federation guideline, 2017 (IDF, 2017). Subjects with type 1 diabetes, taking insulin therapy, or having any chronic infection, inflammation, or cancer were excluded from the study.
Data collection, clinical and biochemical measurements
The body mass index (BMI) and blood pressure were measured as per the WHO STEPwise Approach to Surveillance (STEPS) Manual (WHO-STEPS, 2021). Five milliliters of fasting venous blood sample was collected from each subject by venepuncture from the antecubital vein. The sample was distributed into three parts as follows: 2 mL in ethylenediaminetetraacetic acid (EDTA) vial for glycated hemoglobin (HbA1c) estimation and DNA isolation, 1 mL in fluoride vial for FPG estimation, and 2 mL in a plain vial for serum separation. The serum sample and 1 mL of blood in EDTA vial was stored at −20°C for enzyme-linked immunosorbent assay (ELISA) testing and DNA extraction, respectively.
The lipid profile and FPG were measured by auto-analyzer (Roche), whereas HbA1c was estimated by high-performance liquid chromatography (Waters) method. The cytokines level was quantified by ELISA method using commercially available kit (Ray Biotech). The homeostatic model assessment of insulin resistance and beta-cell function (HOMA-IR and HOMA-β) were estimated using the standard formulae (Matthews et al., 1985).
Analysis of SNPs, genotyping, and quality control of genetic parameters
Genomic DNA was extracted from peripheral leukocytes by modified salting-out method standardized in our laboratory (Yadav et al., 2014). Each DNA sample was stored at −20°C until genotyping. The rs2721068, rs17446614, and rs4581585 were genotyped by TaqMan™ SNP Genotyping Assays (Applied Biosystems, Foster City) (Catalog No. 4351379, Assay ID rs2721068: C__15926654_10, rs17446614: C__32756499_10, rs4581585: C__11302600_10).
The PCRs were performed in a total volume of 25 μL containing TaqMan SNP Genotyping Assay 1.25 μL, TaqMan Genotyping Master Mix (Catalog No. 4371355) 12.5 μL, genomic DNA and DNase-free water 11.25 μL. The amplifications were performed in a StepOnePlus™ Real-Time PCR System (Applied Biosystems) under the following conditions: 95°C for 10 min, followed by 40 cycles at 95°C for 15 s, and 60°C for 1 min. The allelic discrimination method was used to assign the genotypes. Positive and negative controls were used in each genotyping assay, and random samples (5%) for each SNP were re-genotyped for quality control.
Statistical methodology and analysis of data
Data are expressed as mean ± standard deviation for continuous variables and number (%) for categorical variables. Continuous variables were compared by unpaired Student's t-test or one-way analysis of variance (ANOVA) test and χ2 test was applied for categorical variables. The risk of T2DM under different genetic models was estimated by binary logistic regression analysis in unadjusted and adjusted model. The interaction of alleles with quantitative variables was evaluated by linear regression analysis after loge transformation of non-normally distributed variables.
The multifactor dimensionality reduction (MDR) software (MDR3.0.2) was used to detect the interactions of SNP-SNP and SNP–environmental factors on T2DM susceptibility. If interactive models were found statistically significant (p < 0.05), then MDRpt-1.0_beta_2 software was applied to compute the p-value for 1000 permutations. The haplotype analysis and LD analysis were performed by SHEsis online after removing the subjects with missing SNP. The rest of the statistical analyses were performed using SPSS v. 25 (IBM SPSS, Inc., Chicago, IL).
Results
Demographic, clinical, and laboratory parameters of study samples
The sample consisted of 190 subjects with T2DM and 182 nondiabetic healthy control subjects. Demographic, clinical, and laboratory parameters of cases and controls are given in Table 1. BMI, blood pressure, and lipid parameters were significantly altered in T2DM patients. FPG, HbA1c, fasting insulin, and HOMA-IR were significantly higher, whereas HOMA-β was lower in T2DM subjects as compared with healthy controls. Serum levels of CRP, tumor necrosis factor-alpha (TNF-α), and interleukin (IL)-6 were increased, whereas IL-10 and adiponectin were lower in cases as compared with controls. There was no significant difference in insulin-like growth factor 1 (IGF-1) level in both groups, whereas serum cortisol level was significantly increased in cases.
Demographic, Clinical, and Biochemical Parameters of Type 2 Diabetes Mellitus and Control Subjects
Statistically significant values are shown in bold.
The results are represented as mean ± SD (compared by unpaired Student's t-test) or percentage (compared by chi-square test). p < 0.05 considered significant.
p-value of BMI, FPG, HbA1c, triglyceride, HDL-C, fasting insulin, HOMA-IR, HOMA-β, CRP, TNF-α, IL-6, cortisol, IGF-1, IL-10, and adiponectin are calculated after loge transformation.
HOMA-IR, homeostasis model assessment of insulin resistance; HOMA-β, homeostasis model assessment of β-cell function; BMI, body mass index; BP, blood pressure; CRP, C-reactive protein; FPG, fasting plasma glucose; HbA1c, glycated hemoglobin; HDL-C, high-density lipoprotein cholesterol; IGF-1, insulin-like growth factor 1; IL-6, interleukin 6; IL-10, interleukin 10; LDL-C, low-density lipoprotein cholesterol; SD, standard deviation; TNF-α, tumor necrosis factor-alpha.
Association of genotype, allele frequencies to the susceptibility of T2DM
The genotype frequency distribution of all FOXO1 SNPs was in accordance with Hardy–Weinberg equilibrium in the control group and in the T2DM group (p > 0.05). There were no significant (p > 0.05) differences in the genotype and allele frequencies for all SNPs between the cases and controls (Table 2).
Comparison of Genotypic and Allelic Frequencies of FOXO1 SNPs Between Control and Type 2 Diabetes Mellitus Patients
Chi-square test for genotype distributions between cases and controls.
Chi-square test for allele distributions between cases and controls.
M = major allele; m = minor allele.
CI, confidence interval; FOXO1, Forkhead Box O1; OR, odds ratio; SNP, single nucleotide polymorphism.
The single-locus analysis revealed that FOXO1 gene locus rs2721068 was not associated with the risk of T2DM in any genetic model. The AA genotype carriers of FOXO1 gene locus rs17446614 had increased susceptibility of T2DM in codominant 2 (GG vs. AA, odds ratio [OR] = 3.40, 95% confidence interval [CI] = 1.20–9.62, p = 0.021) and recessive models (GG+GA vs. AA, OR = 3.29, 95% CI = 1.18–9.19, p = 0.023). After being adjusted for age, gender, BMI, smoking, and drinking status, both associations were still significant. FOXO1 gene locus rs4581585 had increased the susceptibility of T2DM in codominant 1 (CC vs. CT, OR = 1.67, 95% CI = 1.03–2.72, p = 0.037) and dominant model (CC vs. CT+TT, OR = 1.60, 95% CI = 1.02–2.52, p = 0.042) but after adjusting for covariates, both associations lost their significance (Table 3).
FOXO1 SNPs and Susceptibility to Type 2 Diabetes Mellitus Under Different Genetic Models
Statistically significant values are shown in bold.
Data were calculated by logistic regression analysis. Coding in genetic models: codominant 1 (MM = 0, Mm = 1), codominant 2 (MM = 0, mm = 1), dominant (MM = 0, Mm = 1, mm = 1) recessive (MM = 0, Mm = 0, mm = 1), additive model (MM = 0, Mm = 1, mm = 2).
Unadjusted values.
Adjusted for age, gender, logeBMI, smoking, drinking.
Analysis of haplotype
The combined effects of FOXO1 gene three SNPs on T2DM susceptibility were estimated by haplotype analysis (Table 4). The global χ2 and p-value for haplotype analysis was 12.46 and 0.014, respectively. Trs2721068Grs17446614Trs4581585 was the most common haplotype in control and T2DM subjects. Haplotype analysis showed that haplotype Trs2721068Grs17446614Trs4581585 (OR = 1.36, 95% CI = 1.01–1.83, p = 0.042) increases the risk of T2DM, whereas carriers of haplotypes Crs2721068Grs17446614Crs4581585 (OR = 0.65, 95% CI = 0.44–0.98, p = 0.037) and Crs2721068Grs17446614Trs4581585 (OR = 0.41, 95% CI = 0.17–1.02, p = 0.048) decrease the risk of T2DM, although no significant association was detected for other haplotypes. Haplotype analysis also showed LD between rs2721068 and rs17446614 (D′ = 0.98), rs2721068 and rs4581585 (D′ = 0.77), rs17446614 and rs4581585 (D′ = 0.86).
Haplotype Analysis of Three Polymorphism Sites of FOXO1
Statistically significant values are shown in bold.
SNPs sequence: rs2721068, rs17446614, rs4581585. Global χ2 = 12.46, p-value = 0.014.
Interaction of FOXO1 gene and environment on the susceptibility of T2DM: SNP-SNP, SNP–environmental interaction analysis
The MDR analysis method was applied for the interaction between three SNPs and environmental factors (BMI, diet, smoking, drinking, and hypertriglyceridemia). The environmental factors were dichotomized before analysis (BMI: <25 kg/m2 or ≥25 kg/m2; diet: vegetarian or nonvegetarian; smoking: yes or no; drinking: yes or no; hypertriglyceridemia: triglyceride level <150 mg/dL or ≥150 mg/dL). We used two models for interaction analysis: in the first model, three SNPs were used as input variables, whereas in the second model, three SNPs and environmental factors were used as input variables. In first model, the three SNPs did not show any significant interaction for risk of T2DM (p > 0.05).
In the second model, the analysis showed that the best model had two factors (rs17446614 and BMI), which enhanced 5.31-fold risk of T2DM in the “high-risk group” in comparison with the “low-risk group” (OR = 5.31, 95% CI = 1.27–22.21, p = 0.0185) (Table 5 and Fig. 2).
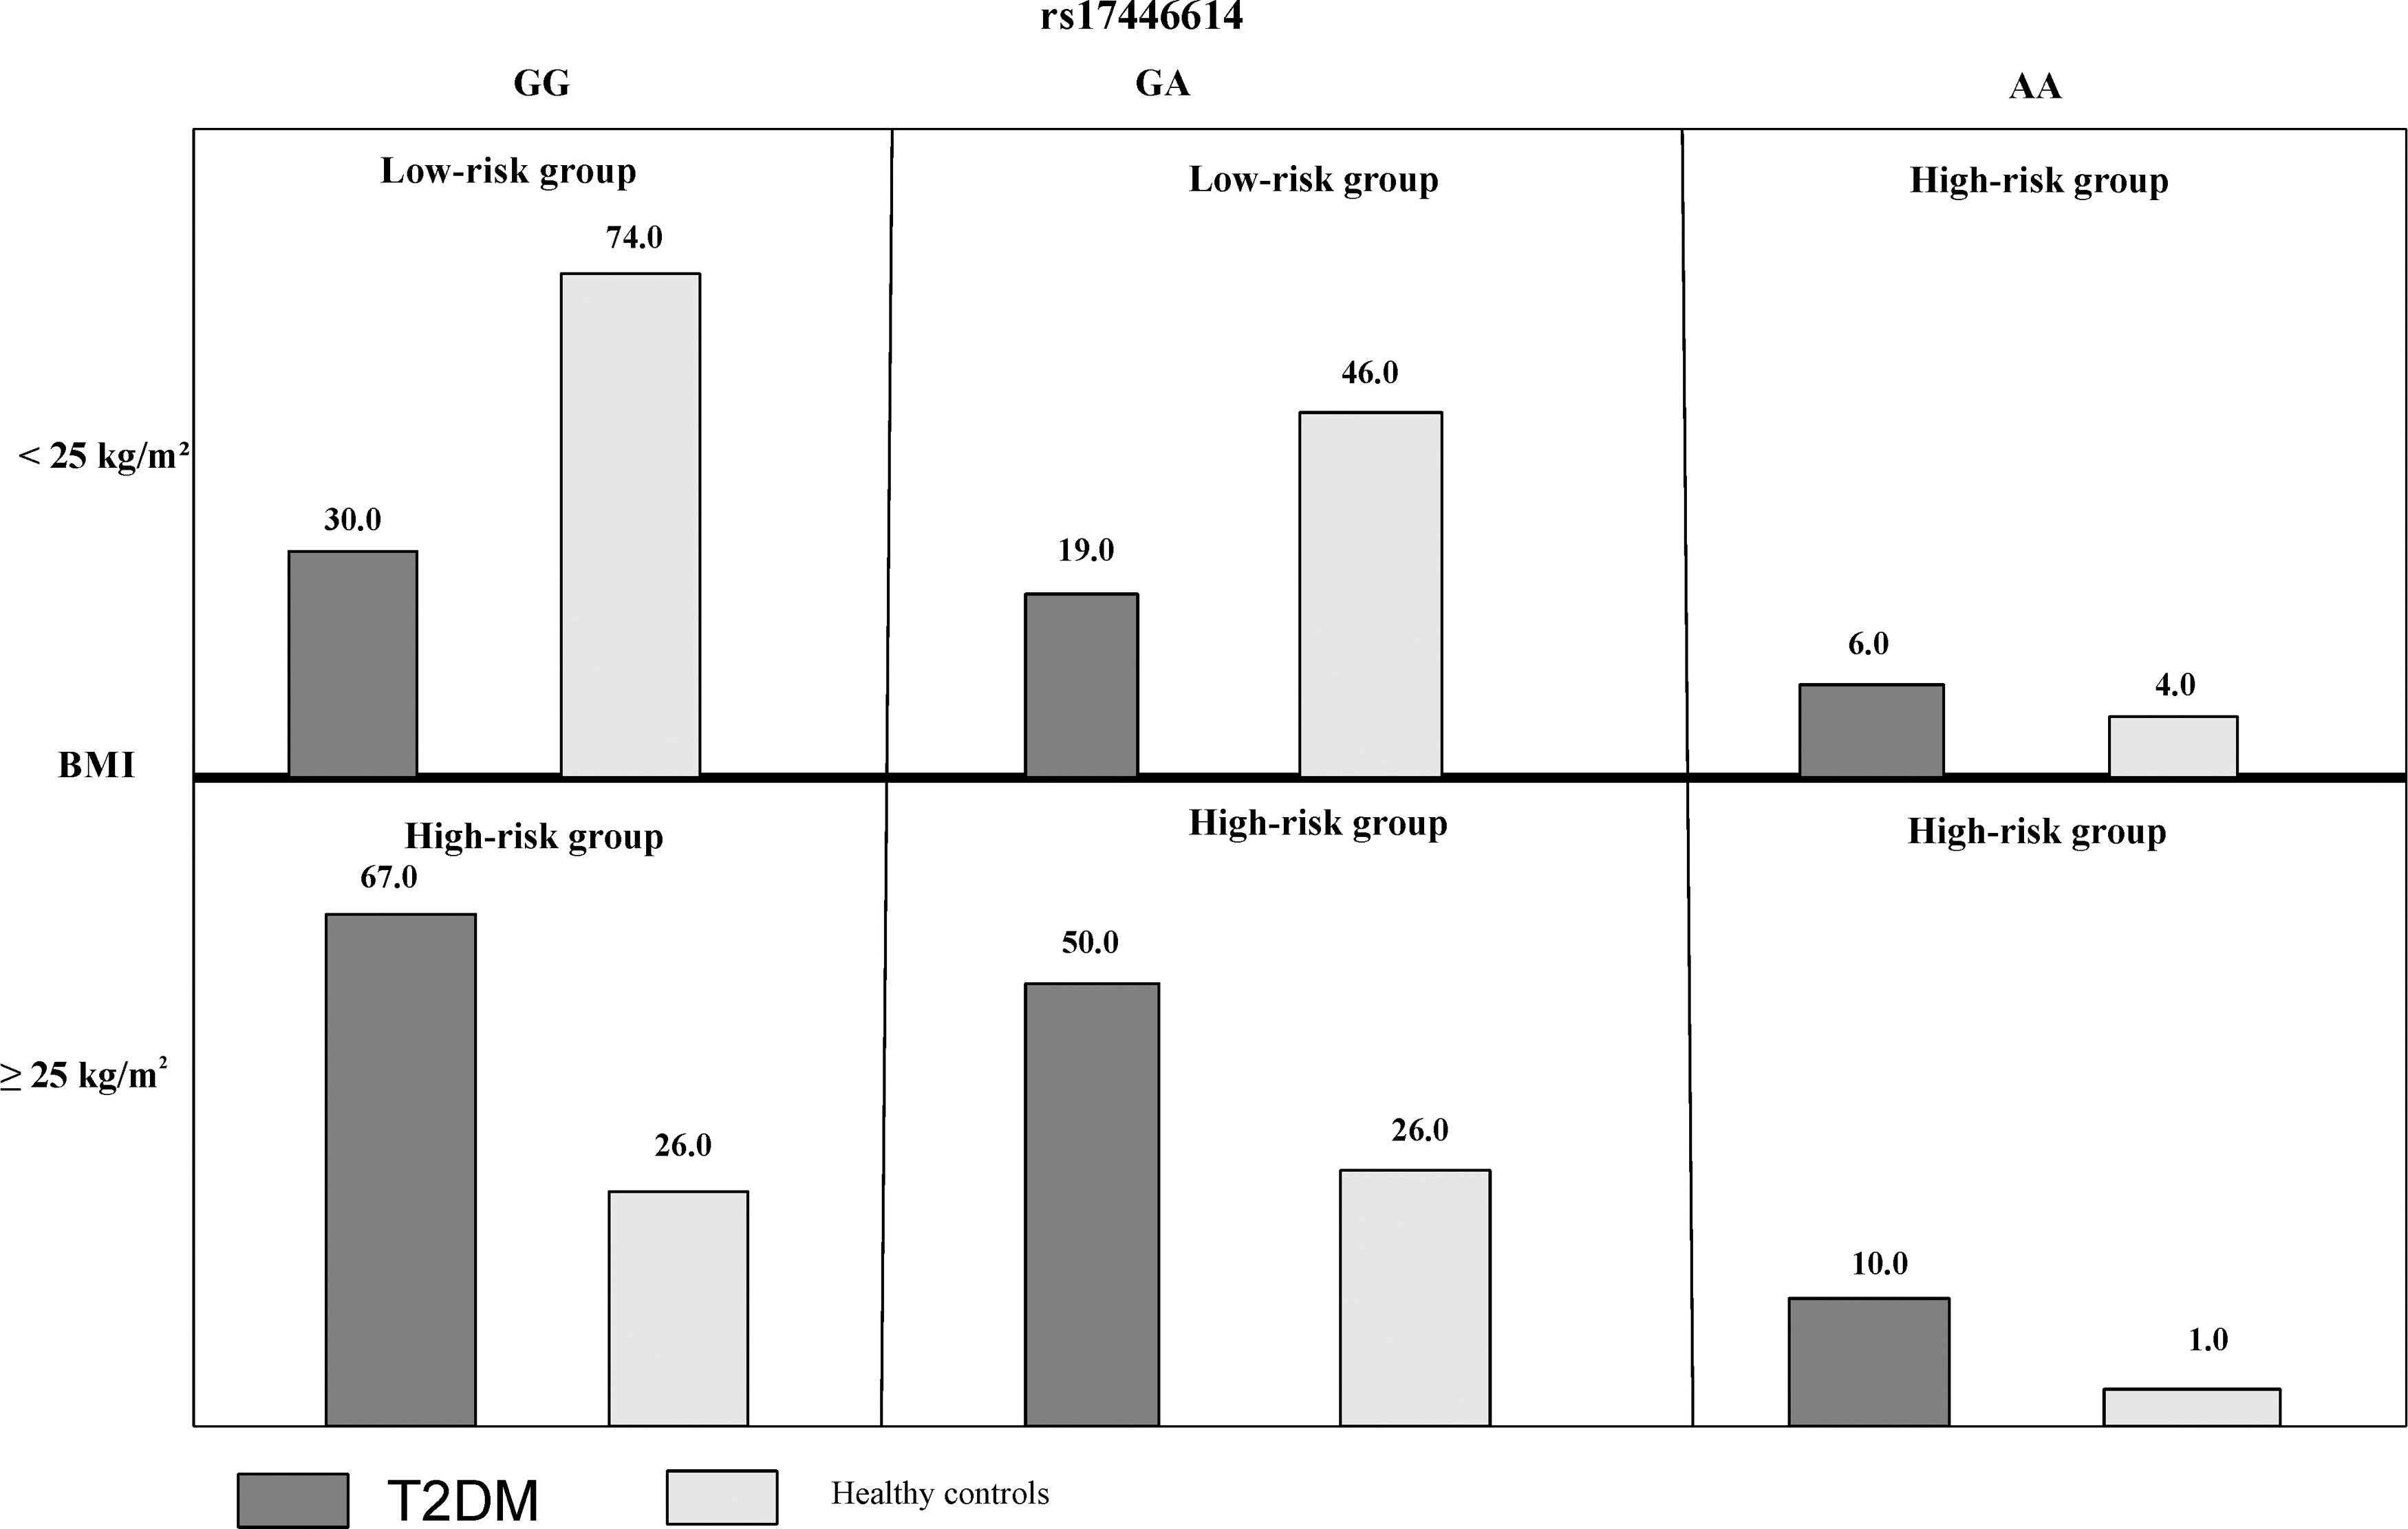
Distribution of high-risk and low-risk genotypes in the best 2-factor model. The number of T2DM patients (left bar in dark shaded) and control subjects (right bar in light shaded) are shown for each 2-factor combination, rs17446614: GG, GA, AA, and BMI: <25 kg/m2 or ≥25 kg/m2. BMI, body mass index; T2DM, type 2 diabetes mellitus.
MDR Models of SNP-SNP and SNP-Risk Factors Interactions for T2DM Susceptibility
Statistically significant values are shown in bold.
MDR, multifactor dimensionality reduction; T2DM, type 2 diabetes mellitus.
Effect of genotype and minor allele on tested parameters in T2DM patients
One-way ANOVA method was applied to determine the associations with the demographic and biochemical parameters between genotypes in case and control groups (Supplementary Tables S1–S6). We did not find any statistically significant differences for any tested variables except for FPG in rs17446614 genotypes in T2DM patients (p = 0.040). On post hoc analysis, FPG was significantly higher in the AA genotype (195.65 ± 46.07 mg/dL) as compared with the GG genotype (168.57 ± 36.75 mg/dL) (p = 0.040); however, there was no significant difference for AA versus GA (177.00 ± 45.08 mg/dL) and GG versus GA genotype (p > 0.05).
We analyzed the association between alleles and quantitative parameters in this study by linear regression (Supplementary Tables S7 and S8). The minor allele did not show any significant association with the quantitative parameters except FPG and HbA1c in rs17446614 in T2DM patients. The rs17446614, minor allele (A) in T2DM patients was positively associated with FPG (β = 0.19, p = 0.009) and HbA1c (β = 0.14, p = 0.048).
Discussion
The time of onset of various age-related diseases (T2DM, cancer, and cardiovascular disease) is one of the limiting factors for the human life span. The genes and pathways related to T2DM and longevity may interact and modulate among each other. The evolutionarily conserved insulin/IGF-1 signaling (IIS) pathway is linked to both longevity and T2DM (Geesaman, 2006; Pan and Finkel, 2017). FOXO1 gene is located on chromosome 13: 40555667–40666641 and downward target of IIS pathways (Tazearslan et al., 2012). In our study, we investigated the FOXO1 variants and their effects on major hallmarks of inflammation and aging between unrelated north Indian elderly individuals.
We studied three SNPs of FOXO1 gene and found that rs17446614 is associated with the risk of T2DM, whereas there were no significant association observed for FOXO1 rs2721068 and rs4581585. Our results partially match with the results of Müssig et al. (2009) where they have reported that both SNPs rs2721068 and rs17446614 were linked to β-cell dysfunction and impaired glucose tolerance and thereby increased the risk of diabetes in German subjects. In a similar study, researchers have also selected a separate cohort of Finnish men and reported that rs2721068 was significantly associated with T2DM in the additive and dominant model in genotyping studies.
Therefore, it might be possible that genetic variation within the FOXO1 gene affects insulin secretion and glucose tolerance, which further leads to an increased risk of T2DM; however, physiological factors including aging might affect onset of the disease. In another study, Gong et al. (2017) reported that rs4325426 locus AA in FOXO1 gene might be a high-risk factor of T2DM in Chinese Han population. Their genetic study on seven polymorphism sites of FOXO1 and IRS2 gene indicated FOXO1–obesity interaction as a key factor for the risk of T2DM. Ethnic difference and genetic background might be responsible for variable results.
We investigated the association between selected SNPs genotype and minor allele interaction with various clinical determinants of diabetes. Only AA genotype of rs17446614 was associated with high FPG and the minor allele (A) was associated with high FPG and HbA1c in T2DM subjects. Whereas in German middle-age individuals at increased risk for T2DM, the rs17446614 AA genotype was found to be associated with higher fasting glucose, there was no significant difference for the rs2721068 genotype. BMI was not associated with both rs17446614 and rs2721068 (Müssig et al., 2009).
It was evident that disruption of glucose metabolism is characteristic of both, aging and T2DM. Insulin and IGF-1 through FOXOs regulates glycogenolysis and gluconeogenesis by regulating the gene expression of phosphoenolpyruvate carboxy-kinase, glucose 6-phosphatase, and pyruvate dehydrogenase kinase-4 genes (Nakae et al., 2001; Daitoku and Fukamizu, 2007). FOXO1 inhibits beta-cell proliferation. Studies showed that gain of function of FOXO1 in liver and β cell results in enhanced hepatic glucose production and hampered β-cell compensation in mice (18). An experimental mice with liver-specific knockout of FOXO1 had lower blood glucose and improved glucose tolerance test, and haploinsufficiency of FOXO1 restores insulin sensitivity, beta-cell proliferation, and mass (Nakae et al., 2002; Zhang et al., 2012).
FOXO1 regulates transcription control hepatic angiotensinogen (Agt) and serum level of agt and angiotensin II (Ang II) and modulates blood pressure (Qi et al., 2014). However in our study, we did not observe any significant association of systolic blood pressure, diastolic blood pressure, and lipid parameters with genotypes of selected SNPs and their minor allele in both case and control groups. Following previous studies on the Korean and German populations, we did not observe any association of FOXO1 SNPs with BMI (Kim et al., 2006a; Müssig et al., 2009).
However, animal studies revealed that FOXO1 decreases cholesterol and TG synthesis by suppressing the expression of sterol regulatory element-binding protein, and also promotes fatty acid and lipolysis by activating carnitine palmitoyl-transferase and lipases genes (Dong et al., 2008; Pan et al., 2017). Genotype variability in FOXO1 might affect the spatiotemporal expression of genes related to cholesterol synthesis, although there are limited evidences.
Both aging and T2DM showed an imbalance between pro and anti-inflammatory molecules resulted in chronic low-grade systemic inflammation and enhanced mortality risk (Bruunsgaard et al., 2001). FOXO1 activates the pro-inflammatory TLR4 pathway in macrophages and also suppresses the effect of insulin on inflammation (Graves and Milovanova, 2019).
In our study, we did not observe any significant difference in the serum level of pro and anti-inflammatory cytokines between genotype groups of selected SNPs in both T2DM and control groups. FOXO1 increases the production of proinflammatory mediators (IL-1β, TNF-α, and IL-6) and decreases the production of anti-inflammatory mediators (IL-10) by activating the TLR4 and NF-κB in macrophages (Ito et al., 2009; Graves and Milovanova, 2019). Adiponectin is involved in the pathophysiology of both T2DM and obesity, its higher level associated with a lower risk for impaired glucose metabolism and T2DM (Snijder et al., 2006).
However, contradictory reports are available regarding adiponectin concentration in elderly human subjects. A study conducted by Isobe et al. (2005) reported increased concentration of adiponectin with age in healthy subjects, whereas Adamczak et al. (2005) reported similar trend in healthy male subjects only. Vilarrasa et al. (2005) reported a decline in adipokine levels with age and its negative association with fat mass. In our population adiponectin level was significantly decreased in geriatric patients with T2DM; also presence of SNP does not affect adiponectin level in our population. In a report, Kedenko et al. (2012) studied the interaction of minor allele of FOXO1 SNPs (rs2721068, rs17446614, rs10507486, rs17446593, and rs2297627) in three European cohorts. They did not find any significant interaction of minor allele with serum adiponectin levels.
FOXO1 is also involved in energy homeostasis and depending on energy demand, modulates the cellular metabolism by catabolic hormones and insulin signaling (Kim et al., 2006b). The glucocorticoids upregulate the expression of FOXO1 by binding to multiple glucocorticoid response elements in the FOXO1 gene (Qin et al., 2014). In our study, we had observed increased cortisol level in cases as compared with control, whereas its level was not associated with the genotype and minor allele of all three SNPs in both T2DM and control groups.
Haplotype analysis has more statistical power than a single SNP because it contains multiple SNPs located in the same homologous chromosome and descended together. We identified three haplotypes in FOXO1, Trs2721068Grs17446614Trs4581585 increased, whereas Crs2721068Grs17446614Crs4581585 and Crs2721068Grs17446614Trs4581585 decreased the susceptibility of T2DM. The environmental factors play a significant role in the pathogenesis of type 2 diabetes; however, the rate of T2DM susceptibility varies between individuals, even with the same exposure levels, susceptibility to the disease can vary between individuals, which may be owing to different interactions between T2DM susceptibility genes and environmental factors.
In this study, we investigated the effect of SNP-SNP and SNP–environment interaction on the risk of T2DM by the MDR method. The MDR analysis revealed that the interaction model consists of rs17446614, and BMI was the best model for statistical significance. A study by Gong et al. (2017) showed that FOXO1 SNPs interaction with obesity increased the risk of T2DM. Therefore, development of genetic risk scores using combined analysis of loci has significantly contributed to predicting the susceptibility of T2DM in elderly individuals.
Conclusion
The FOXO1 rs17446614 and its interaction with BMI and haplotype (TGT) increase the susceptibility of T2DM in the North Indian geriatric population. The rs17446614 minor allele homozygous genotype has significantly higher FPG, and minor allele confers a significant increase in FPG and HbA1c. The FOXO1 gene haplotype CGC and CGT have a protective effect against T2DM. Therefore, FOXO1 might be a key factor in studying the pathophysiology and personalized treatment strategy for age-related diabetes.
Our study has certain limitations like selected SNPs were located in the intronic region, therefore, the mechanism of these SNPs in the pathogenesis of T2DM remains obscure. The study has a limited sample size, and target population belonged to north India only. Further studies with large sample sizes and other ethnic groups with different allele frequencies is required to validate our results.
Footnotes
Acknowledgment
The authors thank Durgesh Yadav for providing technical support during the study.
Disclosure Statement
No competing financial interests exist.
Funding Information
The authors thank the Indian Council of Medical Research (ICMR) for providing a fellowship to S.H. and funding support during the course of study.
Supplementary Material
Supplementary Data
Supplementary Table S1
Supplementary Table S2
Supplementary Table S3
Supplementary Table S4
Supplementary Table S5
Supplementary Table S6
Supplementary Table S7
Supplementary Table S8
References
Supplementary Material
Please find the following supplemental material available below.
For Open Access articles published under a Creative Commons License, all supplemental material carries the same license as the article it is associated with.
For non-Open Access articles published, all supplemental material carries a non-exclusive license, and permission requests for re-use of supplemental material or any part of supplemental material shall be sent directly to the copyright owner as specified in the copyright notice associated with the article.
