




Abstract
Caveolin-1 (CAV1) is one of the members of the caveolae, and the role of CAV1 in esophageal cancer (ESCA) is not completely clear. In this study, we found that expression of CAV1 was downregulated in ESCA in The Cancer Genome Atlas and the Genotype-Tissue Expression (GTEx) database and we also use immunohistochemistry of tissue microarray for verification. Then, we used bioinformatics methods to investigate the prognostic value of CAV1, influence on immune cell infiltration in tumor microenvironment (TME) and responding to immunotherapy in ESCA. Our result indicated that CAV1 designs an inflamed TME in ESCA based on the evidence that CAV1 positively correlated with immunomodulators, immune score, stomal score, cancer immunity cycles, tumor-infiltrating immune cells, T cell inflamed score, and immune checkpoints. Immunophenoscore, Tumor Immune Dysfunction and Exclusion algorithms, and the mutation analysis show that the downregulated CAV1 expression indicated higher tumor mutation burden and higher rate of response to immune checkpoint inhibitors (ICIs) in the low-expression group. In a word, our study demonstrated the impact of CAV1 to the TME in ESCA and it may be a new target for ESCA immunotherapy. In addition, the expression of CAV1 can predict the clinical response to ICIs, which may provide clinical treatment guidance.
Introduction
Esophageal cancer (ESCA), a common malignant tumor of digestive tract, is the sixth leading cause of cancer death in the world (Bray et al, 2018; Siegel et al, 2020). The 5-year relative survival rate of esophageal cancer is low, because patients of ESCA are usually diagnosed at an advanced stage (Siegel et al, 2020). Therefore, early diagnosis of ESCA is important for improving the prognosis. The treatment of ESCA has been developing.
Endoscopic mucosal resection is used for early ESCA or the tumor is localized and esophagectomy with lymph node dissections combined with adjuvant therapy and neoadjuvant chemotherapy, chemoradiotherapy, or comprehensive treatment is used for advanced ESCA or regional esophageal tumors (Huang and Yu, 2018; Short et al, 2017). However, long-course palliative radiotherapy has large side effects and the 5-year relative survival rate of locally advanced ESCA patients and advanced/metastatic disease is low even with surgery, neoadjuvant chemoradiotherapy, definitive chemoradiotherapy, and other comprehensive treatments (Hsu et al, 2022; Ólafsdóttir et al, 2021).
In recent years, immunotherapy becomes a very promising method for many advanced cancers such as melanoma and non-small-cell lung cancer, and it has achieved curative efficacy in clinical trials (Barlesi et al, 2020; Zaremba et al, 2021). Although some clinical trials showed promising results that immune checkpoint inhibitors (ICIs) can significantly improve disease-free survival of ESCA patients (Kelly et al, 2021; Kojima et al, 2020), still a proportion of patients do not respond to this therapy. Therefore, it is urgent to explore the novel molecular targets that affect the response to ICIs, which can better guide clinical medication.
Caveolin-1 (CAV1) is one of the members of the caveolin gene family that is essential for the caveolae formation (Bastiani and Parton, 2010). CAV1 is the most universally expressed protein, especially on the surface of endothelial cells and participates in the formation of caveolin scaffolding domain that interacts with a variety of signal molecules to regulate cell signals involved in cell transformation, proliferation, apoptosis, metastasis, and carcinogenesis (Baker and Tuan, 2013).
The upregulation of CAV1 stimulates the proliferation of mouse embryonic stem cells through the PI3K/Akt, ERK1/2 signaling pathways (Park et al, 2009; Shack et al, 2003). Besides, the downregulation of CAV1 activates MEK/ERK and PI3K/Akt pathways in MCF-7 human breast cancer cells and promotes the growth of cells (Feng et al, 2010).
CAV1 plays a dual role in cancer, with studies showing a suppressor or promoter in cancer depending on tumor type through different signaling pathways (Gupta et al, 2014; Núñez-Wehinger et al, 2014; Rodriguez et al, 2009; Wong et al, 2020). In ESCA, several studies show that upregulation of CAV1 expression in tumor cell can promote the migration and invasion of esophageal squamous cell carcinoma (ESCC) cells, but downregulation of CAV1 is a poor prognostic marker in ESCC patients (Jia et al, 2014; Liu et al, 2017, p.).
The tumor microenvironment (TME) is the environment surrounding tumor (Xiao and Yu, 2021). It has stromal and tumor-associated immune cells that influence tumor progression and treatment response (Barry et al, 2018).
To evaluate the influence of CAV1 on prognosis of ESCA patients and TME, we compared mRNA expression level of CAV1 in ESCA tissues and normal esophageal tissues by using The Cancer Genome Atlas (TCGA), Genotype-Tissue Expression (GTEx) database and using immunohistochemistry (IHC) of tissue microarray (TMA) to validate. We also analyzed the immunological role of CAV1 and its value of predicting response to ICIs in ESCA. It seems that CAV1 may be a new target for ESCA immunotherapy and the expression of CAV1 can predict the clinical response to ICIs, which may provide clinical treatment guidance.
Materials and Methods
Data acquisition
The 33 cancer types RNA sequencing data, clinical data in TCGA database were obtained from UCSC Xena (
CAV1 gene expression analysis
The expression of CAV1 in normal tissue and tumor tissue across 33 cancers and among different clinicopathological characteristics in ESCA was compared using the Wilcoxon test. The results were visualized using the R packages “ggplot2.” R software v4.0.3 for statistical analysis.
Gene ontology term and Kyoto Encyclopedia of Genes and Genomes pathway enrichment analysis and gene set enrichment analysis
We divided the ESCA cohort of TCGA into two groups (low-expression group and high-expression group) according to CAV1 gene expression level and used limma package of R software to identify the differential expression of mRNAs between two groups. The adjusted p-value was analyzed to correct for false positive results in ESCA. “Adjusted p < 0.05 and Log (Fold Change) >1 or Log (Fold Change) ≤1” were defined as the thresholds for the screening of differential expression of mRNAs.
To further confirm the potential functions and metabolic pathways of these differentially expressed genes (DEGs), we used gene ontology (GO) analysis to determine the biological processes, cellular components, and molecular functions and use Kyoto Encyclopedia of Genes and Genomes (KEGG) pathway enrichment analysis to enrich pathway. Both GO and KEGG were performed by the R package “ClusterProfiler” (Yu et al, 2012). In the enrichment result, p < 0.05 or false discovery rate <0.05 is considered to be enriched to a meaningful pathway. Moreover, gene set enrichment analysis (GSEA) was performed to determine gene sets of statistical difference (Subramanian et al, 2005).
Evaluation of the immunological characteristics of the TME in ESCA
To further analyze the relationship between expression of CAV1 and immune, we compared the expression of immunomodulators, immune scores, and stromal scores that were calculated using the ESTIMATE algorithm (Yoshihara et al, 2013), activity of the cancer immunity cycle, and the proportions of infiltrating immune cells in two groups. The cancer immunity cycle including seven steps reflects the anticancer immune response (Chen and Mellman, 2013), which was calculated by using TIP web server (
To evaluate the relationship between CAV1 and immunotherapy, we analyzed the difference of immune checkpoints expression level between two groups and used the Tumor Immune Dysfunction and Exclusion (TIDE) algorithm to estimate the ICIs response of ESCA patients. Also, pan-cancer T cell-inflamed score, which could define pre-existing cancer immunity, and perhaps predict the response of ICI (Ayers et al, 2017, p.), and immunophenoscore (IPS) (Charoentong et al, 2017) were calculated for further validation.
Tumor Immune Estimation Resource analysis
Tumor Immune Estimation Resource 2.0 (TIMER2.0;
Survival analysis and Kaplan-Meier plotter database analysis
Kaplan-Meier plotter (
Mutation analysis
TCGA ESCA mutation data were downloaded from the UCSC Xena (
We calculated the TMB as follows: (total mutation/total covered bases) × 106 (Robinson et al, 2017). The cBioPortal for cancer genomics (
TMA and IHC
Thirty-four ESCA specimens and 34 esophageal normal tissues were prepared in a TMA format. Informed consent was obtained from all individual participants included in the study. This study was approved by the clinical research institution review committee and ethics review committee of the Zhongnan Hospital of Wuhan University (ethical batch number: 2020110). Relevant clinical information, such as sex, age, TNM stage, and survival time were obtained.
Sixty-eight samples were fixed in 4% paraformaldehyde, trimmed, dehydrated, embedded in paraffin, cut into slices, stained, and sealed by Wuhan Servicebio technology (See the company's official website for the corresponding production experiment report). PANNORAMIC panoramic slice scanner was used for further analysis. After the tissue slice is put on the machine, the slice will gradually move under the lens of the scanner, and scan while moving to form a folder that contains all the tissue information on the tissue slice.
The TMA plug-in is used in halo v3.0.311.314 analysis software to set the diameter of chip organization points and the number of rows and columns, and the software will automatically generate numbers. The indica Labs' multiplex IHC v2.2.0 module is used to quantify the number of positive cells and total cells in the target area of each point of each chip, and to calculate the number of positive cells/total cells = positive rate (%).
Cell culture
The mouse ESCA cell line AKR was obtained from Guangzhou Otwo Biotech Company, cultured in a 37°C incubator with 5% CO2, and maintained in culture medium supplemented with 10% fetal bovine serum (FBS) and 1% penicillin/streptomycin. For IL-6 treatment, AKR cells were starved overnight in medium without FBS before stimulation, then treated with the indicated concentrations recombinant murine IL-6 (BD) or TNF-α (Peprotech) for 24 h.
Cells were immediately harvested for SDS-PAGE and Western blotting to evaluate CAV1 expression at the protein level (1:1000, ab192869; Abcam). AKR that stably transfected with shNC or shCAV1 lentivirus were selected in 5 μg/mL puromycin, and western blot was used for confirming knockdown effect. That CAV1-shRNA lentivirus and negative control lentivirus were purchased from Shanghai Jikai Gene Co., Ltd.
IHC staining
After 14 days of growth, the mice were euthanized; the tumors were excised, weighted, fixed in formalin, and embedded in paraffin; and 4 μm sections were cut for IHC. Anti-CD8 monoclonal primary antibody (1:1000, ab217344; Abcam) and anti-CAV1 monoclonal primary antibody (1:2000, ab192869; Abcam) were obtained from Abcam, and immunohistochemical staining was performed according to established protocols.
Animal
This study was approved by the ethical committee of Zhongnan Hospital of Wuhan University. Eighteen female C57BL/6J mice (5-week-old, 21 ± 0.2 g) were purchased from Wuhan WanQianJiaXing Biotechnology Co., Ltd., Wuhan, China. All mice were maintained in pathogen-free conditions and used for experiments at the age of 6 weeks. Subcutaneous injections of AKR cells stably transfected with shNC or shCAV1 lentivirus, respectively, were performed on the right flanks (0.1 mL PBS containing 5 × 10⁶ cells/mL, n = 9 per group). Then, we measured tumor volumes every 2 days and executed two group mice after the last measurement.
Statistical analysis
Differences among variables were tested using Wilcoxon rank test, paired t-test, and chi-square test, otherwise stated. We used Graphpad prism 9.0, and R software, version 4.1.0, to conduct statistical analyses. We used R package “ggplot2,” “ggpubr,” and “pheatmap” to visualize our results.
Results
Caveolin-1 mRNA expression is decreased in ESCA
Owing to the number of normal tissues in the TCGA database being too small to be statistically convincing, we matched the normal tissues in GTEx with the TCGA cancer tissues to explore the mRNA expression of CAV1 over all cancers (Fig. 1A). Specifically, the CAV1 expression was significantly increased in adrenocortical carcinoma, cholangiocarcinoma, lymphoid neoplasm diffuse large B cell lymphoma, glioblastoma multiforme, head and neck squamous cell carcinoma, kidney chromophobe, kidney renal clear cell carcinoma, kidney renal papillary cell carcinoma, brain lower grade glioma, liver hepatocellular carcinoma, pancreatic adenocarcinoma, and testicular germ cell tumors.
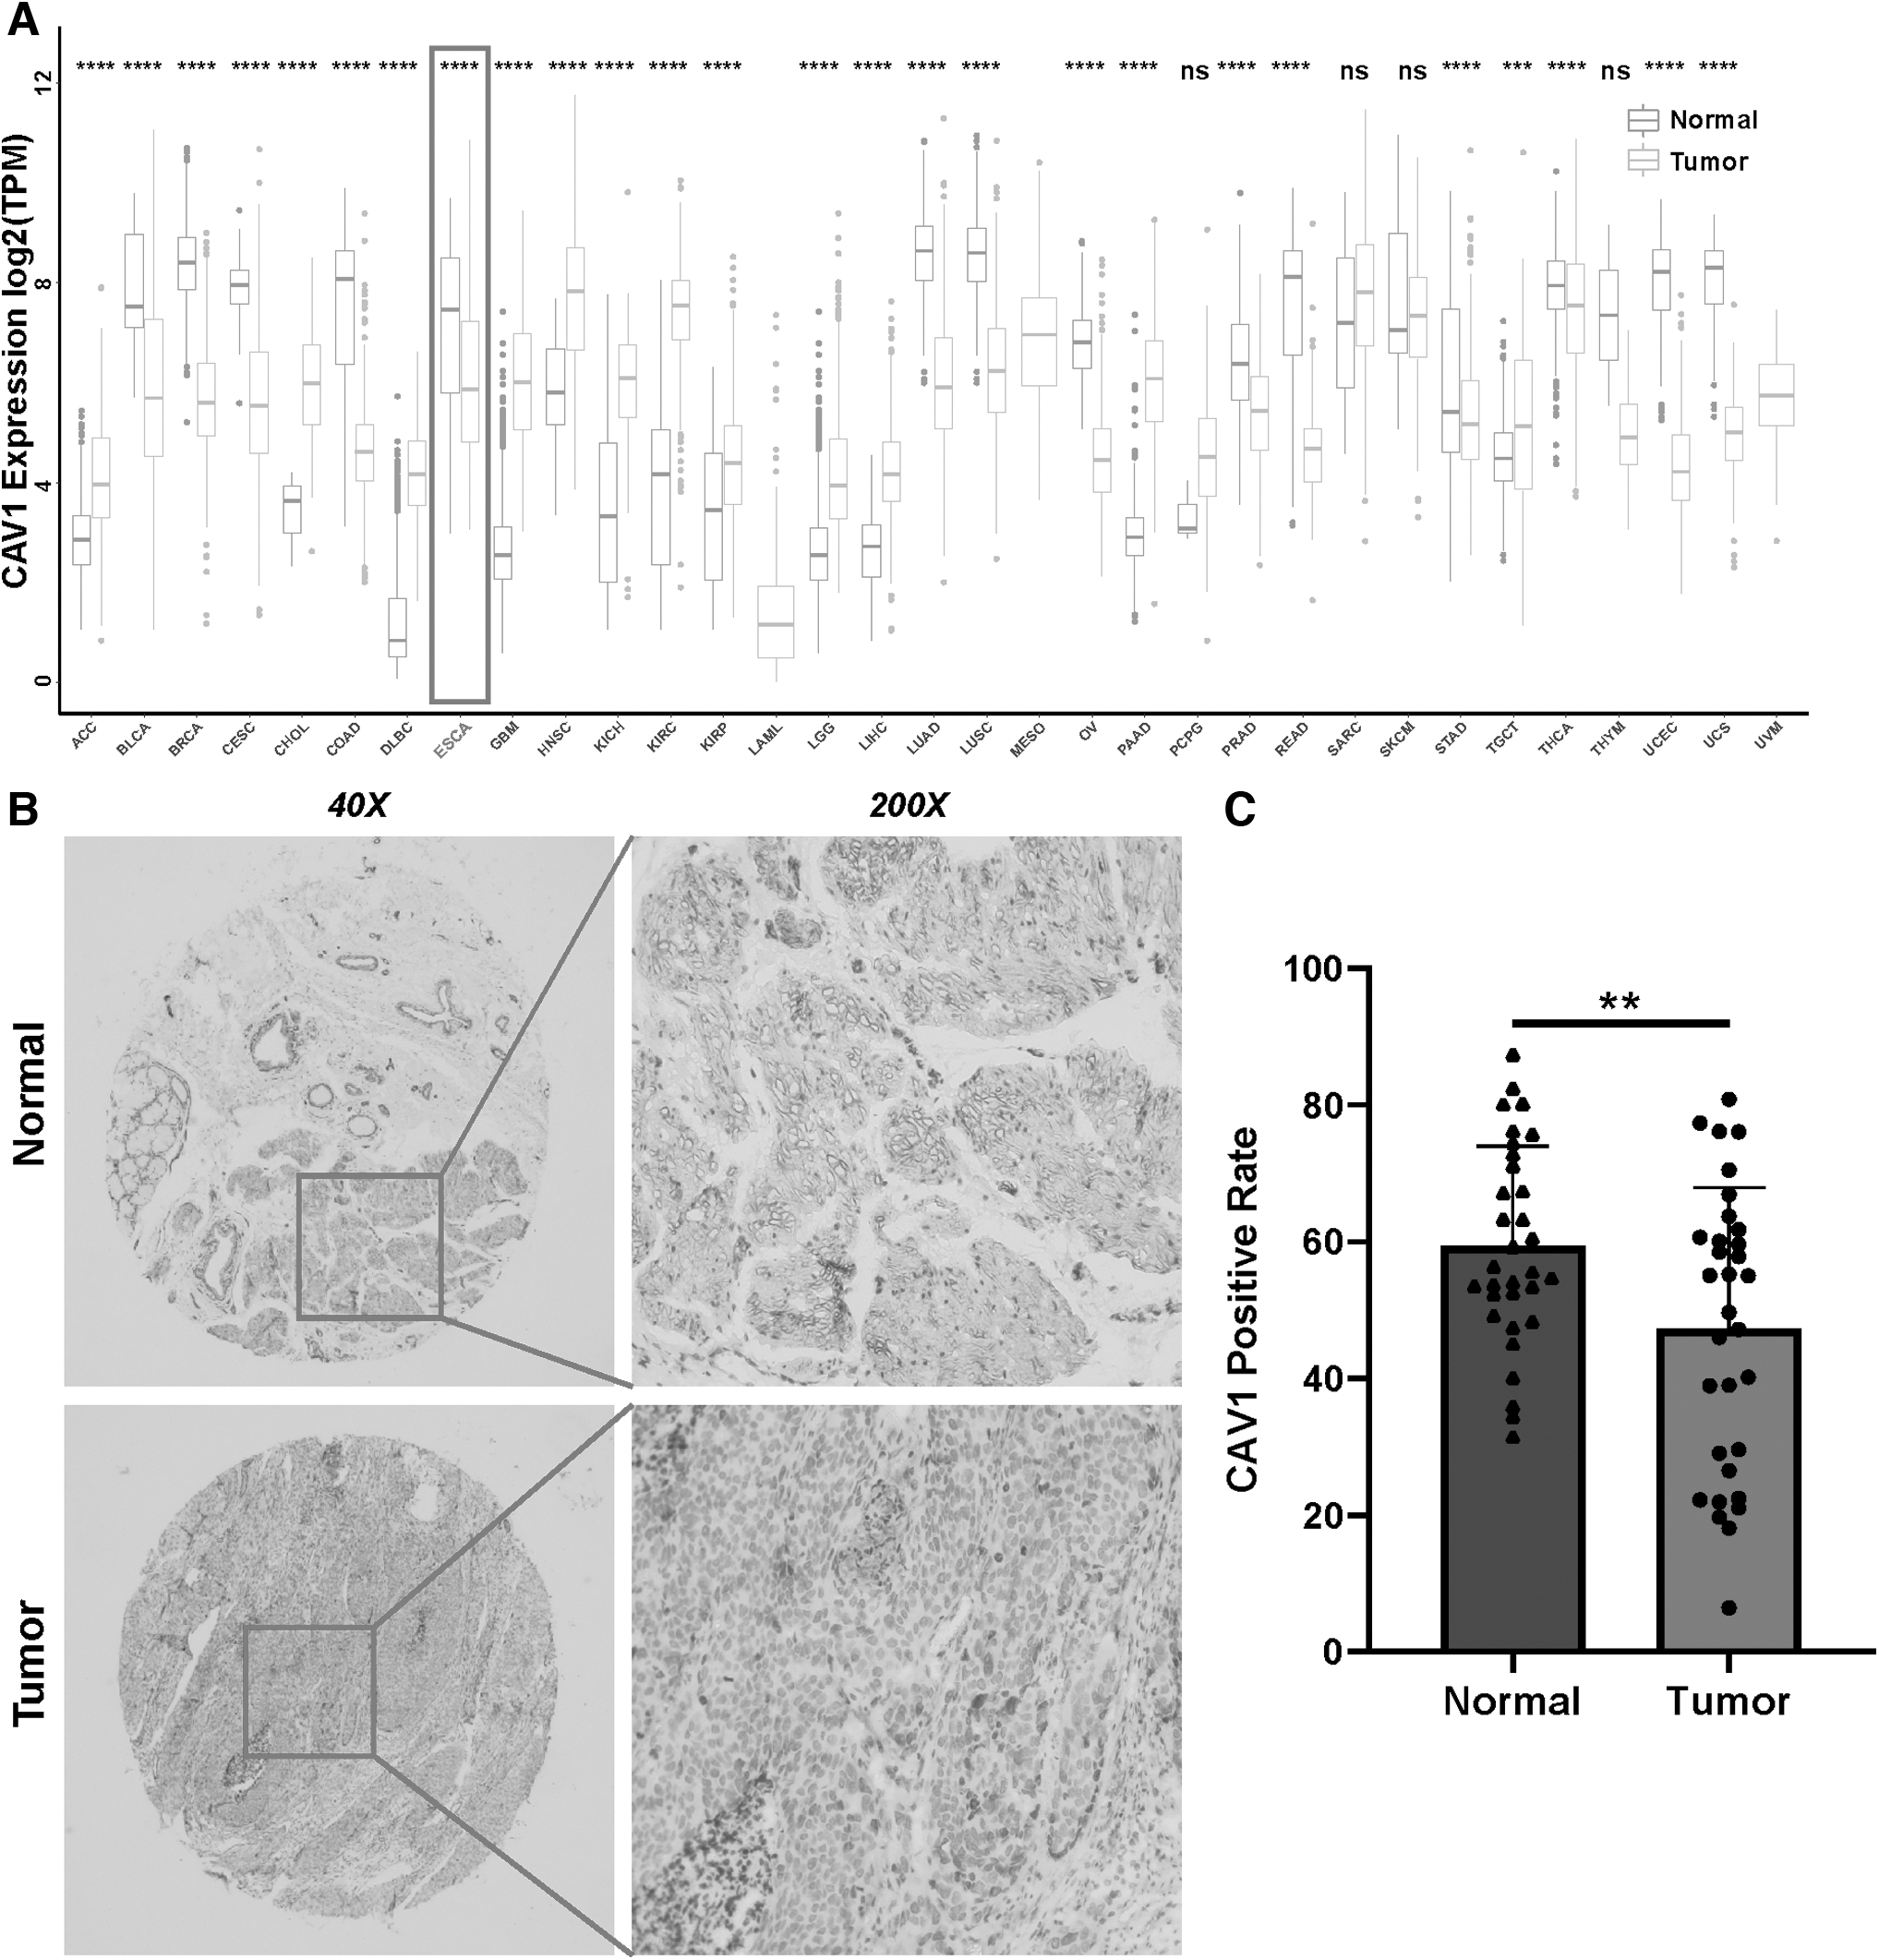
In contrast, CAV1 expression was decreased in bladder urothelial carcinoma, breast invasive carcinoma, cervical squamous cell carcinoma and endocervical adenocarcinoma, colon adenocarcinoma, esophageal carcinoma, lung adenocarcinoma, lung squamous cell carcinoma, ovarian serous cystadenocarcinoma, prostate adenocarcinoma, rectum adenocarcinoma, stomach adenocarcinoma, thyroid carcinoma, uterine corpus endometrial carcinoma, and uveal melanoma compared with normal tissue.
To further verify the expression of CAV1 downregulating in ESCA, we examined protein expression of CAV1 by IHC staining in 68 pairs of ESCA tissues and corresponding adjacent tissues (Fig. 1B). We found that the CAV1 protein level was obviously decreased in esophageal carcinoma tissues compared with normal esophageal tissues (Fig. 1C).
Relationship between CAV1 expression and clinical parameters and prognostic significance in esophageal carcinoma
We explore the relationship between expression of CAV1 and clinical parameters in ESCA. Notably, CAV1 was decreased in high Grade and high N stage and there was a significant increase in esophageal squamous cell neoplasms in ESCA (Fig. 2A–E). Moreover, we divided the ESCA cohort of TCGA into two groups (low-expression group and high-expression group) according to CAV1 gene expression level. Next, we assessed the prognostic value of CAV1 in esophageal carcinoma by R project using “survival” packages (Fig. 2F). It shows that ESCA patients in the low-expression group perform poorly in overall survival. This result indicates that the expression of CAV1 shows a protective effect for ESCA patients. We also compared CAV1 positive rate between 34 tissues with different clinical characters (Supplementary Fig. S1) but it was not significant maybe owing to the small sample size.
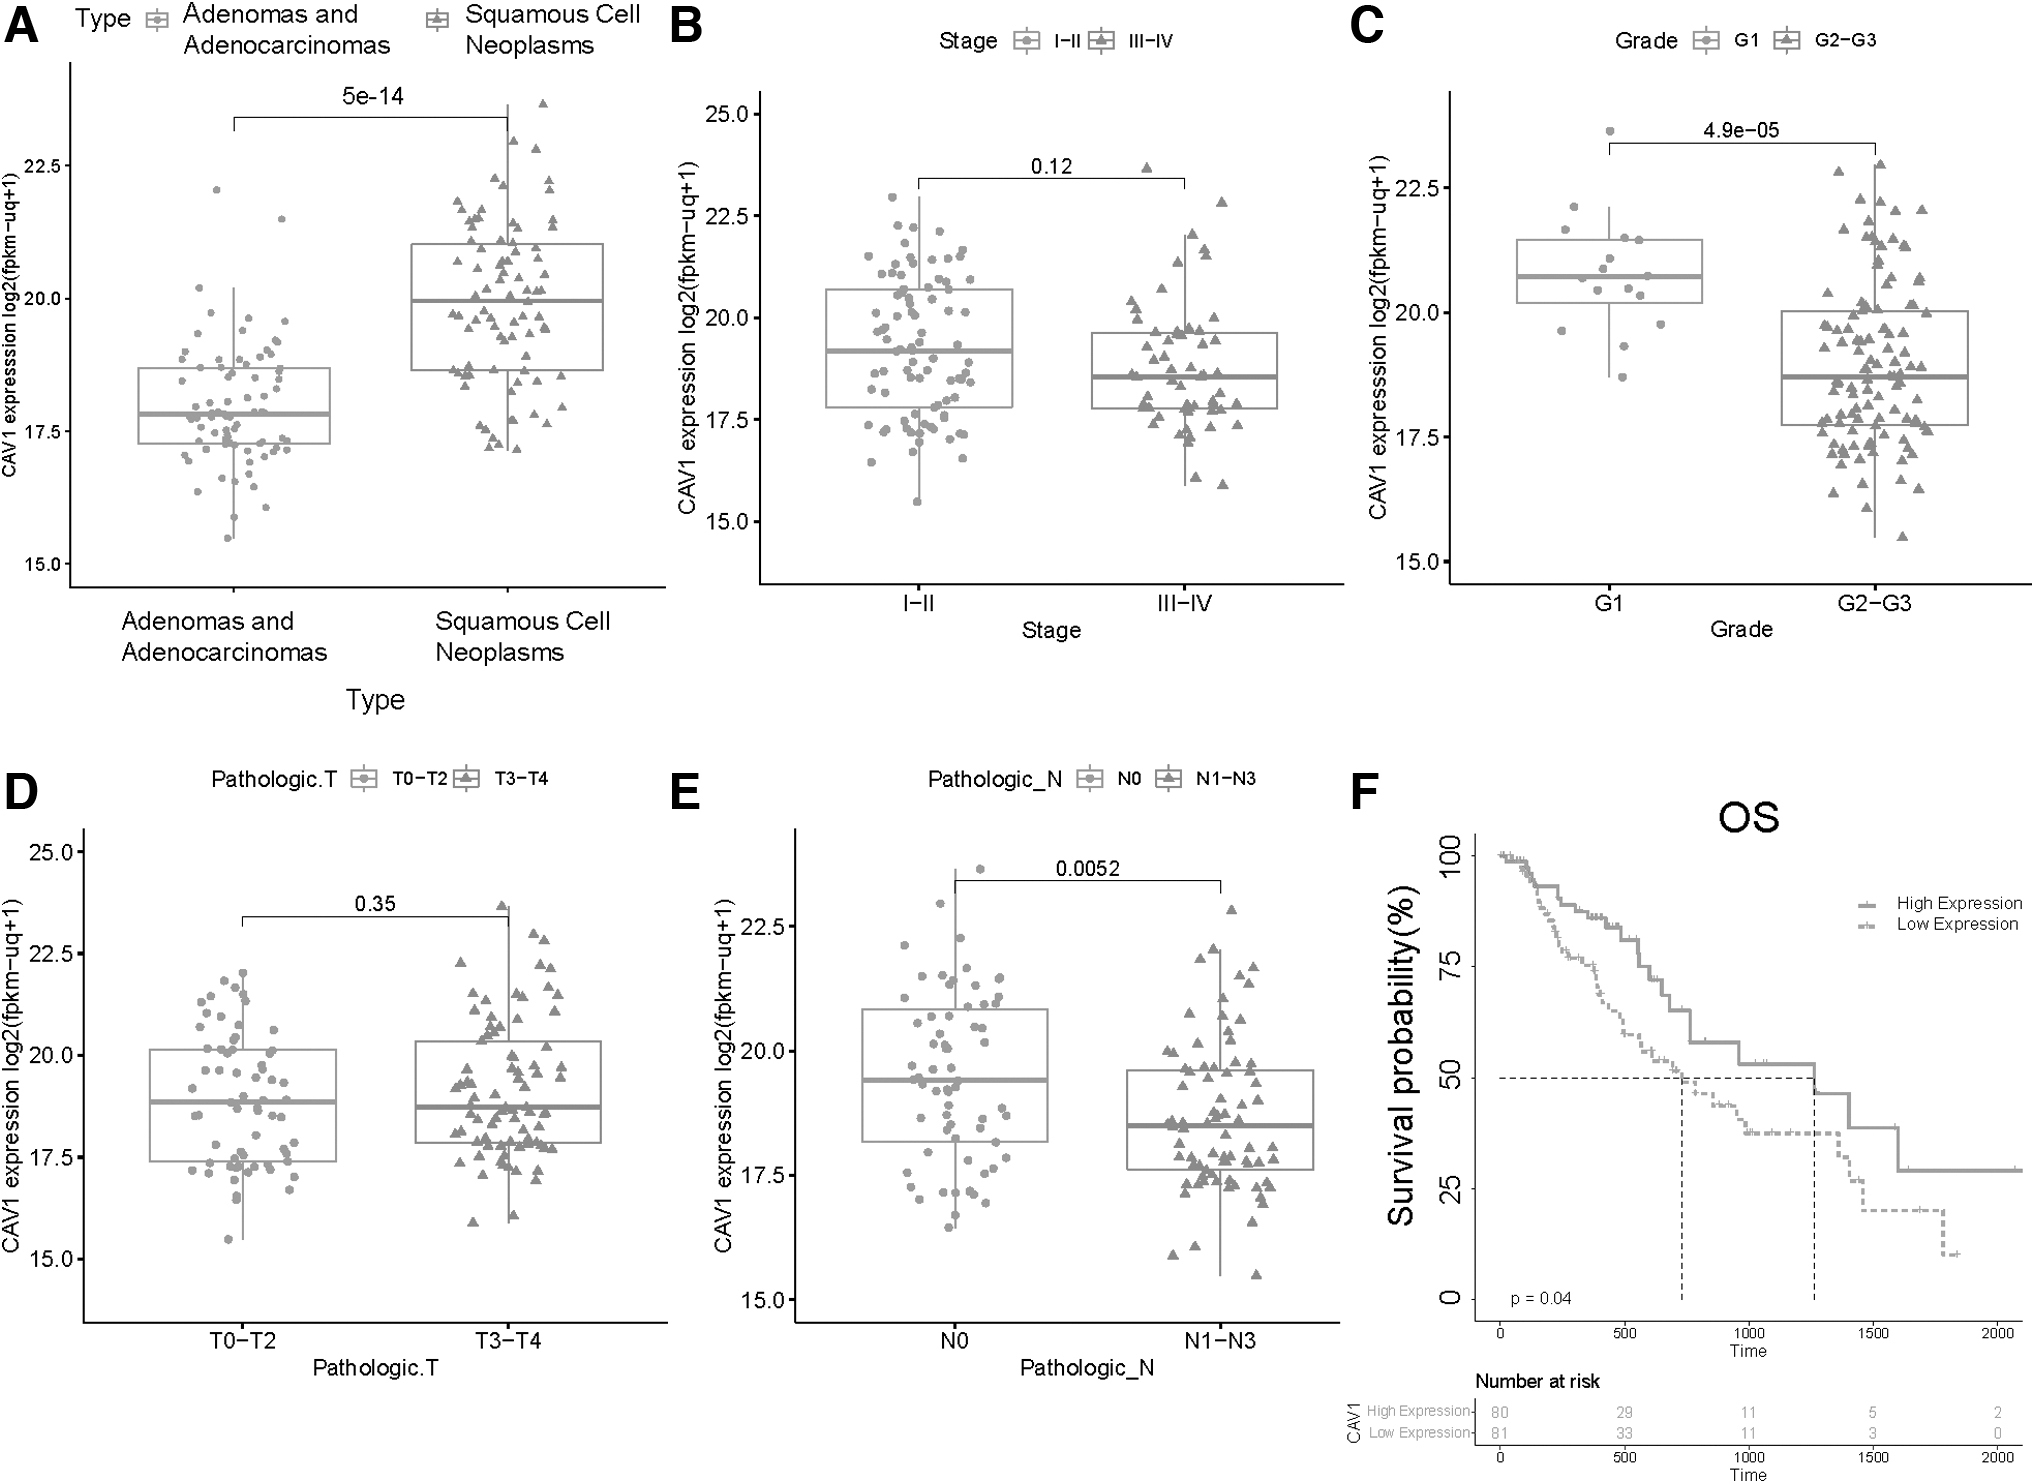
The relationship between expression of CAV1 and clinicopathologic features or prognosis. Relationship between CAV1 mRNA expressions with ESCA patients' individual tumor histologic subtypes
GO and KEGG pathway analysis and GSEA of CAV1 in TCGA ESCA
Based on the adjusted p-value <0.05 and | log2 (fold change) | > 1, we obtained 1275 DEGs between two groups: 657 genes were upregulated and 618 downregulated (Fig. 3A). Then, we took upregulated DEGs and performed KEGG and GO enrichment analyses (Fig. 3B, C). Notably, in GO terms, the upregulated DEGs was most enriched in extracellular matrix organization, extracellular structure organization, epidermis development, epidermal cell differentiation, and skin development.
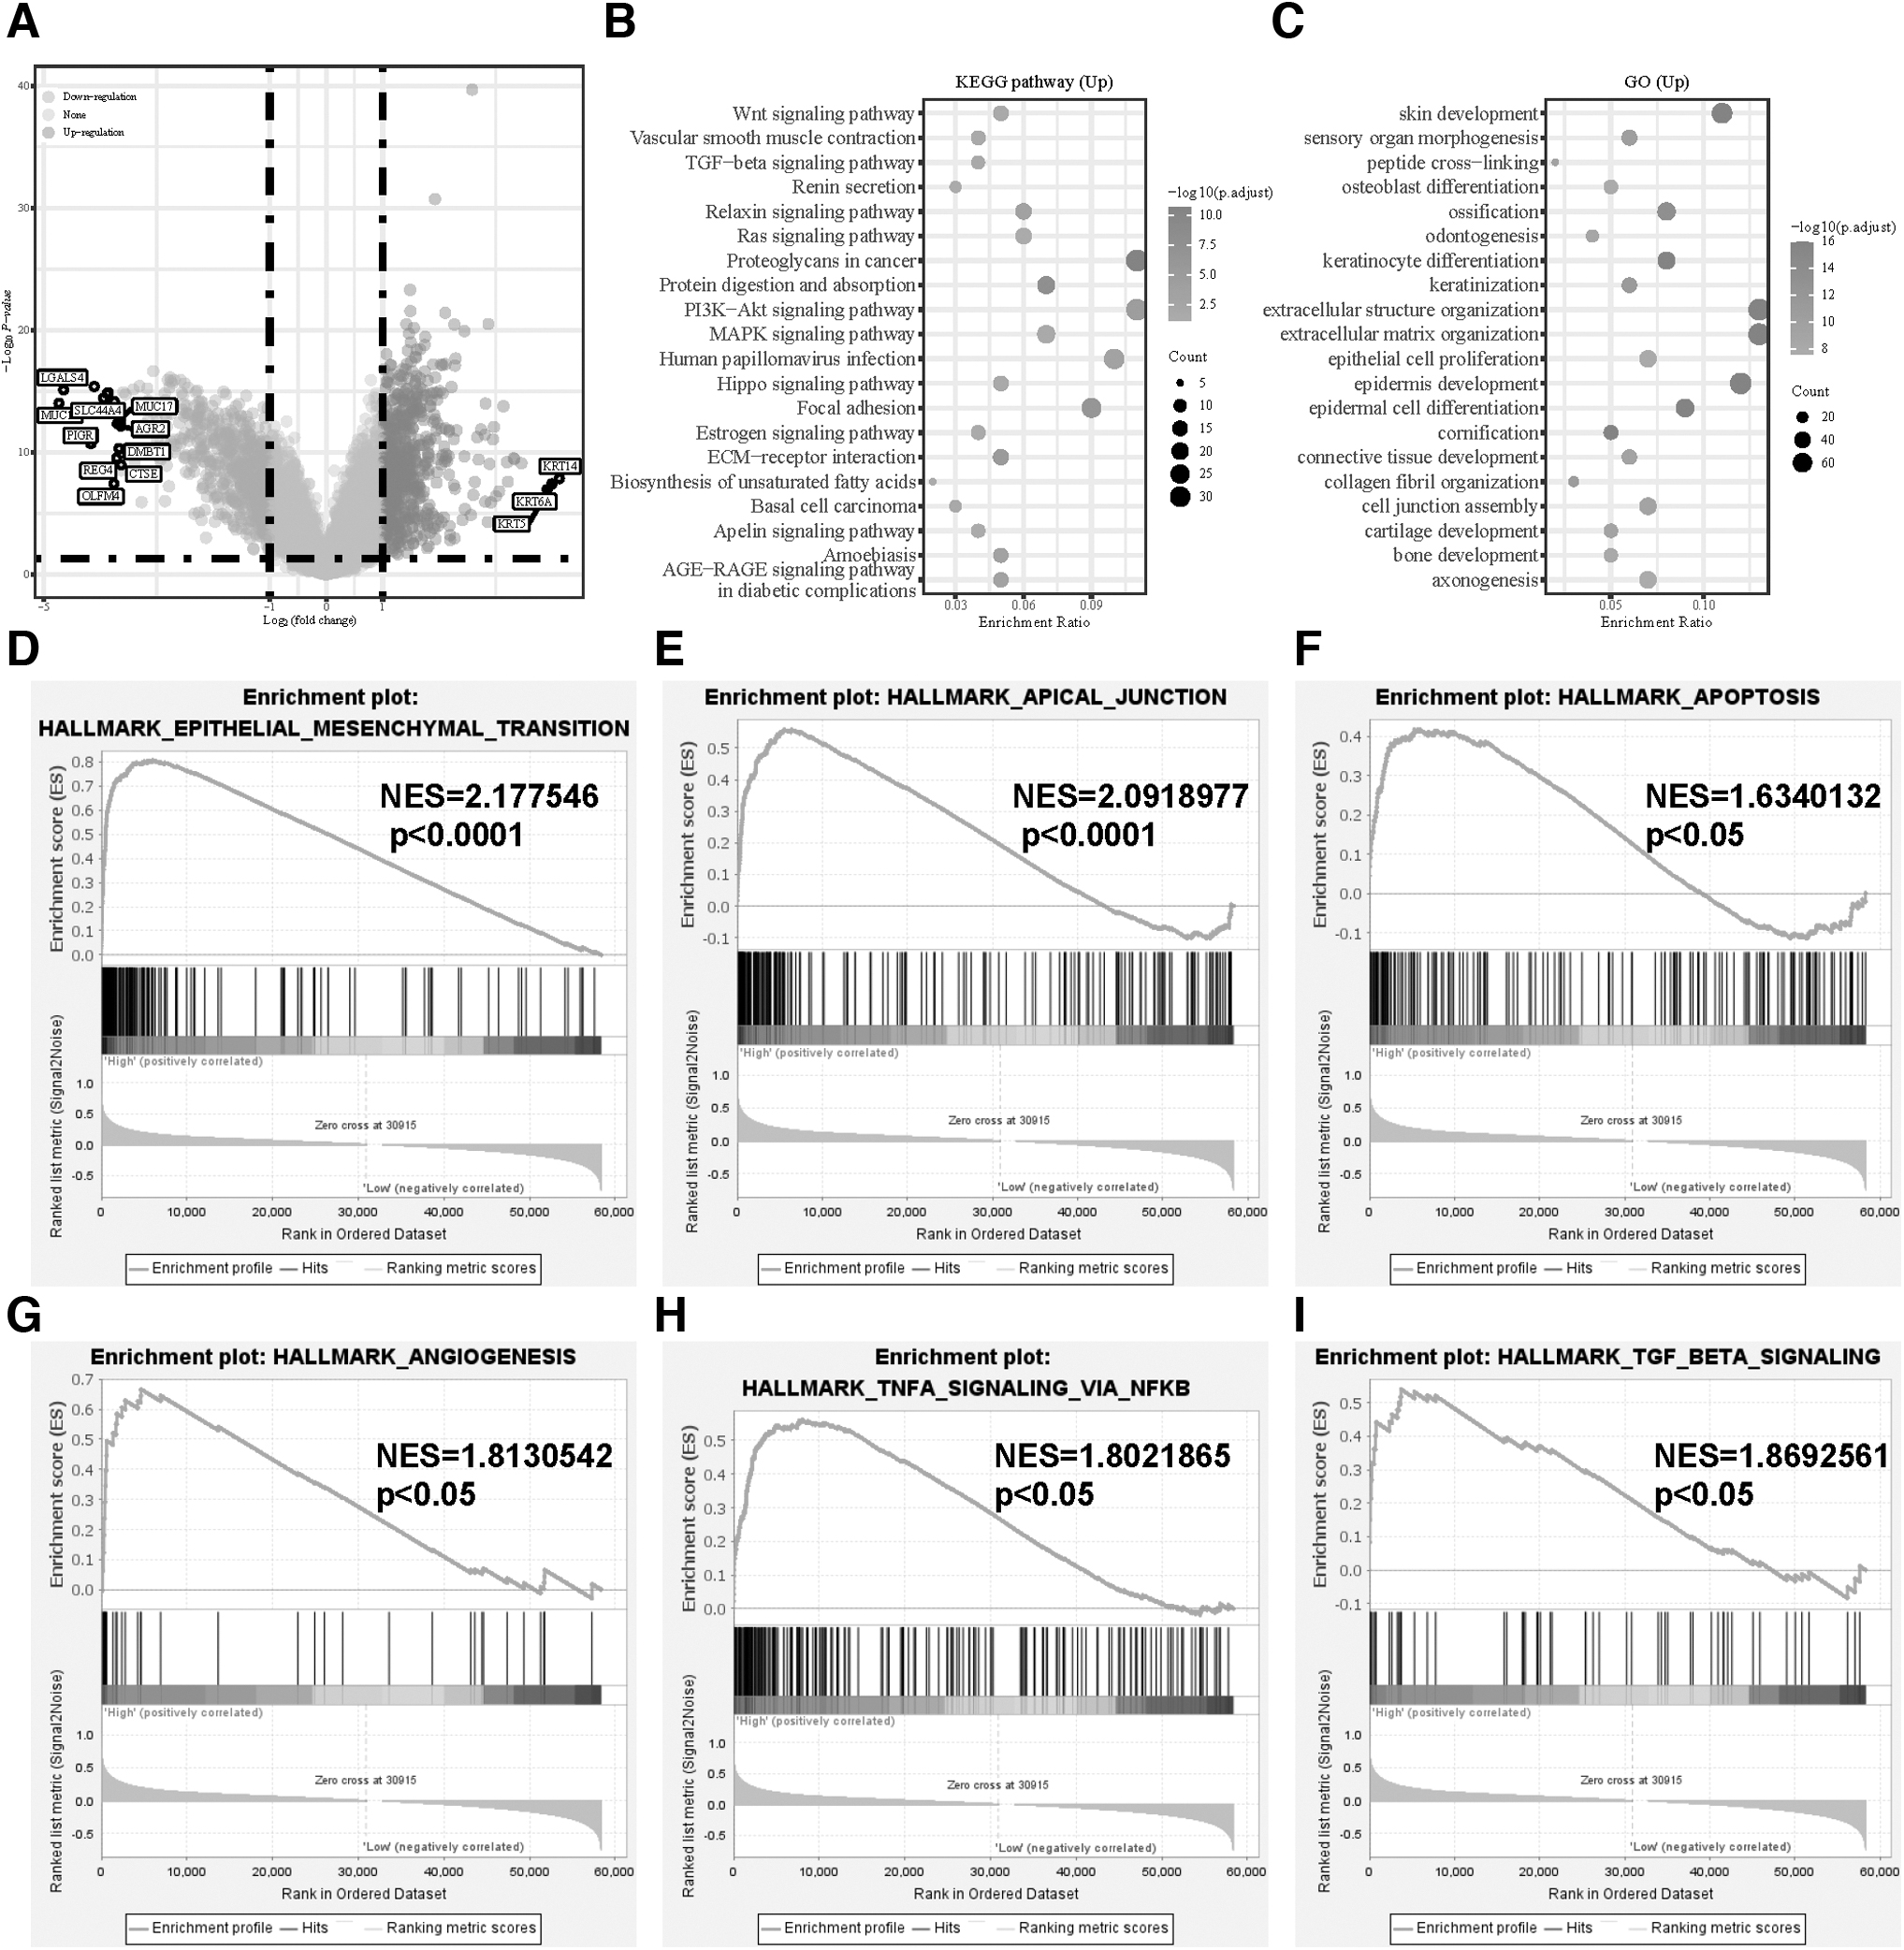
Identification of DEGs between two groups and functional enrichment analysis of DEGs.
In KEGG terms, the most significantly enriched pathways were proteoglycans in cancer, protein digestion and absorption, PI3K-Akt signaling pathway, focal adhesion, and extracellular matrix receptor interaction. Moreover, we performed GSEA, which showed that CAV1 was significantly associated with epithelial mesenchymal transition, apical junction, apoptosis, angiogenesis, TNF-α signaling via NF-κB, and TGF-β signaling (Fig. 3D–I). Therefore, we guessed that CAV1 was involved in tumor proliferation and metastasis and TNF-α plays a variety of biological functions such as apoptosis, inflammation, and immunity, which may indicate that CAV1 influences human anti-tumor immunity.
Expression of CAV1 is associated with TME
In the ESCA, we observed that CAV1 was positively correlated with a large number of immunomodulators, including immunostimulators, major histocompatibility complex molecules, receptor, and chemokine (Fig. 4A), which indicated that high expression CAV1 leads to the upregulation of capacity of antigen presentation and processing and promoting the recruitment of effector TIICs such as CD8+ T cells, TH17 cells, and antigen-presenting cells.

Relationship between CAV1 and TME.
Besides, immune score, stromal score, and pancancer T cell inflamed score of the high-expression group were higher than the low-expression group and the high-expression group had significantly lower tumor purity compared with the low-expression group, suggesting that tumors in the high-expression group contained a higher number of immune cells (Fig. 4B–E). The activities of the cancer immunity cycle could reflect a comprehensive performance of the functions of immunomodulators.
The result shows that the high-expression group was upregulated in activities of the majority of the steps in the cycle, including the release of cancer cell antigens (Step1), cancer antigen presentation (Step2), priming and activation (Step3), and trafficking of immune cells to tumors (Step4; CD8 T cell recruiting, macrophage recruiting, NK cell recruiting, T cell recruiting, Th1 cell recruiting, Th2 cell recruiting) (Fig. 5A). The earlier finding suggested that there is inflamed TME in ESCA with high-expression CAV1.

Relation of expression of CAV1 with infiltrating immune cells.
Next, we used the CIBERSORT algorithm to estimate the difference of 22 types of TIICs between the low-expression group and the high-expression group (Fig. 5B). The result showed the abundance of naive B cells, M0 macrophage, M1 macrophage, resting Mast cells, and activated NK cells and they were significantly more enriched in the high-expression group than in the low-expression group. On the contrary, the naive B cells, plasma cells, resting memory CD4+ T cells, and regulatory T cell (Tregs) were mainly enriched in the low-expression group.
Moreover, we used TIMER database to obtain the Spearman correlation values for CAV1 expression and the infiltration levels of various immune cells using seven algorithms, including CD8+ T cells, NK cells, macrophages, Th1, and dendritic cells (Fig. 5C). The result shows that CAV1 expression levels had a significant positive correlation with the infiltration of NK cells, macrophages, and dendritic cells. Besides, CAV1 was positively correlated with the effector genes of these TIICs, which was evidence to support the earlier viewpoint (Fig. 5D). In addition, we also use these algorithms to calculated immune score, stromal score tumor purity, pancancer T cell inflamed score, and immune cell infiltration fraction in GSE69925. The result shows that CAV1 high-expression group has upregulated anti-cancer immunity, higher stromal score, and lower tumor purity, which verifies the results of TCGA (Supplementary Fig. S2).
Prognostic analysis of CAV1 expression based on immune cells in ESCA patients
Since CAV1 expression is significantly correlated with immune infiltration and good prognosis in ESCA, we investigated whether CAV1 expression affects the prognosis of ESCA because of immune infiltration. We used the Kaplan-Meier plotter performed prognosis analyses based on the expression levels of CAV1 in ESCA in different immune cell subgroups (Fig. 6A–F). It showed that ESCA patients with adenocarcinoma and high expression of CAV1 and decreased infiltration of CD8+ T cells and macrophages had a poor prognosis.
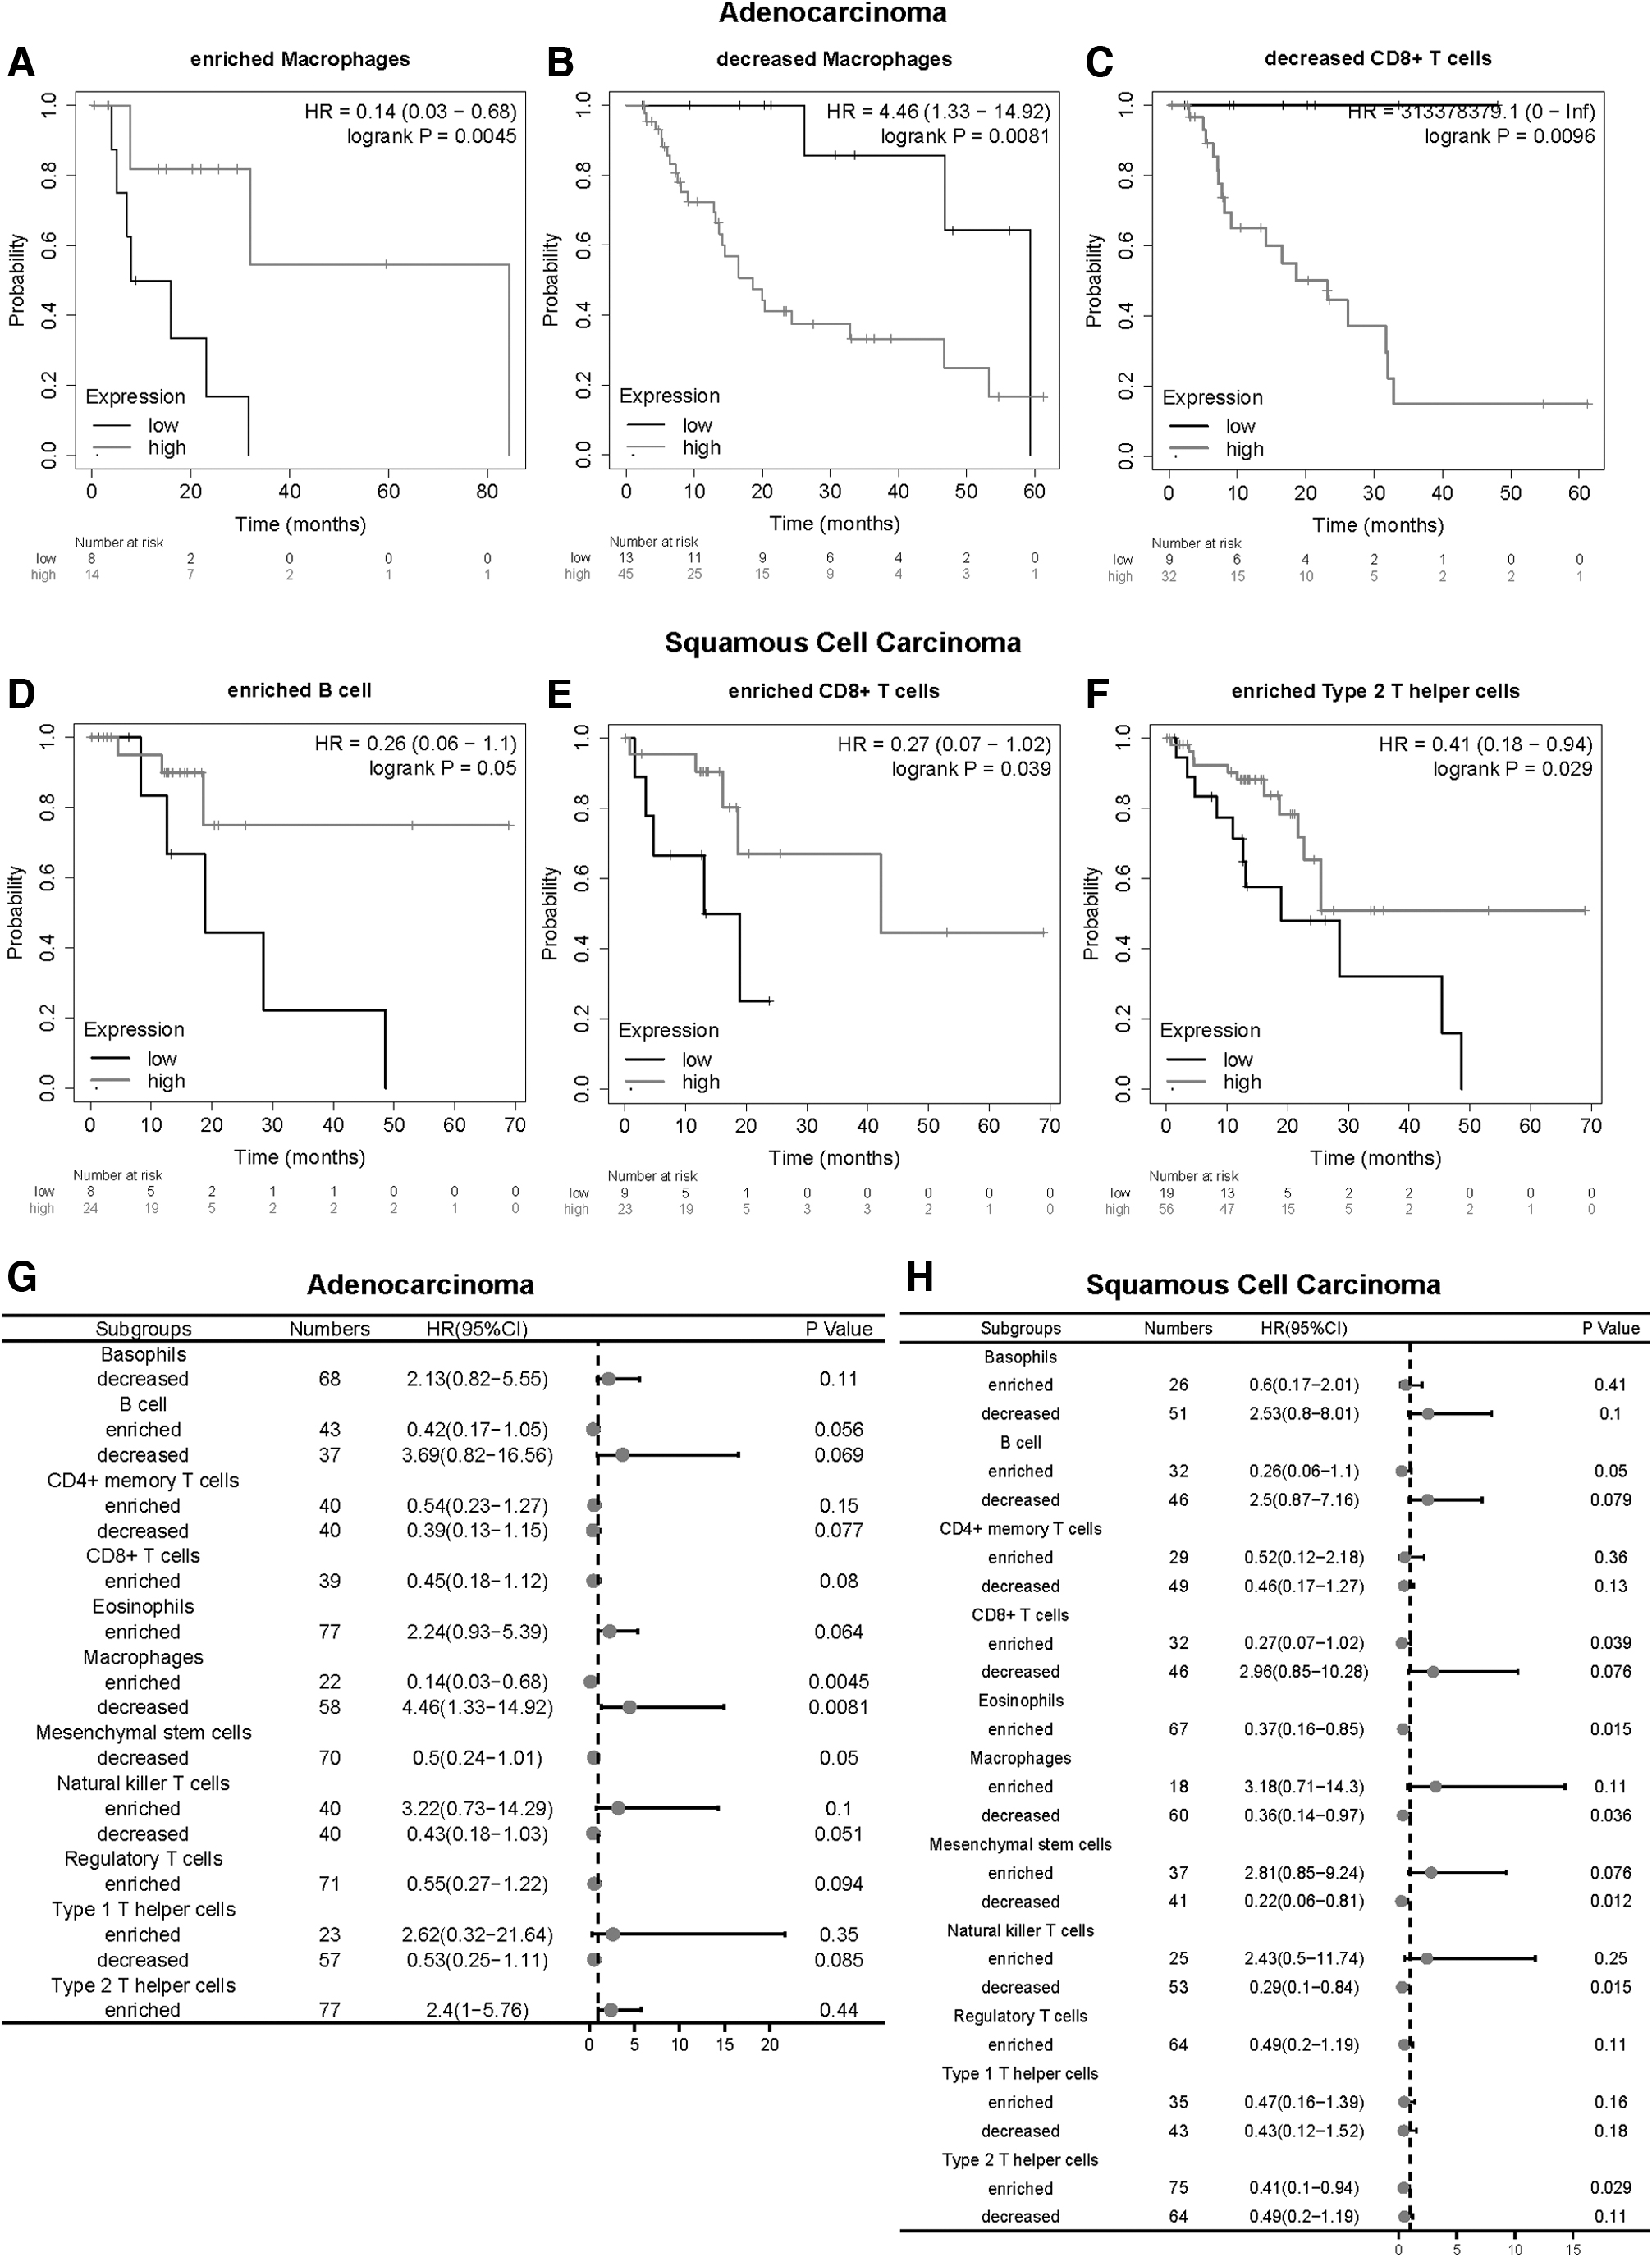
Kaplan-Meier survival curves according to high and low expression of CAV1 in immune cell subgroups in ESCA.
The ESCA patients with squamous cell carcinoma and high expression of CAV1 and enriched infiltration of B cells, CD8+ T cells, eosinophils, and type 2 T helper cells had a good prognosis. In addition, in decreased infiltration of macrophages, mesenchymal stem cells, and natural killer T cells, ESCA patients with squamous cell carcinoma and low expression of CAV1 had a poor prognosis (Fig. 6G, H). These results indicate that CAV1 may affect the prognosis of ESCA patients in part due to immune infiltration.
The relationship between CAV1 expression and mutation profile in ESCA
To determine the relationship between mutation profile and the expression of CAV1, we then employed cBioPortal to inspect the mutation frequency of CAV1 in the TCGA database, and the result showed that ESCA shared a relatively high mutation level over cancer type (Fig. 7A). We further analyzed available somatic mutation data of TCGA ESCA patients. Figure 7B and 7C depicted the top 30 mutated genes in two expression groups.

The mutation analysis and TMB among low-expression and high-expression groups.
TP53, TTN, FLG, MUC16, SYNE1, HMCN1, DNAH5, PCLO, CSMD3, LRP1B, SPTA1, EYS, KMT2D, RYR2, and RYR3 were the common frequently mutated genes in the low-expression and high-expression groups. Especially, mutation frequency of TTN in low-expression group is higher than high-expression group. TMB was significantly higher in low-expression patients (p = 0.016; Fig. 7D).
The association between CAV1 expression and immune checkpoints in ESCA
To investigate the relationship between the expression of CAV1 and immunotherapy, we found that the expression of immune checkpoint molecules in high-expression group was higher than low-expression group, such as PDL1, PDL2, LAG3, TIGIT, and CTLA4 in TCGA ESCA samples (Fig. 8A). Then, we calculated IPS score, and it indicated that CAV1 expression was negatively associated with suppressor cell (SC) score, checkpoints/immunomodulators score, and IPS (Fig. 8B).

Evaluation of the expression of CAV1 in indicating immunotherapeutic benefit in ESCA patients.
Further, we utilized the TIDE algorithm to explore whether the CAV1 expression could reflect the immunotherapeutic benefit in ESCA patients. The detailed output information of TIDE algorithm in TCGA-ESCA dataset is shown in Supplementary Data S1 and S2. The result showed that the CAV1 expression level was significantly negatively correlated with the immunotherapy response (Fig. 8C), and the number of immunotherapy responders was significantly higher in low-expression patients (47/81) than high-expression group (17/81) (chi-square tests, p < 0.0001) (Fig. 8D). The receiver operating characteristic curve depicted an appropriate predictive effect to ICIs response (Fig. 8E). Above all, these results indicated that ICIs might be more productive for the CAV1 low-expression group of ESCA patients.
Low-expression ESCA cell led to a stronger anti-tumor immunity in a mouse model
To further investigate the impact of CAV1 expression in esophageal tumor cell on TME, AKR tumor cells, a mouse esophageal tumor cell line of C57BL/6J origin, were used to construct a subcutaneous xenograft model in C57BL/6J mice (Nakagawa et al, 1997; Opitz et al, 2002). The tumor sizes were measured at 3, 5, 7, 9, 11, 13, 15, and 17 days after injection of AKR cells stably transfected with shNC or shCAV1 lentivirus of AKR cells to mice. Western blot analysis showed the knockdown efficiency of CAV1 (Fig. 9B). The tumor sizes were distinctly larger in the shCAV1 group compared with the NC group (Fig. 9C, D).
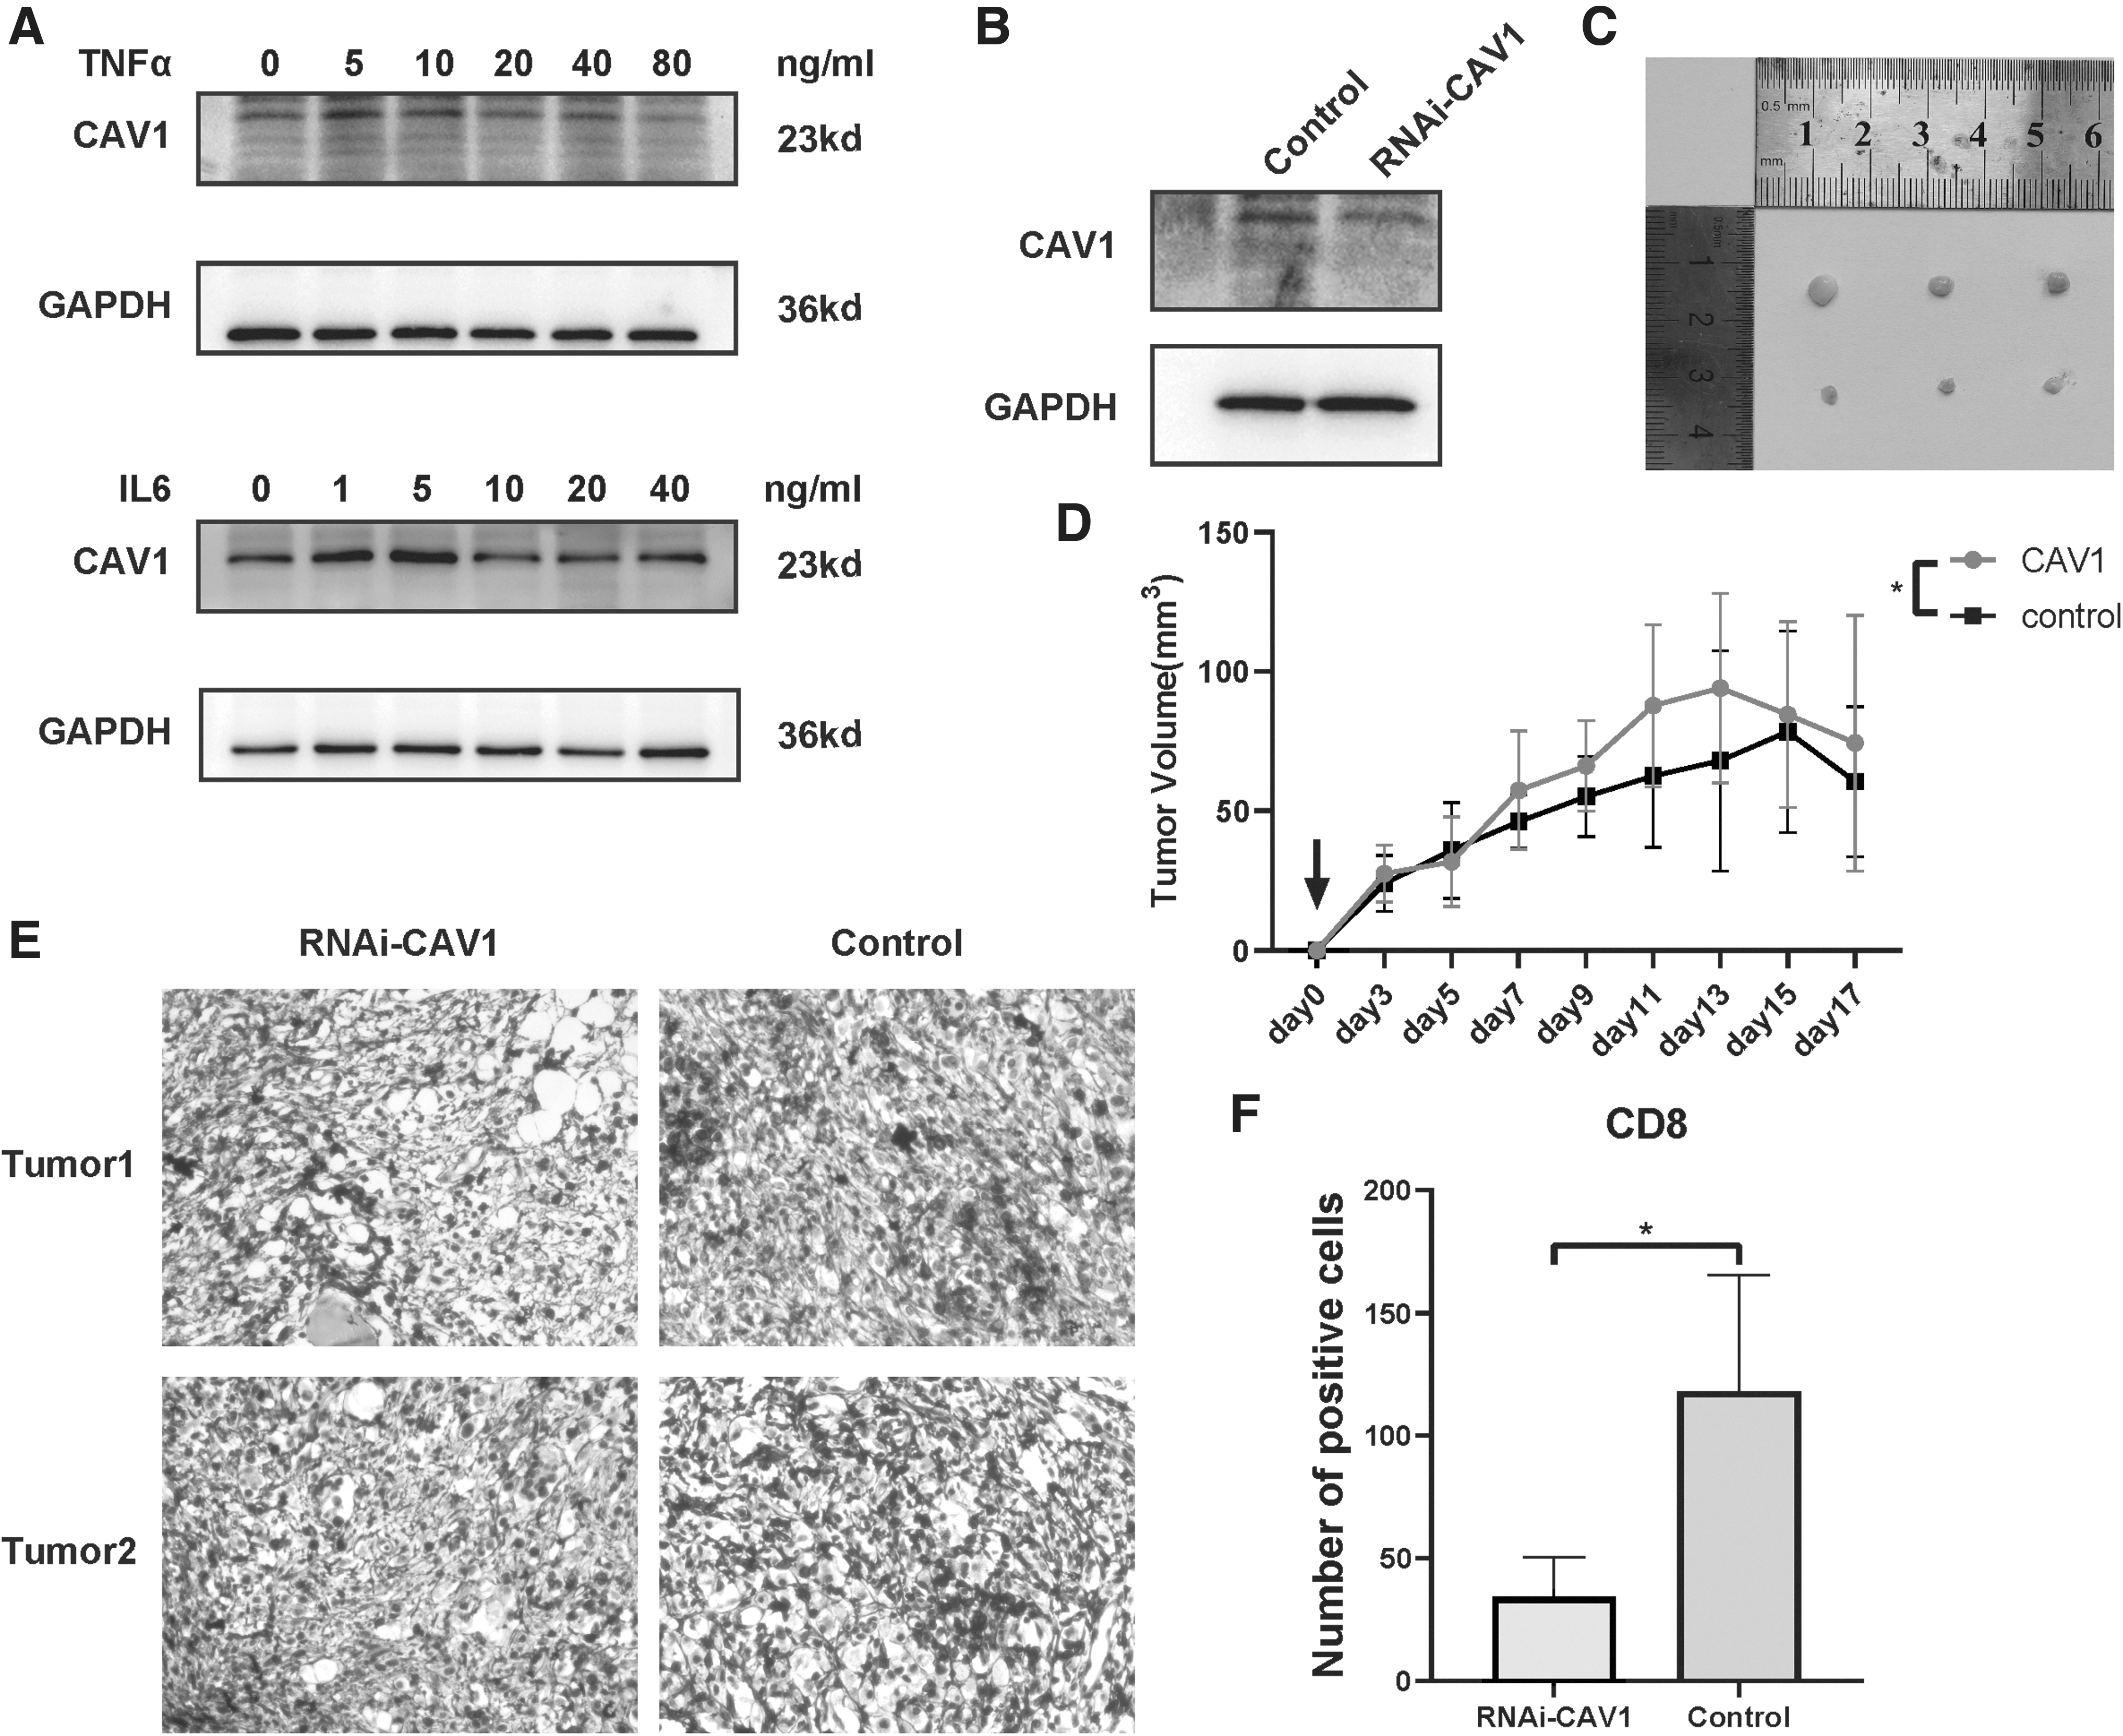
Low-expression ESCA cell led to a stronger anti-tumor immunity in a mouse model.
Moreover, IHC CD8 staining showed more intratumoral CD8 T cell trafficking in the NC group versus the shCAV1 group (p < 0.05; Fig. 9E, F). Immediately afterward, we examined the expression of CAV1 in inflammatory factors-stimulated AKR cells (Fig. 9A) without observing an obvious change in the protein level of CAV1.
Discussion
CAV1 is an important member of caveolae that regulates tumor growth and metastasis through various signaling pathways, but the role of CAV1 in ESCA is not completely clear. In this study, we observed that the upregulated CAV1 promoted inflammation in the TME and poor response to ICIs in ESCA, which may provide a new therapeutic target for clinical treatment.
In our study, we found that the mRNA expression of CAV1 was decreased in ESCA compared with normal tissues and patients had a poor prognosis if their expression of CAV1 is lower. Moreover, the expression of CAV1 is associated with various clinicopathological parameters, including tumor histology, stage, grade, pathological N stage, pathological T stage, and individual cancer stage. Especially, we found that CAV1 expression of stage II is significantly higher than stage I and CAV1 expression of T1 is higher than T2–T4.
This means that high CAV1 expression level may relate to high T stage and high stage. Previous studies have reported that over-expression of CAV1 can stabilize β-catenin that promotes the metastasis of hepatitis B-associated hepatocellular carcinoma and upregulating CAV1 accelerates the invasion and metastasis of ESCC (Huang et al, 2021; Liu et al, 2017). Our results also support this previous research. However, the expression of CAV1 is negatively related to tumor grade and N stage, which indicated that CAV1 inhibits tumor lymphatic metastasis.
Wladimir Gerstenberger's research (Gerstenberger et al, 2018) indicated that CAV1 expression was frequently downregulated in the lymph node metastasis, which means that low expression of CAV1 may promote lymph node metastasis.
The TME also affects the tumor development. It was previously reported that CAV1 is very important for the basement membrane organization and recombination process of B cell receptor and T cell receptor and modulation of apoptosis and differentiation of immune cell (Fiala and Minguet, 2018; Harris et al, 2002). In our study, we found that CAV1 showed positive correlation to multiple immunomodulators, immune score, stromal score, pancancer T cell inflamed score, and cancer immunity cycle steps, which shows that inflamed TME was found in CAV1 high-expression group in ESCA.
Moreover, compared with low-expression group, tumor purity of high-expression group is lower, which indicates a higher number of immune cells in high-expression group. Next, we used CIBERSORT algorithm to estimate the abundance of 22 kinds of immune cells in TCGA ESCA cohort. The result shows that macrophage M0, macrophage M1, activated NK cell, and resting mast cells were more enriched in the high-expression group, and Tregs, naive B cells, and resting memory CD4+ T cells were more enriched in the low-expression group.
A prior study reported that increased infiltration of resting memory CD4+ T cells is associated with good prognosis and the decrease of M0 macrophages indicates a good prognosis in digestive system tumors because of promoting systemic anti-tumor immunity (Nagorsen et al, 2007; Song and Wu, 2020). However, the infiltration of NK cells and M1 macrophage that have an antitumor effect as reported by a previous study (Bernsmeier et al, 2020) in high-expression group is higher than low-expression group.
Besides, Tregs play a central role in the maintenance of immunological self-tolerance and can prevent CD8+ T cells to activate NK cells to kill the tumor cells (Zou, 2006). Tregs can express CD47, limiting anti-tumor immune attack, and that leads to tumor progressive growth (Muth et al, 2022). We guess that less NK cells and M1 macrophage and more Tregs was the possible cause of poor prognosis in low-expression group.
Moreover, we used TIMER database and obtained seven algorithms to calculate immune infiltration for further validation. It shows that NK cells, macrophages, dendritic cells, and their effect gene have a positive correlation with CAV1, which was consistent with the previous conclusions. Higher number of immune cells and more expression of immune effect gene in high-expression group also enhances antitumor immunity, leading to a good prognosis.
More importantly, CAV1 influences the survival time of ESCA patients partially through immune cell infiltration. Especially, in squamous cell carcinoma with enriched CD8 T cells and type2 T helper cells, high-expression group had a better prognosis, which indicated that CAV1 promotes antitumor immunity of immune cells. Next, we used xenograft experiments functionally to validate this in vivo. The mice in high relative expressing CAV1 group had smaller tumors with more CD8 T cells infiltration in TME.
That may reveal a higher immune response and an inflamed TME in esophageal tumors with high relative expressing CAV1, which was consistent with our previous results. Interestingly, inflammatory factors such as IL-6 and TNF-α stimulated ESCA cell line AKR had no significant effect on the protein expression of CAV1. From this, we guess that CAV1 is a key driver gene in regulating powerful TME immune responses via several pathways but further research is required to determine the specific mechanistic function of CAV1 in TME. These findings indicate that CAV1 could be a novel immune-related therapeutic target in ESCA.
In addition, we performed mutation analysis to further investigate the relationship between CAV1 and TMB in ESCA. In recent years, TMB has become a vital potential biomarker in ICIs therapy (Samstein et al, 2019). In normal condition, higher TMB means more neoantigens arising in a tumor. The result shows that ESCA shared a relatively high mutation level over cancer type and TMB is negatively correlated with CAV1 expression in ESCA.
Immune checkpoint molecule, which is expressed in a variety of immune cells, participates in the immune escape of tumor cells (Hui et al, 2017). Therefore, ICIs can activate anti-tumor responses by disrupting the inhibitory signaling to T cells but it is not valid for every individual as previously described. Moreover, to evaluate the relationship between expression of CAV1 and patients' responding to ICIs, we used IPS and TIDE algorithm to calculate IPS and TIDE score of each ESCA patient. Immune checkpoint molecules can be used as predictive markers for the efficacy of ICIs and we found that some immune checkpoint molecules such as CD274, CTLA4, LAG3, and TIGIT were expressed higher in the high-expression group.
However, in the result of TIDE, our study found that CAV1 expression of the immunotherapy response group was lower than the expression of the non-response group, and the response rate of CAV1 high-expression group to immunotherapy was lower than the low-expression group. It has been reported that ICIs can suppress the immunosuppression by Tregs on Th cells (Bauer et al, 2021), and Tregs was more enriched in low-expression group.
The SC score was negatively correlated with CAV1, which indicated that CAV1 low-expression group has more suppressing cells than high-expression group. When using ICIs treatment, deregulation of suppression to antitumor immunity and low expression group benefits more because of higher SC score and more resting memory CD4+ T cells.
Conclusion
In conclusion, our study used bioinformatics analysis and experiments demonstrated that the high expression of CAV1 leads to inflamed TME in ESCA and it may be a new target for ESCA immunotherapy. In addition, expression of CAV1 can predict the clinical response to ICIs, which may provide clinical treatment guidance. Nevertheless, there were also a few limitations to this study. First, the sample size of TCGA ESCA cohort was small. Second, ICIs treatment cohort of ESCA is too rare to validate the value of CAV1 predicting response to ICIs. Finally, further experiments are needed to determine the effect of CAV1 on TME and TIICs.
Data Availability
All the analysis data were accessed from the TCGA database (
Footnotes
Authors' Contributions
Q.Z., L.L., and T.H. designed the study. R.Z. and J.L. contributed to the data search and downloaded. R.Z. and J.X. analyzed the data. H.W., M.L., Y.Z., and H.S. supervised the data and provided statistical advice. R.Z. and H.W. prepared the manuscript. Q.Z., L.L., and T.H. reviewed the manuscript. All authors read and approved the final manuscript.
Disclosure Statement
The authors confirm that there are no conflicts of interest.
Funding Information
This work was supported by China aerospace science and industry corporation limited medical and health research project in 2020 (2020-LCYL-024) and the Program of Excellent Doctoral (Postdoctoral) of Zhongnan Hospital of Wuhan University (grant no. ZNYB2022003).
Supplementary Material
Supplementary Data S1
Supplementary Data S2
Supplementary Figure S1
Supplementary Figure S2
References
Supplementary Material
Please find the following supplemental material available below.
For Open Access articles published under a Creative Commons License, all supplemental material carries the same license as the article it is associated with.
For non-Open Access articles published, all supplemental material carries a non-exclusive license, and permission requests for re-use of supplemental material or any part of supplemental material shall be sent directly to the copyright owner as specified in the copyright notice associated with the article.
