




Abstract
In the mutton industry, feed efficiency traits have the greatest influence on the economic benefits of sheep raised in housing conditions. In this study, quantitative real-time PCR (qRT-PCR), Sanger sequencing, and KASPar methods were used to detect the expression levels of the B cell scaffold protein with ankyrin repeats 1 (BANK1) gene and the relationship between its polymorphism and feed efficiency traits in Hu sheep. The qRT-PCR results showed that the BANK1 gene was extensively expressed in 10 tissues and it was expressed at remarkably higher levels in lymph than in other tissues (p < 0.05). Then, the polymorphism locus, g.93888 A > T, was detected in intron 4 of the BANK1 gene and proved to be remarkably associated with feed efficiency traits (p < 0.05). Hence, the BANK1 gene can be used as a candidate gene for improving the feed efficiency of Hu sheep and this locus could be used as a potential molecular marker for breeding high-feed efficiency sheep in future breeding efforts.
Introduction
With the development of animal husbandry, the mutton industry has also developed rapidly, and improving economic benefits has become one of the most important tasks at present. In the sheep industry, the cost of feed alone accounts for more than half of the cost of breeding (65–70%) (Zhang et al, 2017). In addition, the ruminant farming industry is under pressure to reduce exhaust emissions, improve the environment, and increase production. Thus, improving feed efficiency in livestock has become one of the top research priorities in this industry.
Currently, the feed conversion ratio (FCR) and residual feed intake (RFI) are two of the most commonly used evaluation metrics in the livestock industry (Zhang et al, 2021a). FCR is interpreted to refer to the weight of feed required by livestock per kilogram of weight gain and is widely used because it is easily understood by farmers. However, due to some of the problems inherent in practical application (Gunsett, 1986), the preferred index to evaluate feed efficiency is probably RFI.
RFI is defined as the difference between the actual feed intake (FI) of the animal and the expected FI for growth (Koch et al, 1963). In addition, RFI is generally not associated with body weight (Arthur et al, 2001). Therefore, RFI is used to evaluate the feed efficiency of livestock while taking into account their production performance (Herd et al, 2004).
In addition, compared with conventional breeding technology, marker-assisted selection (MAS) breeding shortens breeding years, accelerates the breeding process, improves breeding efficiency, and overcomes many of the difficulties associated with conventional breeding technology (Dekkers, 2007; Werf, 2006). Therefore, making full use of MAS breeding to screen important candidate genes associated with RFI can help accelerate the breeding process of high-feed efficiency livestock.
The B cell scaffold protein with ankyrin repeats 1 (BANK1) gene was first identified by Yokoyama et al (2002). It was subsequently found to play a role in mobilization of stored calcium ion release and also promotion of Lyn-mediated tyrosine phosphorylation of the inositol 1,4,5-trisphosphate receptor. Studies have also shown that polymorphisms of BANK1 were related to immune diseases (Chang et al, 2009; Yang et al, 2010; Zou, 2011). Thus, individuals carrying the BANK1 risk allele are more likely to develop autoimmune diseases.
Physical health is also an important factor affecting feeding, digestion, and absorption. For example, the immune cell phenotype is closely related to growth in pigs (Galina-Pantoja et al, 2006); there is a regulatory relationship between B lymphocyte production, osteoclast production, and osteoblast production (Horowitz et al, 2005); and the health of digestive organs affects digestion, absorption, and utilization of feed by ruminants, which influence feeding efficiency (Wageha et al, 2017).
Therefore, we speculate that the BANK1 gene is likely to indirectly influence the body's metabolic efficiency through some immune regulation. Moreover, the differences in epigenomic mechanisms could influence the expression profiles of genes and emergence of specific phenotypes (Barazandeh et al, 2019). Multilevel interactions between the genome, epigenome, and environmental factors might occur (Mohammadabadi et al, 2021).
Furthermore, numerous lines of evidence suggest the influence of epigenome variation on health and production (Barazandeh et al, 2019; Masoudzadeh et al, 2020; Mohammadabadi et al, 2017). The expression of eukaryotic genes is temporarily and multidimensionally controlled (Shahsavari et al, 2021). Only a relatively small set of the entire genome is expressed in each type of tissue, and the expression of genes depends on the stage of development (Mm et al, 2021)).
Therefore, gene expression in eukaryotes is specific to each tissue (Mohammadabadi et al, 2021). Also, the amount of gene products that are made in the same tissue as well as in other tissues that make up that product, regulates the expression of that gene (Mohammadabadi, 2020). One of the basic research activities in livestock is the study of genes and proteins related to economic traits and their study at the cellular or chromosomal level (Mohammadabadi, 2021).
However, to our knowledge, almost no research has examined whether the BANK1 gene of Hu sheep is related to feed efficiency. Therefore, in this article, we investigated expression levels of the BANK1 gene in 10 tissues of Hu sheep and found a novel single-nucleotide polymorphism (SNP) of the BANK1 gene by Sanger sequencing and analyzed its relationship with feed efficiency-related traits.
This study aimed to contribute a useful genetic marker for raising the feed efficiency of Hu sheep.
Materials and Methods
Ethics statement
The whole experiment is performed according to the regulations of the Gansu Provincial People's Congress Committee (Gansu, China). The experiment has been reviewed by the Ethics Committee of Gansu Agricultural University (license number: NO.2012-2-159, Gansu, China)).
Animal and phenotypic data and sample collection
In this study, the total number of healthy male Hu lambs selected from five farms was 1105 (Gansu Sanyangjinyuan Husbandry Co. Ltd.; Gansu Zhongsheng Huamei Sheep Industry Development Co. Ltd.; Wuwei Pukang Sheep Industry Co. Ltd.; Shandong Runlin Sheep Industry Co. Ltd.; and Jinchang Zhongtian Sheep Industry Co. Ltd.).
In this experiment, a standardized immunization program was applied to all lambs and they were moved to the experimental site (Minqin, Gansu, China) for uniform rearing after weaning at 56 days of age. Each lamb was individually reared in a single pen (1 × 0.8 m) and had free access to food and water. During the whole experiment, the management conditions and ecological environment were in accordance with our previous research (Deyin et al, 2019).
The whole experiment was divided into three phases, a 14-day acclimatization phase, 10-day pre-experimental phase, and 100-day formal experimental phase. At 80 and 180 days, in the morning, each sheep was weighed and data were recorded as body weight 80 (BW 80) and body weight 180 (BW 180), respectively. We recorded the FI of each sheep during the formal experimental phase and measured the tail width and length on the 180th day.
Individual sheep were weighed at the end of the experiment before preparation for slaughter (live weight before slaughter) and the weight of the carcass and tail fat weight were measured after slaughter. Subsequently, we used these data and calculated average daily weight gain (ADG = (BW 180−BW 80)/100), average daily FI (ADFI = FI/100), and mid-test metabolic body weight (MBW = [0.5 × (BW80 + BW180)]0.75).
We referred to the method by Zhang et al (2017) to calculate RFI, and the model is as follows:
where Y i represents the ADFI of the i th individual; α 0 represents the intercept of the regression; α 1 and α 2 represent the regression coefficients of MBW and ADG, respectively; and e i represents the RFI value of the i th individual.
DNA extraction and SNP identification and genotyping
After all the data were collected, the blood sample from each lamb was drawn through the jugular vein by a qualified veterinarian, using a qualified blood collection needle and a 5-mL heparin sodium anticoagulation tube, and stored at −20°C for DNA extraction. DNA was extracted using standard kits (TransGen Biotech, Beijing, China) according to manufacturer's instructions and then stored at −20°C.
The specific PCR primers were designed with reference to the DNA sequence of the BANK1 gene (GenBank Accession ARS-UI Ramb, v2.0, No. NC_056059.1) and using Primer 5 and Oligo 7.0 software (listed in Table 1). Referring to the method of SNP identification by Zhao et al (2021), identification of the SNP of the BANK1 gene was performed by sequencing PCR amplification products from mixed samples of DNA from 10 sheep.
Design of Ovine BANK1 Gene Primers
BANK1, B cell scaffold protein with ankyrin repeats 1; SNP, single-nucleotide polymorphism.
In this study, 1105 Hu sheep were successfully genotyped using KASPar analysis (primers listed in Table 2).
Primer Pairs Designed for KASPar Assay
Expression levels of the ovine BANK1 gene in tissues
After slaughter, we collected samples of 10 tissues (including heart, liver, spleen, lung, kidney, duodenum, lymph, rumen, muscle, and tail fat) from six individual sheep in the experimental population (randomly selected) and stored them at −80°C for RNA extraction. The TransZol kit (TransGen Biotech, Beijing, China) was used to extract RNA from these tissues, following the manufacturer instructions with the kit, and then the obtained RNA was reverse transcribed to cDNA with the SuperMix Plus kit (YEASEN, Shanghai, China).
The quantitative real-time PCR (qRT-PCR) primers were designed based on the mRNA sequence of the ovine BANK1 gene (GenBank No. XM 027970855) (Table 1). Ten tissue samples from six individual sheep were subjected to qRT-PCR using the SYBR Green kit (YEASEN, Shanghai, China) and according to the accompanying instructions. The instrumentation and methods used to perform qRT-PCR were referenced from the previous study (Deyin et al, 2019).
β-Actin was used as an internal control gene and its primer pair was chosen from those presented in a previous study (Deyin et al, 2019); the primer pairs are shown in Table 1. The relative expression levels of the BANK1 gene were calculated using the 2−ΔΔCt method (Livak and Schmittgen, 2013). Significant differences in results between groups were tested using Duncan's test, and p < 0.05 indicates statistical significance.
Statistical analysis
The genetic parameters, including allele frequency, number of alleles (Ne), expected degree of heterozygote (He), expected degree of purity (Ho), and the polymorphic information content (PIC), of the BANK1 gene were estimated, and the calculations were performed using previously reported methods (Zhao et al, 2013). The p value of Hardy–Weinberg equilibrium (PHWE), heat map, and correlation coefficients between traits were calculated and drawn using the R language (version 4.1.1, SNPassoc and Corrplot packages, respectively).
Descriptive statistical analysis was performed on all traits, and the linear model function using SPSS 26.0 software was used to investigate the relationship between genotypes and traits. The model is as follows:
where Y ijk represents the phenotypic value; μ represents the mean; G i, Fj (j = 1, 2, 3, 4, 5), and Sk (k = 1, 2) represent the influence of genotype, farm, and season, respectively; and ɛijk represents residuals corresponding to phenotypic values.
Significant differences between phenotypic means of different genotypes were evaluated using Duncan's test, and p < 0.05 indicates statistical significance. Phenotypic values are expressed using mean ± SD. Bar graphs were drawn using Prism (v5.0) software.
Results
Statistics and analysis
Results of the descriptive statistics are shown in Table 3. The coefficients of variation (CVs) for all traits were >10%, among which the CV for tail fat weight was 30.09%, showing that the weight of tail fat has large phenotypic variation and potential for selection.
Descriptive Statistics of Growth Traits
The relative weight of tail fat (body weight) = the weight of tail fat/live weight before slaughter × 100%; the relative weight of tail fat (carcass weight) = the weight of tail fat/carcass weight × 100%.
ADFI, average daily feed intake; ADG, average daily weight gain; CV, coefficient of variation; RFI, residual feed intake; SD, standard deviation.
Results of the correlation analysis are shown in Figure 1. The results showed that there was no relationship between body weight and RFI at each stage, with almost no correlation with carcass weight and live weight before slaughter and a low correlation between tail lend tail width, and the correlation coefficients of RFI with other traits ranged from 0.13 to 0.39.
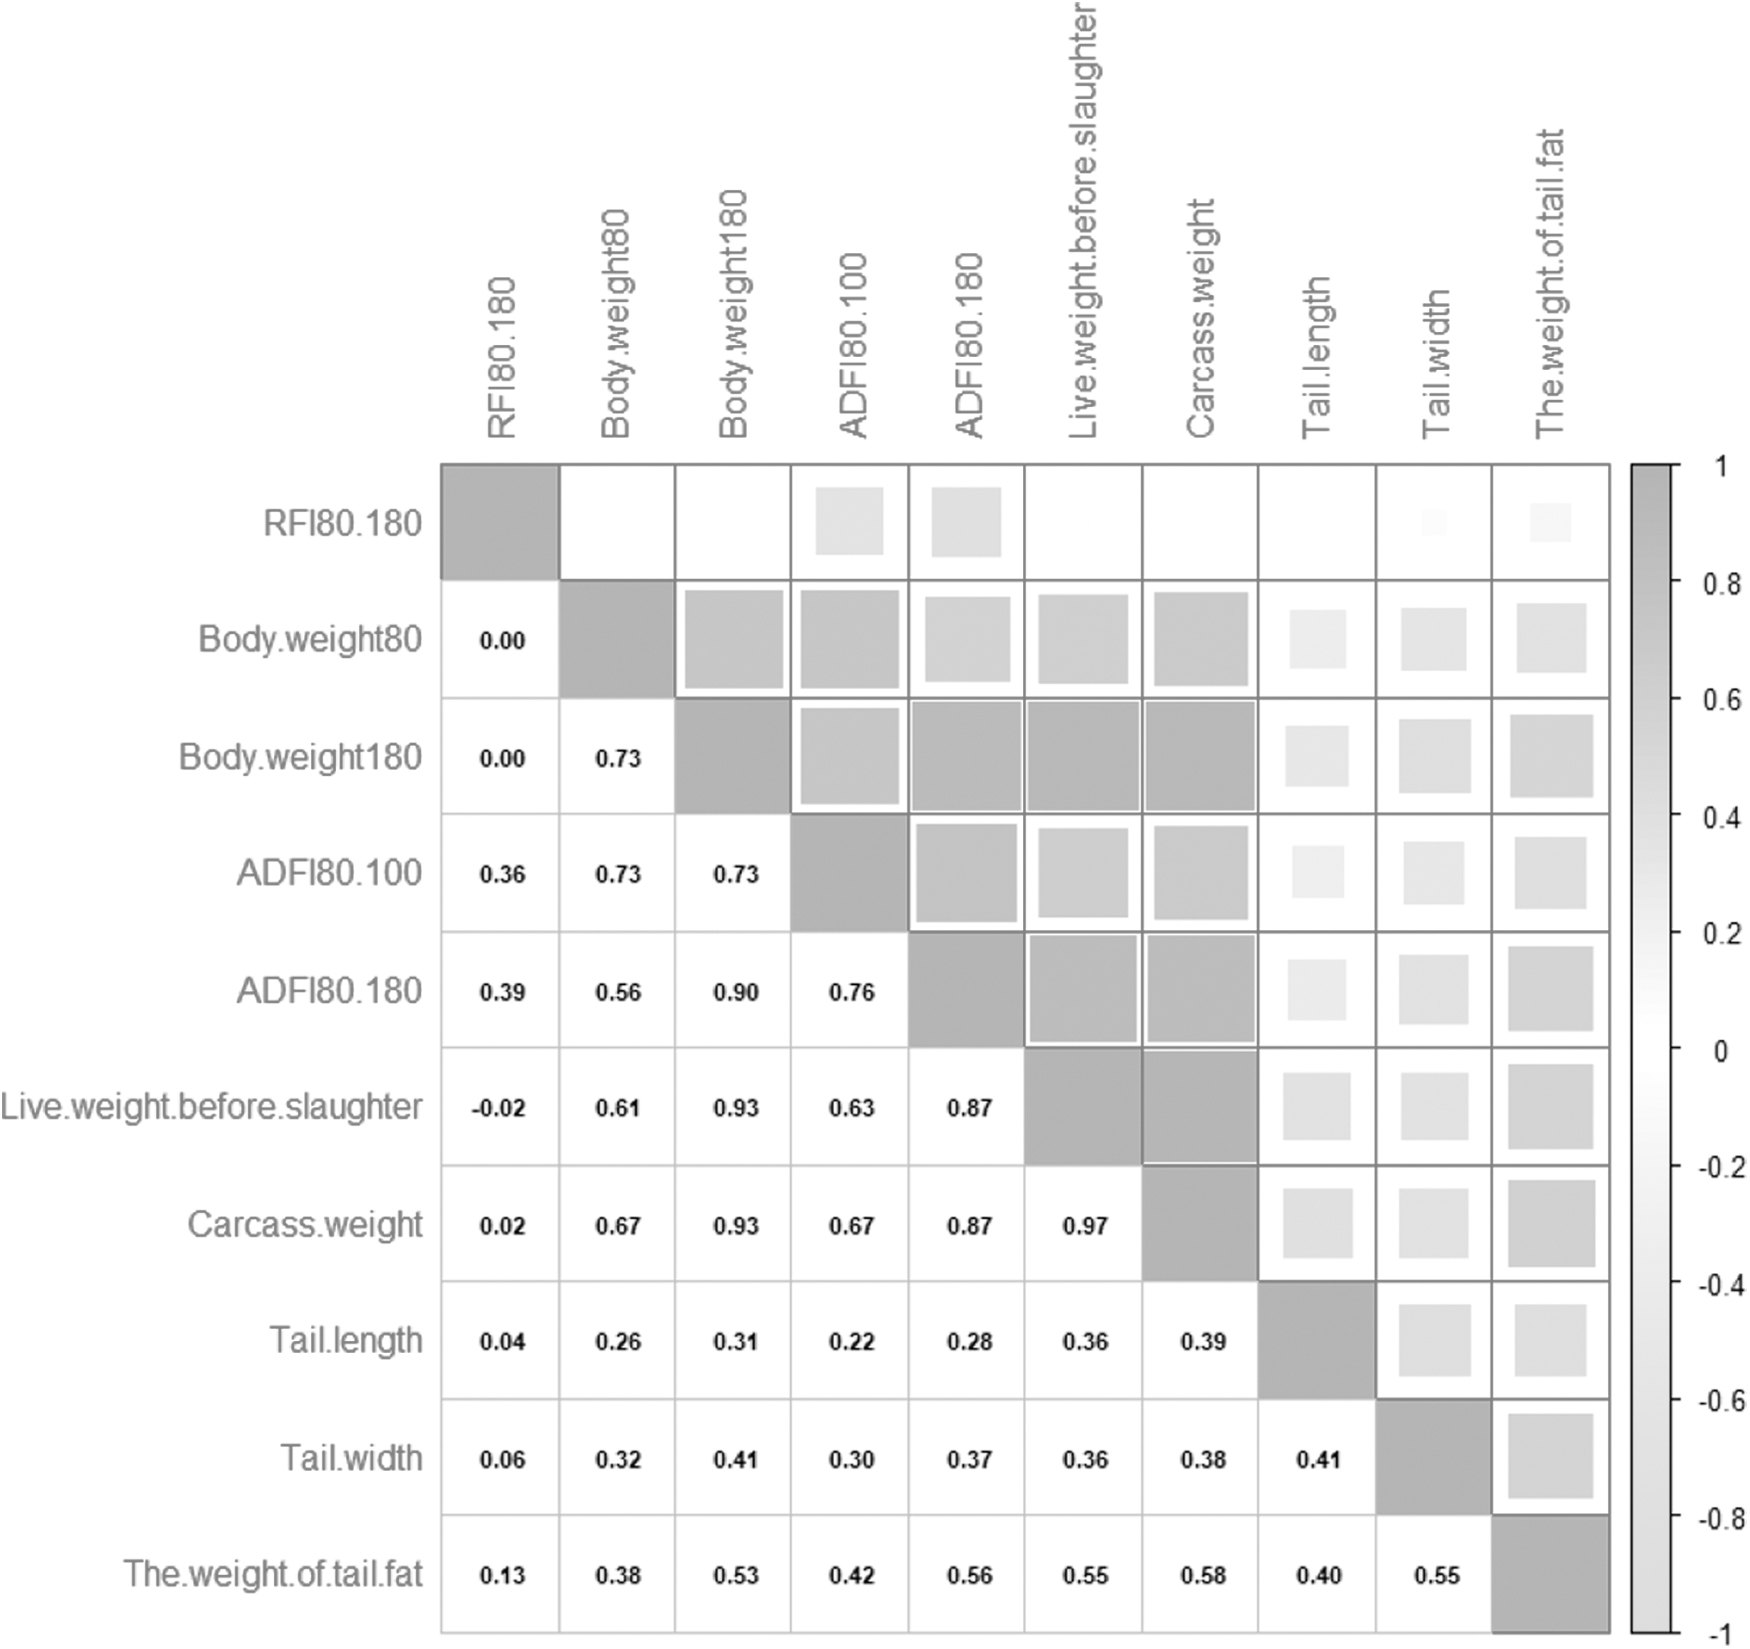
Correlation analysis between growth traits. The darker color of the upper right triangle indicates the stronger correlation, and the lower left triangle indicates the correlation coefficient.
Expression level analysis
The expression levels of the ovine BANK1 gene in 10 tissues were examined by qRT-PCR (Fig. 2). Results showed that the BANK1 gene was widely expressed in all tissues of the Hu sheep and it was expressed in lymph at remarkably higher levels than in other tissues (p < 0.05).

mRNA expression levels of the BANK1 gene in various tissues of Hu sheep. Note: A and B are significance markers indicating highly significant differences between groups (p < 0.01). BANK1, B cell scaffold protein with ankyrin repeats 1.
SNP scanning of the BANK1 gene
The prospective PCR products were obtained by amplification from mixed samples of DNA from 10 individuals (Fig. 3). A new polymorphic locus, g.93888 A > T, was identified in the fourth intron of the ovine BANK1 gene by detection of PCR products (Fig. 4).
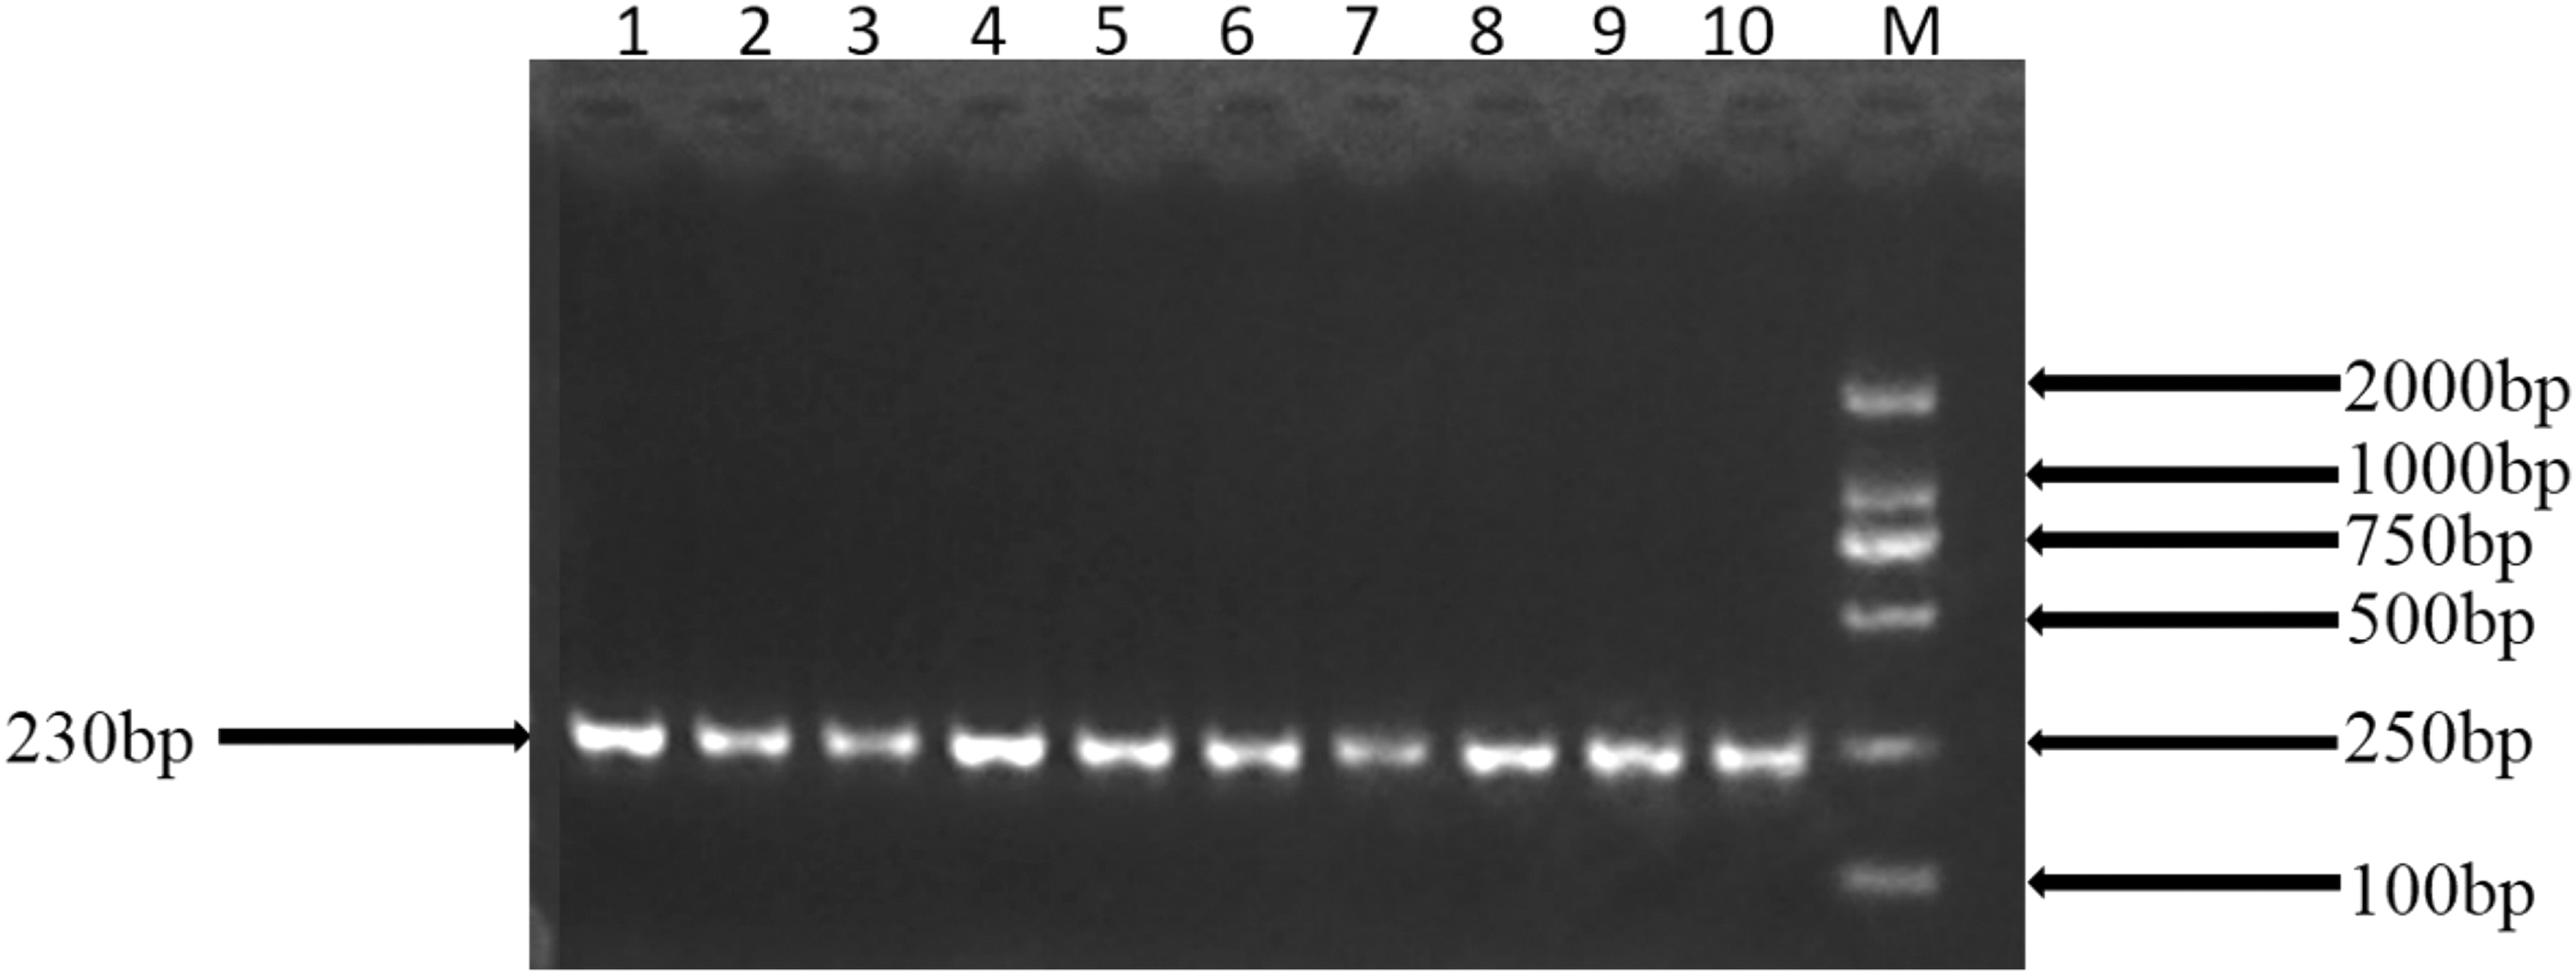
PCR amplification of the BANK1 gene for SNP identification. Note: M: DNA markers (DL2000); lane 1–10: PCR products. SNP, single-nucleotide polymorphism.
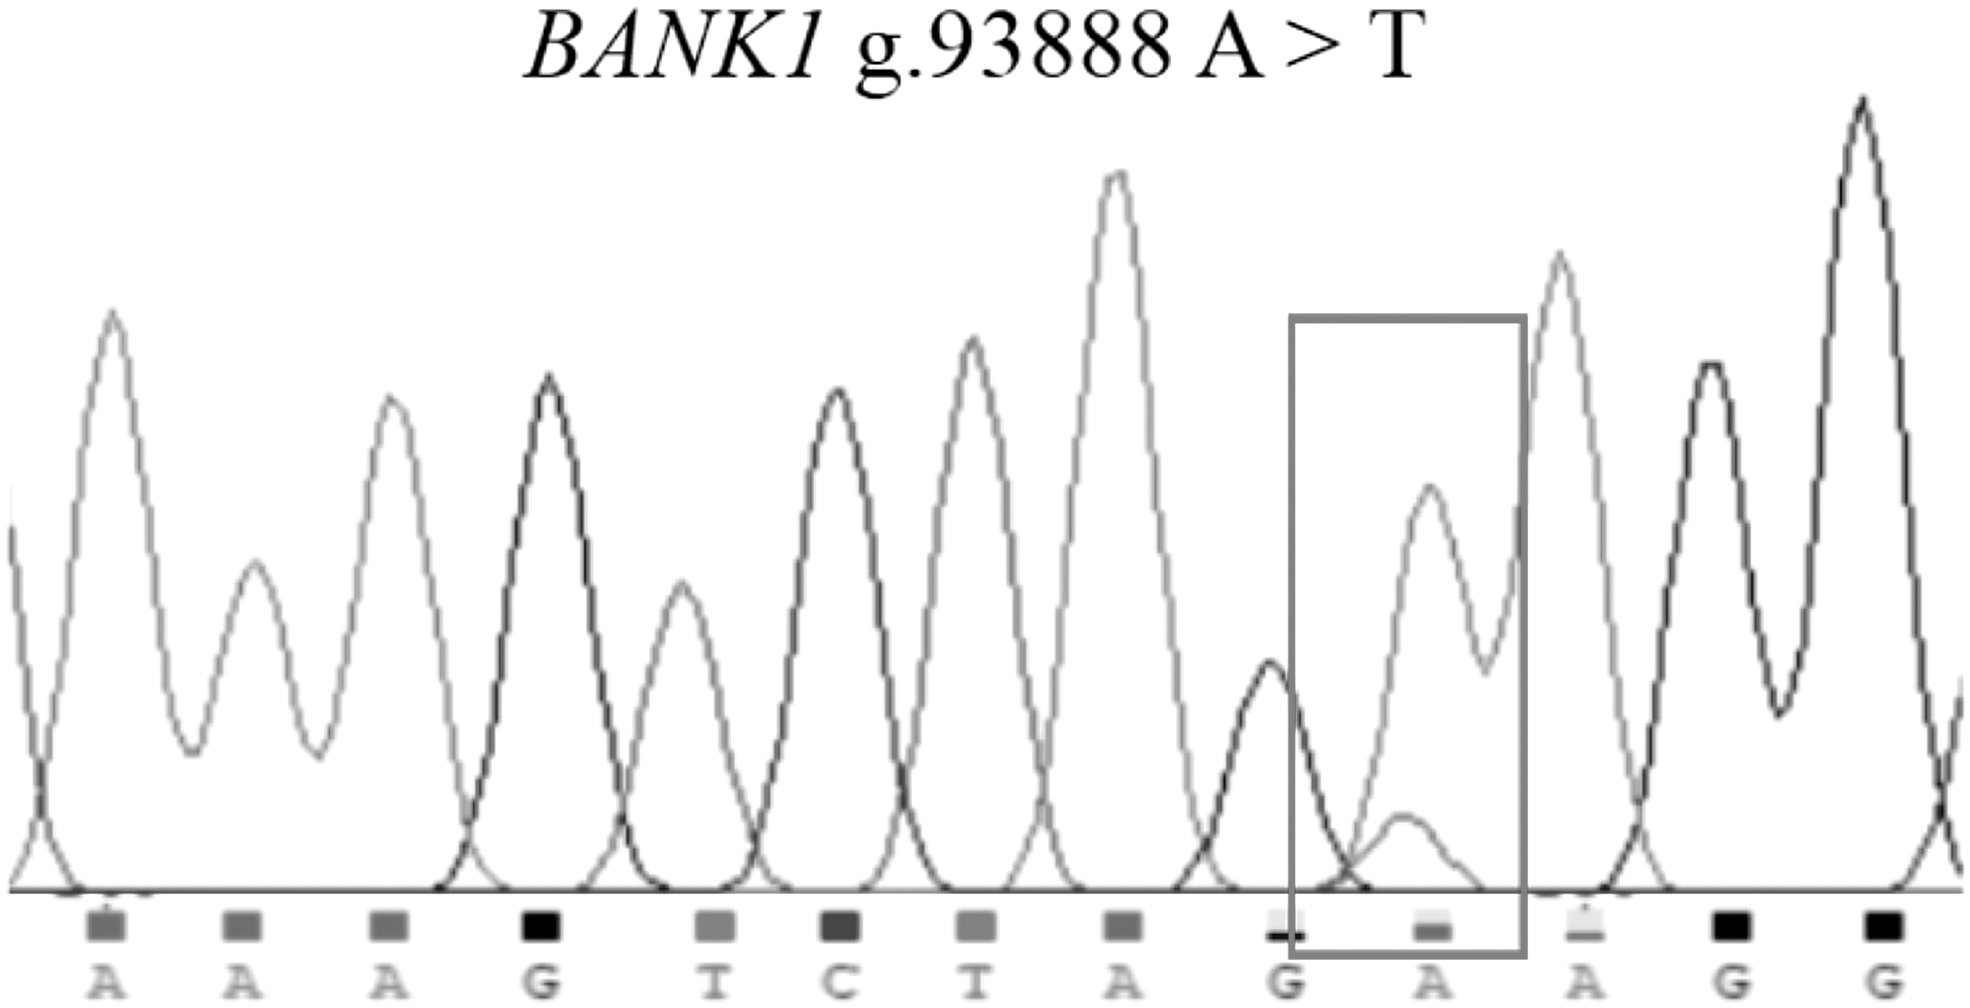
Sequencing peaks of ovine gene locus. The overlapping peak indicates mutation sites.
Genotype and allele frequency analysis
The polymorphic locus, g.93888 A > T, of the BANK1 gene was genotyped by KASPar assay, and three genotypes were identified: AA (n = 184), AT (n = 594), and TT (n = 327) (Fig. 5). The genetic parameters were calculated for the experimental population (Table 4). Results showed genotype frequencies of 0.167, 0.537, and 0.296 for AA, AT, and TT genotypes, respectively, and gene frequencies of 0.435 and 0.565 for A and T, respectively.
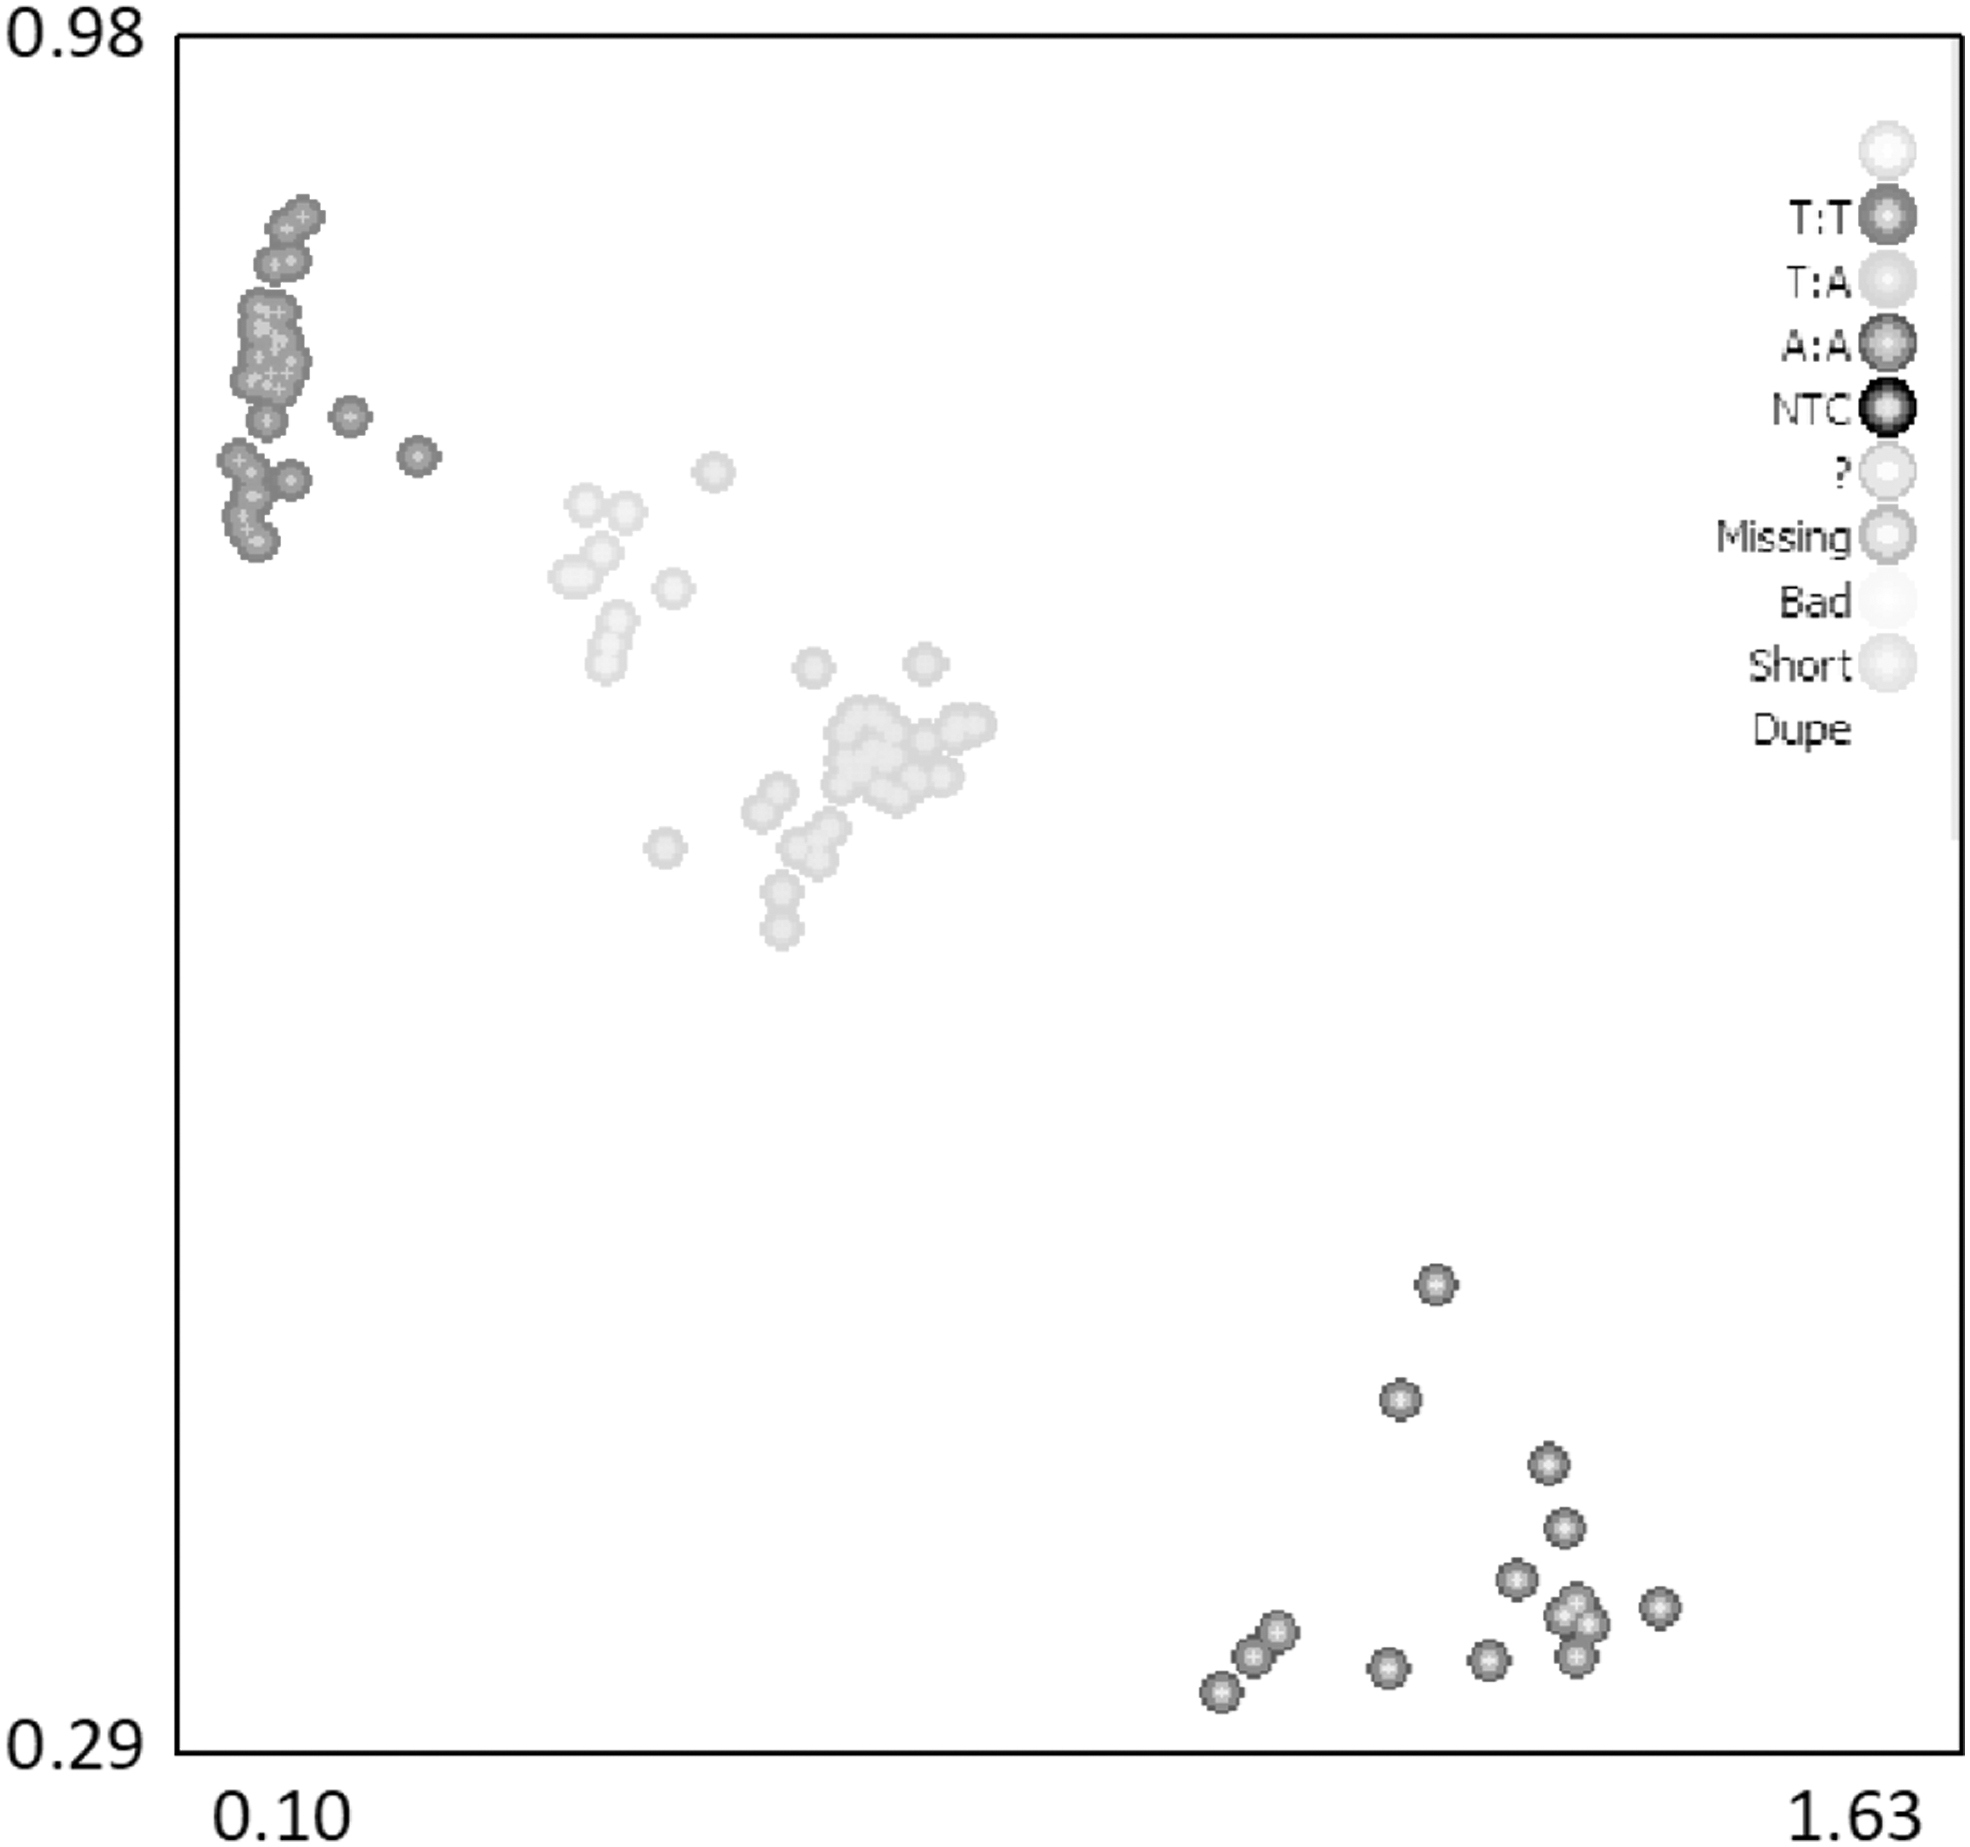
SNP genotyping of ovine BANK1 g.93888 A > T using the KASPar assay. The TT genotype is in the upper left corner, the TA genotype is in the lighter color against the middle, and the AA genotype is in the lower right corner.
Genotype Frequency, Allele Frequency, and Genetic Diversity at BANK1 Locus
He, expected degree of heterozygote; Ho, expected degree of purity; Ne, number of alleles; PIC, polymorphic information content; PHWE, p value of Hardy–Weinberg equilibrium.
The values of He, Ho, Ne, PIC, and PHWE were 0.492, 0.508, 1.967, 0.371, and 0.002, respectively. This SNP of the BANK1 gene did not conform to the Hardy–Weinberg equilibrium law (p < 0.05) and showed a medium degree of polymorphisms (PIC = 0.371).
Association analysis of feed efficiency traits with SNP
Results of the association analysis are shown in Table 5. The SNP at the g.93888 A > T locus of the BANK1 gene was remarkably associated with ADFI, RFI, tail length and width, weight of tail fat, and relative carcass and live weights (p < 0.05), and other traits were not significantly associated with other traits (p > 0.05).
The Association Between Single-Nucleotide Polymorphism of the BANK1 Gene and Feed Efficiency Traits
The superscripts (a,b) are significance markers indicating significant differences between groups (p < 0.05).
These results showed that although there were no obvious differences in body weight and ADG between sheep of AA and TT genotypes (p > 0.05), ADFI and tail fat weight were remarkably higher in sheep with the AA genotype than those with the TT genotype (p < 0.05), suggesting that sheep with the AA genotype consume more feed and produce more fat at the same weight gain.
In conclusion, sheep with the TT genotype had a higher feed efficiency than sheep with the AA genotype.
Discussion
Feed efficiency of livestock is recognized as a complicated trait (Cantalapiedra-Hijar et al, 2018) and it is affected by many factors (physiological factors, management factors, environmental factors, and feed, etc.). Among the many factors that influence feed efficiency, the most important are fat deposition, energy metabolism, digestion, absorption, and utilization of nutrients (Guinguina et al, 2020).
Hu sheep are typically short-tailed fat sheep, and fat tails are thought to be an expression of adaptation to unfavorable conditions, where tail fat storage is necessary for the fall and winter to cope with migration and food shortages and unfavorable environmental conditions (Ermias et al, 2002). However, in current indoor practical production of sheep, tail fat not only loses its advantage as an energy reserve, but too much tail fat also affects feed efficiency and increases feed costs.
In addition, the energy required for growth is different from the energy required for fat deposition, and a large amount of fat deposition is considered to be an indication of excess energy (Bulle et al, 2007). In practice, livestock with similar weight gain and lower fat deposition have relatively lower FI and higher feed efficiency (Zhang et al, 2021b). Currently, MAS is a widely used and efficient breeding method and its rational use can shorten the time to breed sheep with high feed efficiency (Dekkers, 2007; Gao et al, 2007).
In this study, correlation analyses and descriptive statistics were carried out for traits related to feed efficiency, with the weight of tail fat showing greater variation and the RFI correlating with ADG and ADFI. These results suggest that there is a larger selection space for tail fat weight and that selection for low RFI and low tail fat deposition can improve feed efficiency.
Subsequently, expression levels of the BANK1 gene in Hu sheep were evaluated in 10 tissues; results showed that the BANK1 gene was extensively expressed in the tissues, with expression in the lymph being significantly higher compared with the rest of the tissues (p < 0.05). The study has shown that the BANK1 gene is predominantly expressed in B cells and exhibits a scaffolding function in the pathways of B cell signaling (Hernández et al, 2021), which circulate throughout the body in the blood, thus the BANK1 gene is expressed in all tissues.
In addition, as lymph is the main settlement place for B cells, the expression of the BANK1 gene is much higher in lymph than in other tissues. It is worth mentioning that there is a large amount of lymph in the mesentery of sheep, and we speculate that a large number of B cells pass through the mesentery during the circulation of lymphatic fluid, so the expression of the BANK1 gene in the duodenum is second only to lymph. The study also showed that the BANK1 gene was expressed in the lymph nodes of adult mice, which was consistent with our results.
Existing reports on the BANK1 gene suggest that it has a more complex function. Some studies have shown that the BANK1 gene is related to autoimmune diseases in humans (Chang et al, 2009; Yang et al, 2010; Zou, 2011). As the body's immune cells, B cells are involved in maintaining homeostasis in the internal environment, removing harmful substances from the body, ensuring good health, and reducing environmental stress trauma.
By participating in immune regulation, the BANK1 gene indirectly affects the body's energy metabolism levels, reducing the adverse effects of the environment on sheep, thus ensuring FI and feed efficiency. In addition, the study found that the BANK1 gene can influence B cell signaling and associated diseases, and basal expression of the FOXO1 gene was increased in B cells from individuals carrying the BANK1 risk allele, along with increased expression of the FOXO1 target gene in response to stimulation with CD40 and anti-IgM.
FOXO1 is not only an important transcriptional target of the PI3K/AKT pathway but also a major functional gene for metabolism of glucose in the liver (Arcidiacono et al, 2018). In addition, the FOXO1 gene has also participated in differentiation and expression of muscle cells (Sun et al, 2018) and engaged in muscle atrophy and energy regulation, as well as coordination of gene expression programs and regulation of cellular physiological activities, including metabolism, apoptosis, cycle progression, and antioxidative stress (Qi et al, 2020).
Thus, the BANK1 gene affects the expression of the FOXO1 gene, which may indirectly affect the cellular metabolism of glucose and energy use efficiency of the organism. Moreover, the BANK1 gene can influence signaling and cytokine production of type I interferon (Georg et al, 2016) and interact with phospholipase 2C (PLCg2) (Manuel et al, 2013).
PLCg2 is engaged in the formation of inositol 1,4-5-trisphosphate (IP3) and diacylglycerol (DG), which play a role in calcium mobilization within receptor cells, thus affecting the metabolic function of the animal organism in many important activities involving calcium ions (neurotransmission, regulation of enzyme activity, and effects on cell membrane activity).
Therefore, we speculated that the BANK1 gene affects production of second messengers (IP3 and DG) and thus indirectly affects the activity of calcium channels, altering the concentration of calcium ions and thus the conformation of calmodulin and other calcium sensors so that their affinity for target proteins is altered, turning on a range of physiological activities and thus indirectly influencing feed efficiency in sheep.
In addition, our population did not meet Hardy–Weinberg's theorem (p < 0.05), and we speculated that sheep carrying the AA genotype have a higher likelihood of disease and lower resistance to environmental stress due to gene function and are therefore more likely to be culled in house-training situations.
Thus, it was essential to investigate the underlying impact of the BANK1 gene on feed efficiency in Hu sheep. Subsequently, we detected a novel SNP (g.93888 A > T) by Sanger sequencing, which was located in the second intron of the BANK1 gene. The mutation in the intron does not directly change the sequence of amino acids, but several previous articles have shown that intron mutations can affect animal traits, for example, growth traits (Lining, 2003; Liu et al, 2016), feed efficiency (Sihua et al, 2018), and wool yield (Hanif, 2019).
Mutations in both intron and splicing-related sites can lead to abnormalities in the splicing product of RNA and thus in the function of the protein product (Padgett, 2012). Therefore, to further investigate the effects of the mutation locus that we identified on traits in sheep, we analyzed the relationship between different genotypes and feed efficiency traits. The results showed that the SNP of the BANK1 gene (g.93888 A > T) was remarkably associated with feed efficiency (RFI).
Therefore, we suggest that the polymorphism locus with the BANK1 gene could be used as a candidate molecular marker for improvement of feed efficiency in Hu sheep. Nevertheless, more studies are necessary to confirm the regulatory mechanism of the BANK1 gene on feed efficiency.
Conclusions
In this article, a novel study of the BANK1 gene in sheep was conducted to detect expression levels in 10 tissues and explore the existence of its polymorphism and its relationship with feed efficiency traits in Hu sheep. Results of qRT-PCR showed that the BANK1 gene was predominantly expressed in lymph compared with other tissues.
A new SNP, g.93888 A > T, was identified in the BANK1 gene, which was markedly associated with feed efficiency traits in Hu sheep. The novel polymorphic locus of the BANK1 gene can be used as a genetic marker to provide a method for improving feed efficiency in Hu sheep.
Footnotes
Authors' Contributions
X.Ze., W.Z., and X.Zh. conceived and designed the study. J.W., L.Z., W.L., J.C., B.Z., D.X., J.Z., and C.L. participated in DNA and RNA extraction. X.Ze., X.Y., R.Z., Z.M., J.L., and P.C. analyzed the data. Y.Z., X.L., D.Z., X.W., and Y.Z. contributed to the feeding experiment and sample collection. X.Ze. wrote the article. W.Wu and W.Wa. revised the article.
Disclosure Statement
No competing financial interests exist.
Funding Information
This work was supported by the National Key R&D Program of China (2021YFD1300901), the National Joint Research on improved breeds of Livestock and Poultry(19210365), and the West Light Foundation of the Chinese Academy of Sciences (CN), Discipline Team Project of Gansu Agricultural University (NO: GAU-XKTD-2022-20).