




Abstract
Soft tissue sarcomas (STS) are rare malignant tumors of mesenchymal origin, which are easy to metastasize and relapse and are a great threat to human health. In our previous study, the abnormal expression of neurofibromin 1 (NF1) is observed in tumor tissue of STS, and the NF1 gene is regulated by miRNAs. The study aimed to assess the association between NF1-related miRNA gene polymorphisms and the risk of STS. In this case–control study, the information and peripheral blood were collected from 169 patients with STS and 170 healthy controls. Six single-nucleotide polymorphisms of the NF1-related miRNAs were investigated and genotyped using a Sequenom MassARRAY® matrix-assisted laser desorption/ionization time-of-flight mass spectrometry platform. The association between the polymorphisms and the risk of STS was estimated using unconditional logistic regression analysis. There was a significant statistical difference on genotype distribution of miR-199a2 rs12139213 between the case group and the control group (p = 0.026). Comparing with individuals with wild-type AA, individuals with the AT/TT genotype had a 1.753-fold (odds ratio [OR] = 1.753, 95% confidence interval [CI] = 1.090–2.819, p = 0.021) increased risk of STS and 1.907-fold (OR = 1.907, 95% CI = 1.173–3.102, p = 0.009) increased risk of STS adjusted for age and smoking status. Individuals with the AG/GG genotype for miR24–3p rs4743988 displayed a significantly reduced risk of STS compared with individuals with homozygous mutations AA (OR = 0.605, 95% CI = 0.376–0.973, p = 0.038). Individuals carrying the AT/TT genotype for miR-199a2 rs12139213 or the AA genotype for miR24–3p rs4743988 may be susceptible to STS, which could be potential biomarkers for the diagnosis of STS.
Introduction
Soft tissue sarcomas (STS) are rare malignant tumors of mesenchymal origin. The incidence of STS is between 1.8 and 5.0 cases per 100,000 people per year (Ebrahimpour et al., 2022). Due to the difficulty in early diagnosis and high invasiveness, STS can easily metastasize and relapse, causing great harm to human health. Early diagnosis contributes to the prognosis of the disease. Although the majority of STS have no clear etiology, epidemiological studies have demonstrated that the occurrence of STS is associated with genetic predisposition (Xu et al., 2020), including oncogene activation and tumor suppressor gene inactivation.
Neurofibromin 1 (NF1) is one of the tumor suppressor genes. Previous studies have found that inactivating NF1 mutations and deletions can be found in various malignant tumors (Philpott et al., 2017), including STS (Kanojia et al., 2015; Walther et al., 2016). Our previous studies found that the positive rates of NF1 protein in STS tissues were decreased compared with those in adjacent tissues (Zhang et al., 2022). And NF1 gene polymorphism was associated with the risk of STS (Zhang et al., 2021). In addition, the expression of tumor suppressor genes is directly or indirectly regulated by miRNAs, which leads to tumorigenesis (Weng et al., 2013).
MiRNAs are a group of single-stranded 18–25 ribonucleotide particles present inside cells and body circulatory systems (Gholikhani-Darbroud, 2020). They are involved in regulating the expression of about 60% of coding genes. They are widely involved in almost all the physiological processes of cells (Friedman et al., 2009), such as cell differentiation, proliferation, and apoptosis (Griffiths-Jones et al., 2008). Also, miRNAs regulate gene expression by base-pairing with target mRNA in the 3′-untranslated region (3′-UTR). Previous studies have shown that some miRNAs may regulate the tumor suppressor gene NF1 during the occurrence and development of nonsmall-cell lung cancer (NSCLC) and breast cancer. For example, H19 competitively binds miR-107 to regulate NF1 and promote the development of NSCLC (Qian et al., 2018). In breast cancer, miR-10b activates proto-oncogene-Jun expression through RhoC and NF1 (Knirsh et al., 2016). Single-nucleotide polymorphisms (SNPs) may affect the expression of miRNA, leading to the occurrence of tumors (Tian et al., 2022).
An SNP is a genome-wide polymorphism in DNA sequences caused by a single-nucleotide variation, often caused by mutations in a single gene such as conversion or transmutation. SNPs are ubiquitous in the human genome and are the most common type of genetic variation (Koberle et al., 2016). MiRNA SNPs may affect the expression of miRNA and finally regulate the levels of target genes, leading to disease occurrence. For example, MiR-146a rs2910164 may affect the expression of miR-146a and thus increase the risk of bladder cancer (Wang et al., 2012). MiR-499 rs3746444 may increase the risk of various cancers (Yang et al., 2018), such as liver cancer (Qiu et al., 2018) and breast cancer (Chen et al., 2012).
Therefore, we speculate it is possible that SNPs located at the binding sites of miRNAs regulating tumor suppressor gene NF1 may affect the expression of NF1-related miRNAs, which is involved in the occurrence of STS by regulating the level and function of NF1. However, the relationship between NF1-related miRNA gene polymorphisms and the risk of STS has not been fully studied.
Therefore, we first screened NF1-related miRNAs through the miRWalk2.0 database, including miR-19a-3p, miR-19b-3p, miR-20a-3p, miR-27a-3p, and miR-27b-3p. In addition, 11 differentially expressed miRNAs, which may regulate NF1, such as miR-199a and miR-24-3p, were found in our previous study (Zhang et al., 2022). Then we screened 6 SNPs of NF1-related miRNAs (miR-199a1 rs74723057, miR-199a2 rs12120556, miR-199a2 rs12139213, miR-19a-3p rs4284505, miR-20a-3p rs1888138, and miR-24-3p rs4743988) based on the screening principle to investigate the association with the risk of STS.
Materials and Methods
Subjects and sample collection
A total of 169 (90 males and 79 females) patients with histologically diagnosed STS were recruited from The Affiliated Cancer Hospital of Zhengzhou University (Henan Cancer Hospital) in China. There were 33 synovial sarcomas, 32 undifferentiated pleomorphic sarcomas, 31 fibrosarcomas, 21 liposarcomas, 16 leiomyosarcomas, 11 rhabdomyosarcomas, 8 Ewing sarcomas of soft tissues, 5 malignant peripheral nerve sheath tumors, 5 spindle cell sarcomas, 3 alveolar soft part sarcomas, 3 angiosarcomas, and 1 clear cell sarcoma (see Supplementary Data). Besides, 170 population-based controls were enrolled during the same period from the individuals for physical examinations without a history of cancer. The information of subjects in the case group and control group was obtained by a questionnaire. All of them were native and permanent residents of Henan Province with similar environmental and dietary habits. Participants who smoked no less than one cigarette per day or those who smoked for more than half a year were categorized as “smokers,” and those who drank more than two times a week for more than 6 months continuously were categorized as “drinkers.”
At the time of their peripheral blood collection, all subjects provided informed consent to participate in this study. The study was approved by the Ethics Committee of Zhengzhou University (The institutional approval number: 2022-200-001), and all of the participating patients signed informed consent forms.
Genomic DNA sample preparation from whole human blood
Genomic DNA was extracted from the patient's blood, and its absorbance at 260 and 280 nm was determined by spectrophotometry to determine the purity and concentration of DNA, and stored in −80°C until use.
Screening NF1-related miRNA SNPs
First, using the miRWalk2.0 database, we selected gene-miRNA targets under the “Validated Target Module” and entered NF1 to search. Then, we selected gene-miRNA targets under the “Predicted Target Module” and entered NF1 to search. Finally, a total of 5 miRNAs (miR-19a-3p, miR-19b-3p, miR-20a-3p, miR-27a-3p, and miR-27b-3p) were obtained by taking the intersection of “Validated Target Module” and “Predicted Target Module” (Fig. 1). In addition, in our previous study, we found 11 differentially expressed miRNAs that may regulate NF1 (Table 1), such as miR-199a and miR-24-3p (Zhang et al., 2022). Therefore, these 16 NF1-related miRNAs were screened out.
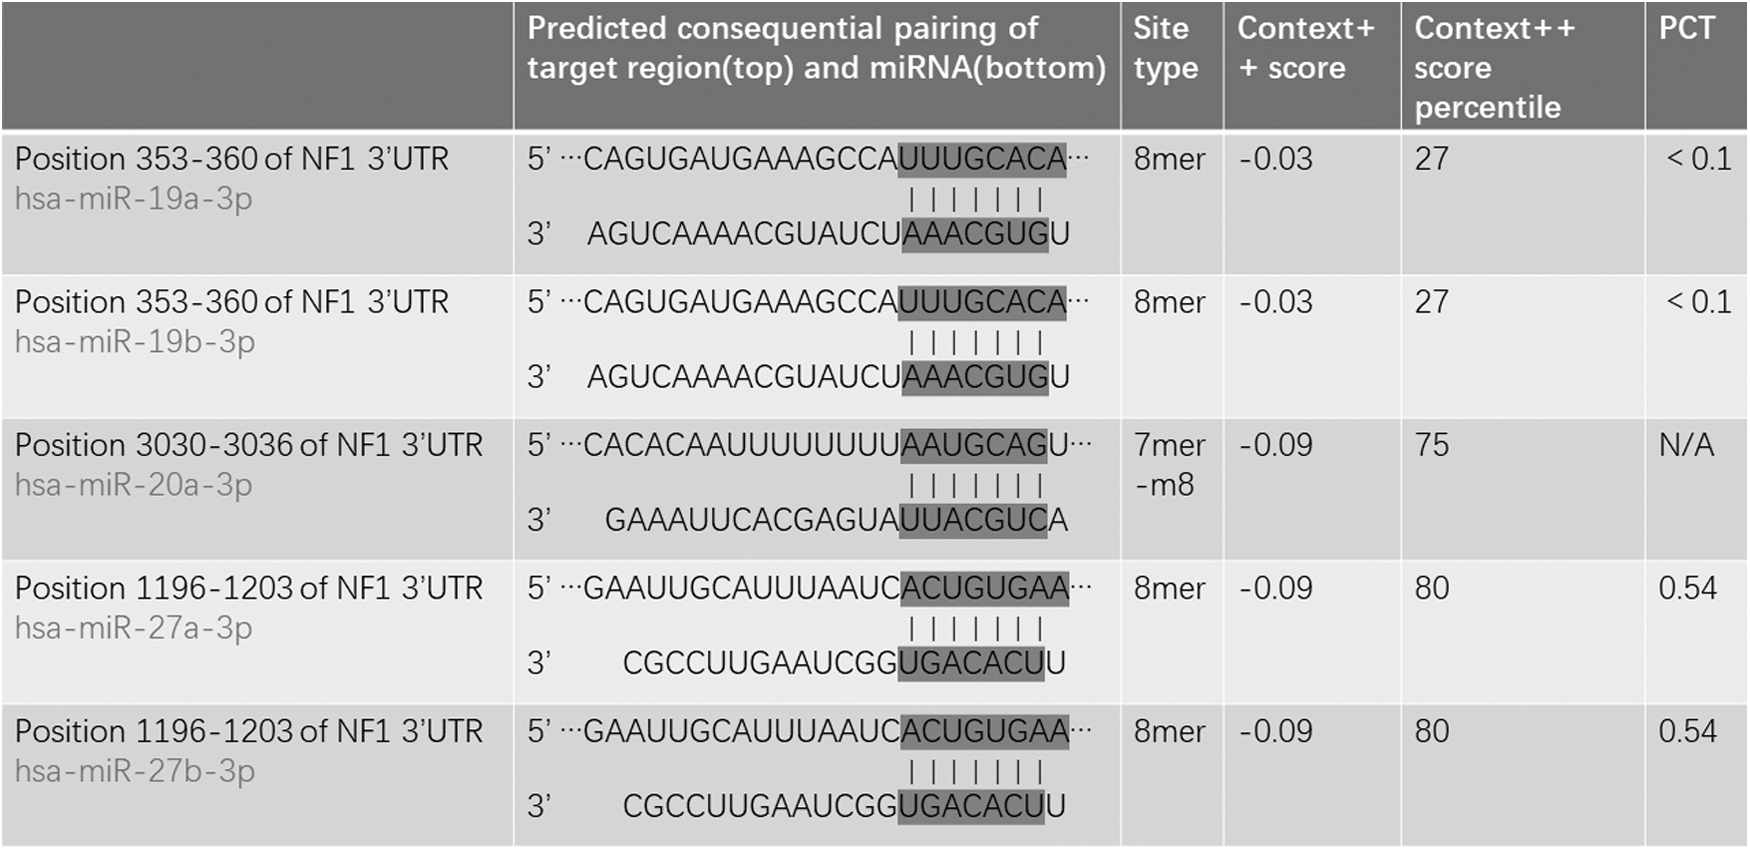
The predicted binding sites between NF1 and miR-19a-3p, miR-19b-3p, miR-20a-3p, miR-27a-3p, and miR-27b-3p.
The Relationship Between NF1 Gene and 11 MiRNAs from Our Previous Study
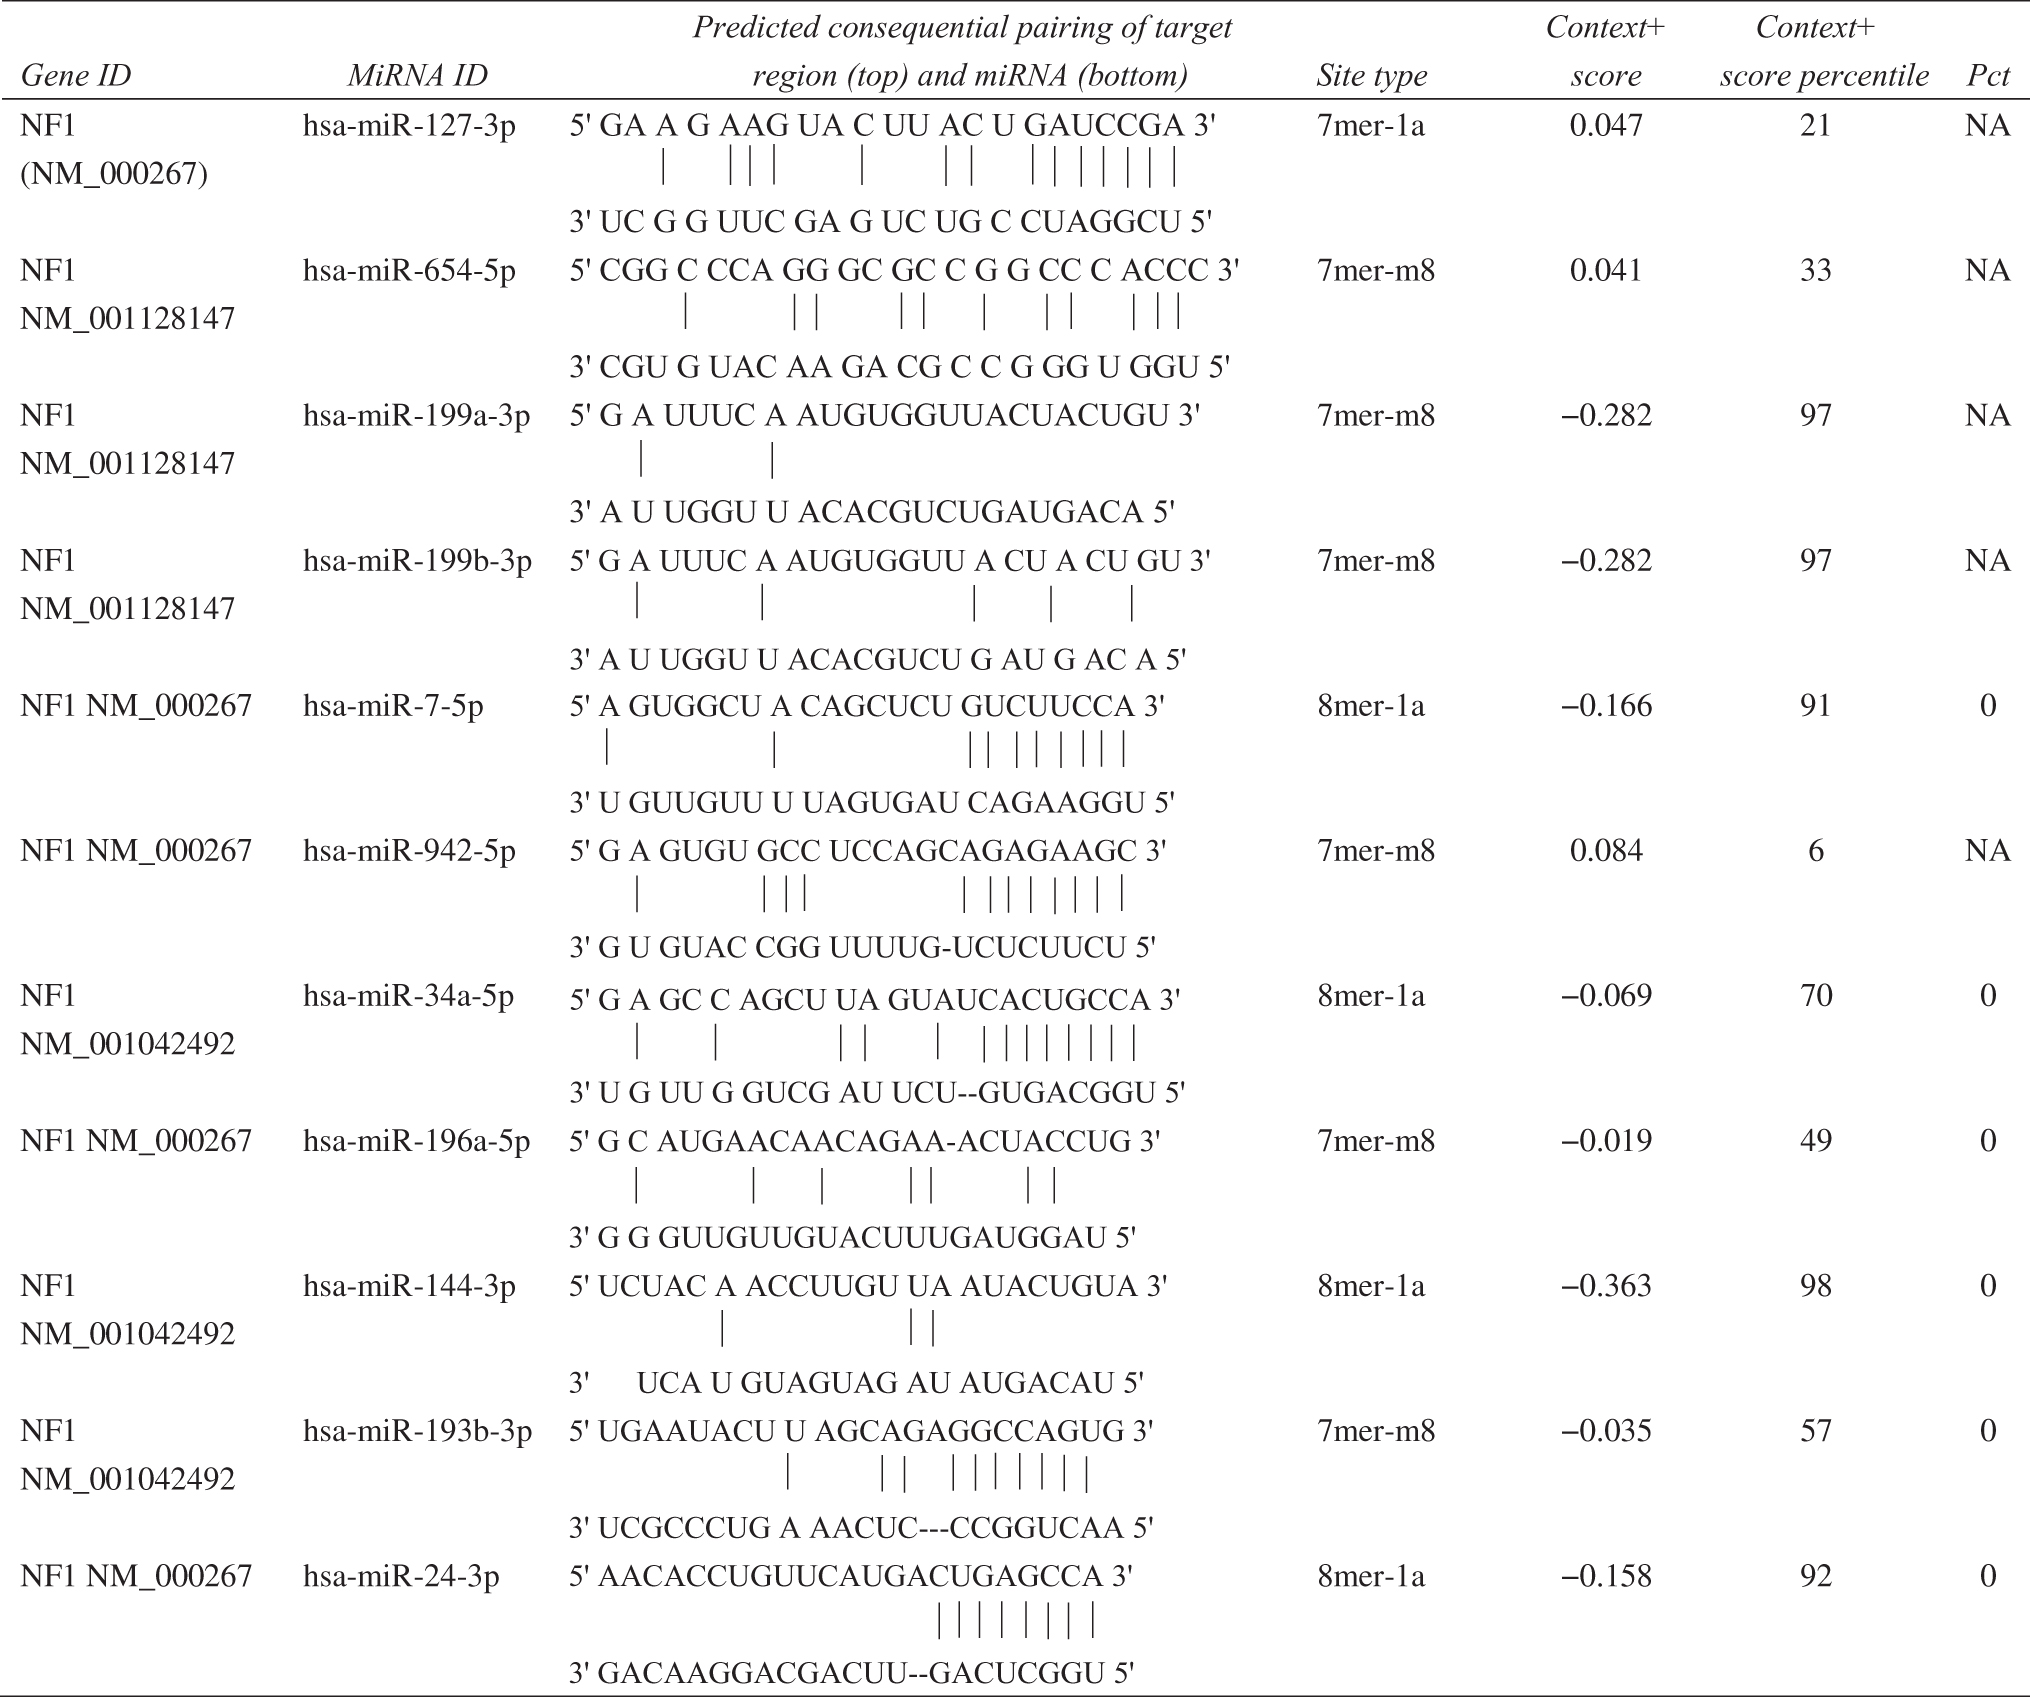
Note: NM_000267, NM_001128147, and NM_001042492 are the three transcripts of NF1 gene.
NA, non-applicable; NF1, neurofibromin 1; Pct, the probability of conserved targeting.
Next, we screened the functional region SNPs in the gene region, promoter proxy (TSS200), exon (missense and synonymous), and 3′-UTR through the NCBI dbSNP database available at the National Library of Medicine website. Also then, we selected the target SNPs to make the minor allele frequency >0.05 and the linkage disbalance r 2 > 0.8 in the Chinese population by 1000 Genomes. Finally, a total of 6 functional region SNPs were selected for genotyping, which were miR199a1 rs74723057, miR199a2 rs12120556, miR199a2 rs12139213, miR19a-3p rs4284505, miR20a-3p rs1888138, and miR24–3p rs4743988.
Detection and validation of NF1-related miRNA genotypes
All subjects' peripheral blood DNA was extracted and sent to the BIO MIAO Biological site. The SNPs were genotyped using a Sequenom MassARRAY® matrix-assisted laser desorption/ionization time-of-flight mass spectrometry platform (Sequenom Inc., San Diego, CA). The 9 μL PCR systems were conducted, including a 2 μL EXTEND mix (AgenaBiocience, Inc.) and a 7 μL shrimp alkaline phosphatase + PCR (Agena Bioscience, Inc.). In the single-base extended PCR conditions, an initial predenaturation was done at 94°C for 30 s, followed by 40 cycles at 94°C for 5 s, 52°C for 5 s, and 80°C for 5 s, five cycles at 52°C for 5 s, 80°C for 5 s, and then a final exposure to 72°C for 3 min. The Assay Designer 3.1 software was used to design PCRs and primers for single-base extensions and synthesis. The primers are shown in Table 2. The genotype plots of miRNA polymorphisms are shown in Figure 2.
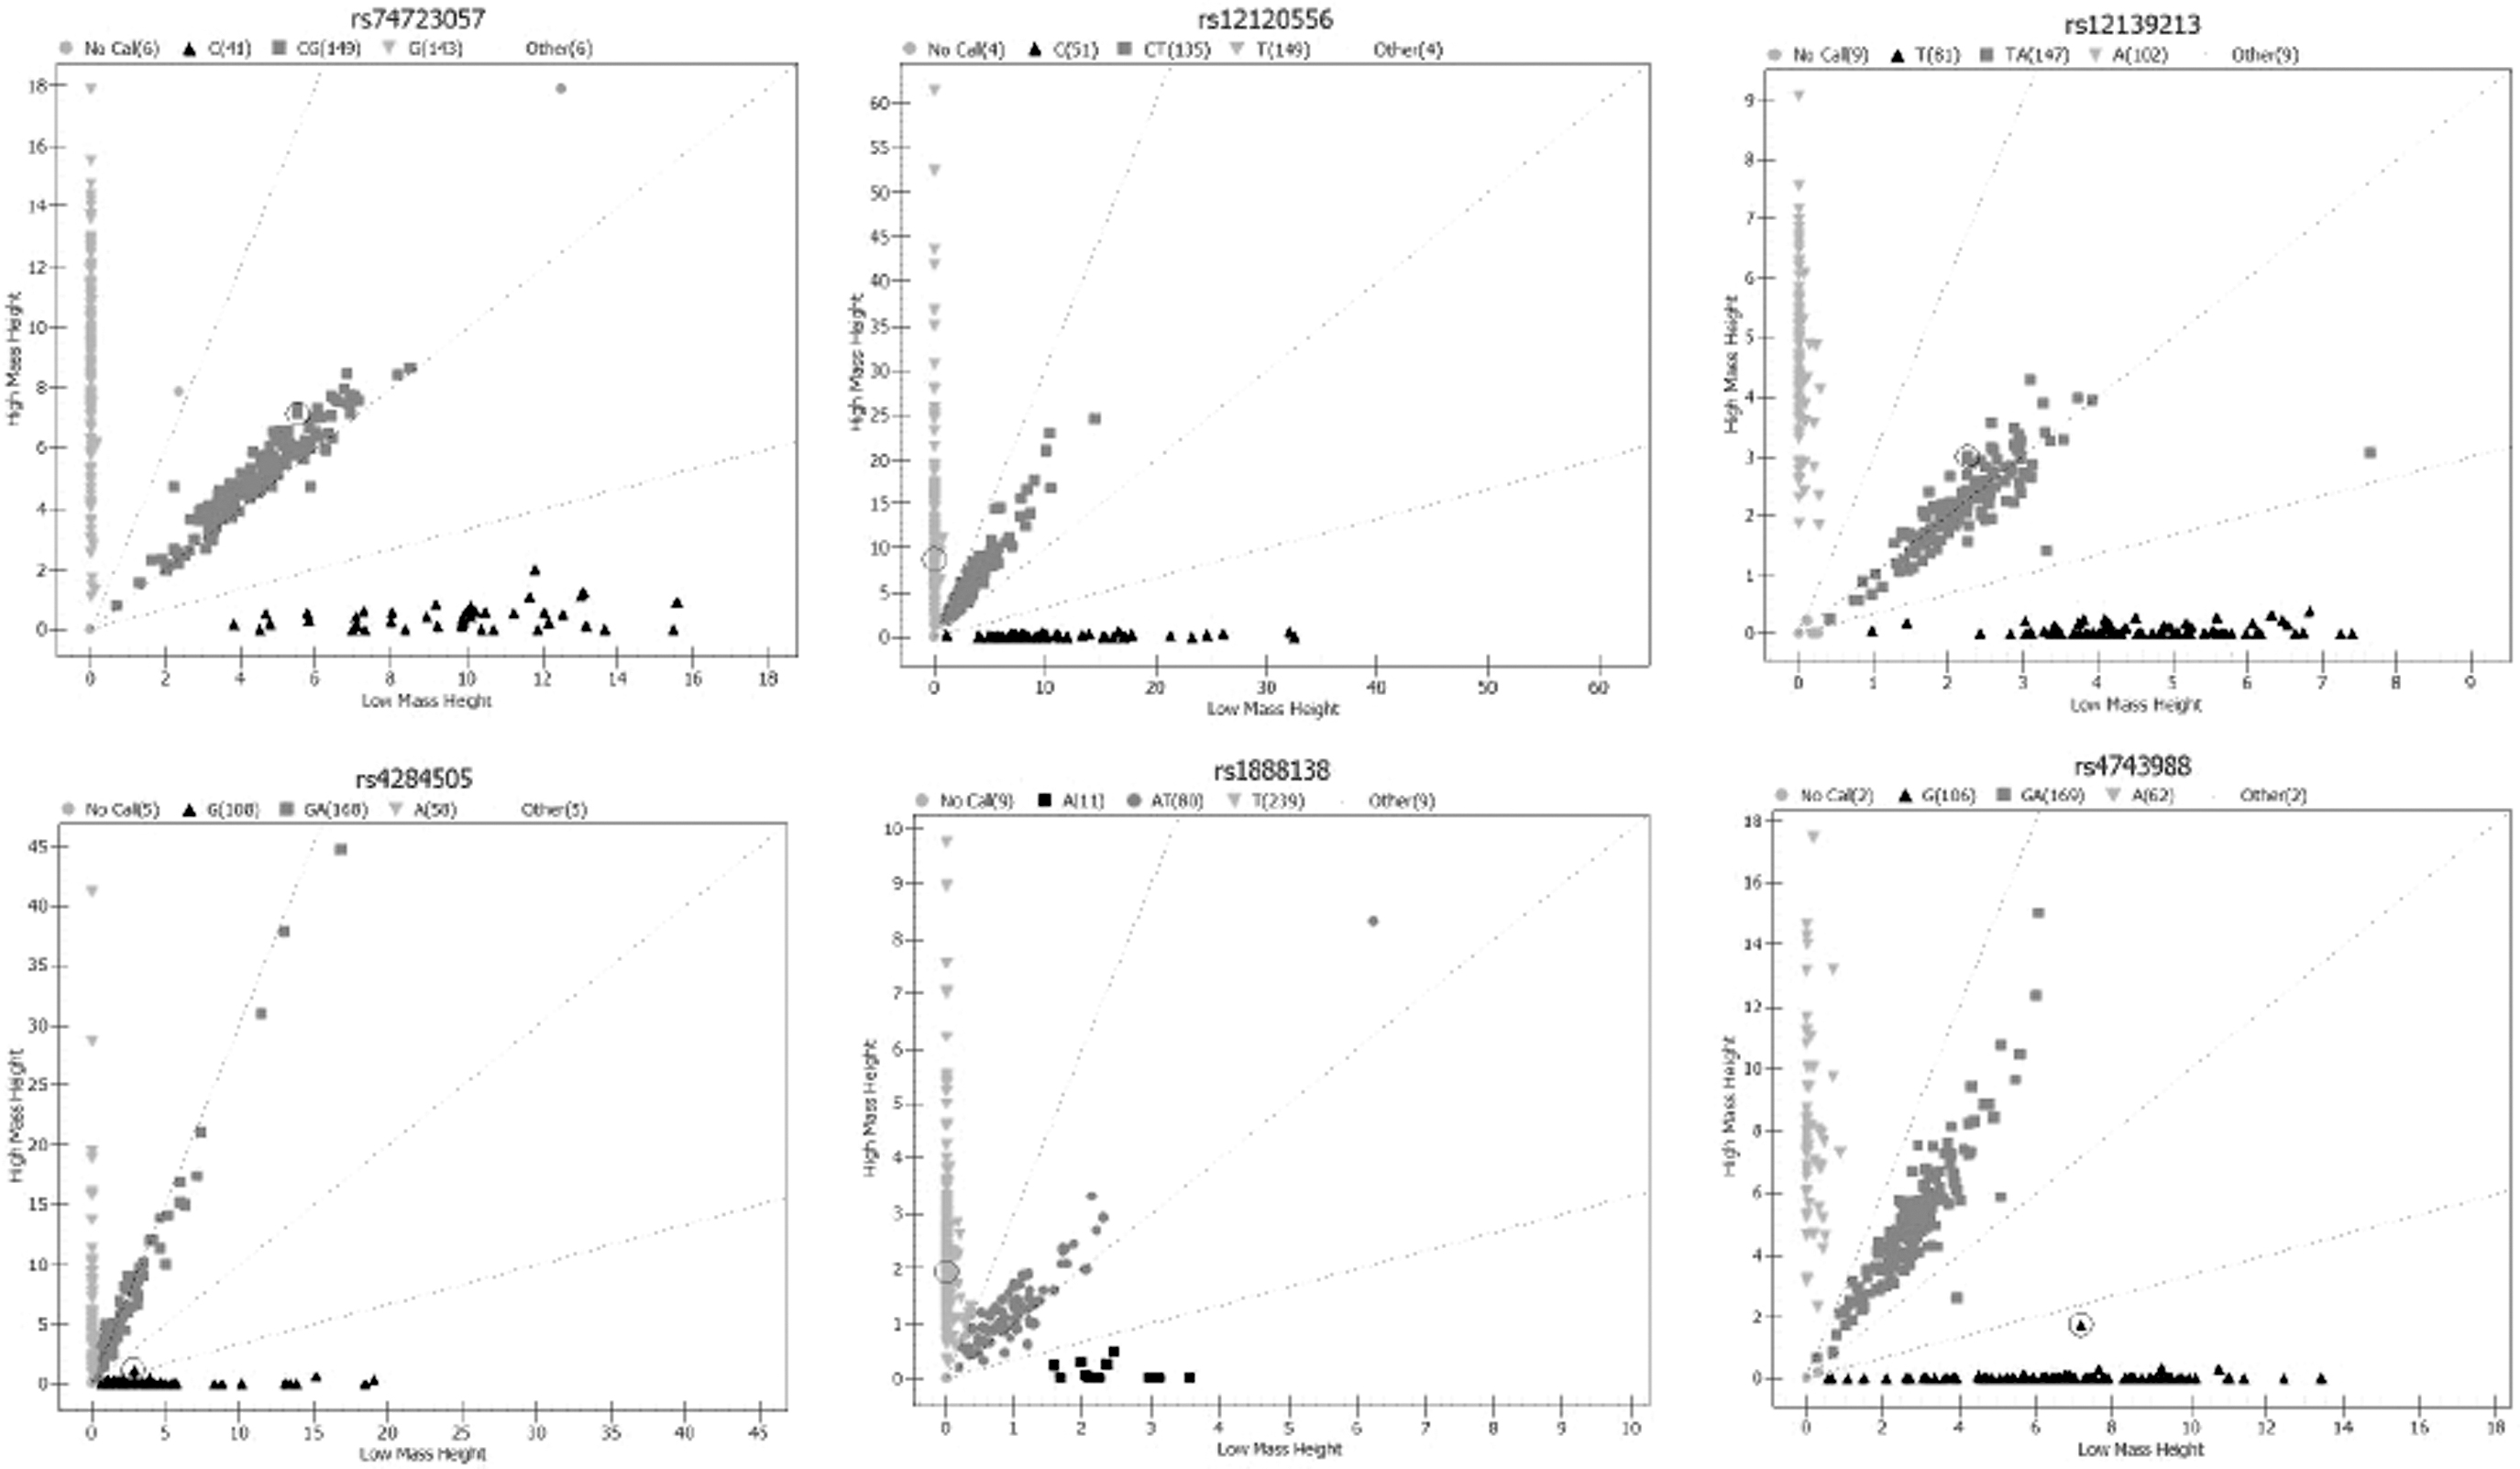
The genotype plots of miRNA polymorphisms. The x and y axes represent the kurtosis of genotypes, respectively. The light grey square represents no call; the black upright triangle, the grey square, and the light grey inverted triangle represent three different genotypes, respectively. Clustering performance shows the evaluation of clustering efficiency, which ranges from 0 to 1.
Primers Sequences for Gene Polymorphism
Forward represents the upstream primer and reverse represents the downstream primer.
Statistical analysis
The double-entry method was adopted to ensure the accuracy of the collected data. The collected data were exported to Excel and then quantified intoSPSS26.0 database for statistical analysis. Independent sample t-test was used to analyze quantitative data such as age, the chi-square test was used to compare qualitative data such as gender, smoking history, and drinking history between the control group and the case group, and the chi-square test of goodness of fit was used to analyze the Hardy–Weinberg genetic balance in the control group. A binary logistics regression model was used to analyze the relationship between genotyping of each locus, genotyping in dominant and recessive models, and the number of mutations in the control group and the case group, and the correlation between gene polymorphism and the risk of STS was analyzed by odds ratio (OR) and 95% confidence interval (CI). The test level was α = 0.05.
Results
General characteristics of the subjects
The characteristics of the study population are shown in Table 3. A total of 170 controls and 169 cases were included in this study. There was no significant difference in gender distribution between the two groups (p = 0.960). However, the age of the control group (51.59 ± 11.08) year was higher than that of the case group (48.18 ± 15.16) year, and the difference was statistically significant (p < 0.05). The difference in smoking and drinking history between the two groups was statistically significant (p = 0.048 and p = 0.017).
General Characteristics of the Subjects
Bold indicates that the value is less than 0.05 and is statistically significant.
Genotypic distribution of the NF1-related miRNA
Distribution of genotypic frequencies in the subject and the Hardy–Weinberg balance test results are shown in Table 4. miR-199a2 rs12120556 did not conform to the Hardy–Weinberg balance (p = 0.03), and the distribution of other loci did conform to the Hardy–Weinberg balance (p > 0.05). The result showed that the population selected in the subject has a good population representation for each locus. Therefore, we further analyzed the other 5 loci except miR-199a2rs12120556.
Distribution of Genotypic Frequencies in the Subject
Bold indicates that the value is less than 0.05 and is statistically significant.
SNP, single-nucleotide polymorphism.
The distribution of genetic polymorphism
There was no statistical difference in genotype distribution of miR-199a1 rs74723057, miR-19a-3p rs4284505, miR-20a-3p rs1888138, and miR-24-3p rs4743988 between the case group and the control group (p < 0.05). There was a significant statistical difference in genotype distribution of miR-199a2 rs12139213 between the case group and the control group (p = 0.026). The distribution of genetic polymorphism between the control group and the case group is shown in Table 5.
The Distribution of Genetic Polymorphism Between the Control Group and the Case Group
Bold indicates that the value is less than 0.05 and is statistically significant.
NF1-related miRNA genotype and the risk of STS
The distribution of gene polymorphisms in SNP loci (miR-199a1 rs74723057, miR-199a2 rs12139213, miR-19a-3p rs4284505, miR-20a-3p rs1888138, and miR-24-3p rs4743988) and the results of STS genetic susceptibility are shown in Table 6. Regarding wild-type homozygosity as the reference group, miR-199a2 rs12139213AT had a 2.010-fold (OR = 2.010, 95% CI = 1.202–3.361, p = 0.008) increased risk of STS. Also, miR-199a2 rs12139213AT had a 2.229-fold (OR = 2.229, 95% CI = 1.314–3.781, p = 0.003) increased risk of STS adjusted for age and smoking status. Moreover, there was no association between the other polymorphisms of the NF1-related miRNAs and the risk of STS.
The Genetic Polymorphisms and the Risk of Soft Tissue Sarcoma
Bold indicates that the value is less than 0.05 and is statistically significant.
p * A logistic regression model was used to analyze the association between polymorphism in miRNA and soft tissue sarcoma risk.
p † A logistic regression model was used to analyze the association between polymorphism in miRNA and soft tissue sarcoma risk adjusted for age, smoking status, and drinking status.
CI, confidence interval; OR, odds ratio; Ref, the reference group when comparing.
Then, we analyzed the association between the gene polymorphism distributions of 5 miRNAs' SNP (miR-199a1 rs74723057, miR-199a2 rs12139213, miR-19a-3p rs4284505, miR-20a-3p rs1888138, and miR-24-3p rs4743988) and STS genetic susceptibility in a recessive and dominant model (Table 7). In the recessive model, the homozygous mutants were set as recessive genes, and the homozygous mutants were taken as reference, and so, the recessive genotypes were homozygous mutants and the dominant genes were wild homozygous and heterozygous mutants. In the dominant model, the wild homozygous mutants were set as recessive genes, and the wild homozygous mutants were taken as reference, and so, the recessive genotypes were wild homozygous mutants, and the dominant genes were homozygous and heterozygous mutants.
The Genetic Polymorphisms and the Risk of Soft Tissue Sarcoma in Dominant and Recessive Models
Bold indicates that the value is less than 0.05 and is statistically significant.
p * A logistic regression model was used to analyze the association between polymorphism in miRNA and soft tissue sarcoma risk in dominant and recessive models.
p † A logistic regression model was used to analyze the association between polymorphism in miRNA and soft tissue sarcoma risk adjusted for age, smoking status, and drinking status in dominant and recessive models.
First, in the recessive model of homozygous mutants as the reference group, miR-24-3p rs4743988 (AG+GG) had a 0.605-fold (OR = 0.605, 95% CI = 0.376–0.973, p = 0.038) reduced risk of STS adjusted for age and smoking status. Then, in the dominant model of wild homozygous mutants as the reference group, miR-199a2 rs12139213 (AT+TT) had a 1.753-fold (OR = 1.753, 95% CI = 1.090–2.819, p = 0.021) increased risk of STS.
In addition, after adjusting for age and smoking status, miR-199a2 rs12139213 (AT+TT) had a 1.907-fold (OR = 1.907, 95% CI = 1.173–3.102, p = 0.009) increased risk of STS. Moreover, there was no association between the other polymorphisms of NF1-related miRNAs and the risk of STS.
Discussion
In this case–control study, we detected and analyzed the polymorphism distribution of NF1-related miRNA SNPs and the association with the risk of STS. There was a significant statistical difference in genotype distribution of miR-199a2 rs12139213 between the case and control. In the dominant model of wild homozygous mutants as the reference group, carrying heterozygous AT or homozygous TT genotypes of miR-199a2 rs12139213 had a 1.753-fold increased risk of STS (p = 0.021) compared with carrying AA wild-type genotypes and a 1.907-fold increased risk of STS after adjustment for age and smoking status (p = 0.009). In the recessive model of homozygous mutants as the reference group, carrying heterozygous AG or wild homozygous AA genotypes of miR-199a2 rs12139213 had a 0.605-fold reduced risk of STS (p = 0.021) compared with carrying AA homozygous mutations adjusted for age and smoking status in miR-24-3prs4743988. There was no significant correlation between loci (miR-199a1 rs74723057, miR-19a-3p rs4284505, miR-20a-3p rs4743988) and STS susceptibility.
In previous studies, we found that age and smoking impacted disease risk (Zhang et al., 2021). Therefore, we adjusted for age and smoking in this analysis.
MiR-199a1 is located on human chromosome 19p13.2, and miR-199a2 is located on human chromosome1q24.3. In human cells, pre-miR-199a1 and pre-miR-199a2 are two kinds of has-miR-199a precursors, and two kinds of mature miRNAs, miR-199a-5p and miR-199a-3p, can be finally obtained (Wang et al., 2019). As two different mature bodies of miR-199a, miR-199a-5p and miR-199a-3p, showed abnormal expression in various tumor cells, it played an important role in the genesis and development of tumor cells by regulating the biological processes of tumor cell growth, proliferation, cell apoptosis, invasion, and metastasis (Koshizuka et al., 2017; Sakurai et al., 2011). It has been reported to function in various cancers, such as hepatocellular (Liu et al., 2020), Ewing's sarcoma (Li et al., 2021), ovarian cancer (He et al., 2021), clear cell renal cell carcinoma (CCRCC) (Liu et al., 2018), breast cancer (Chen et al., 2016), and STS (Zhang et al., 2022).
Most studies have shown that miR-199a shows downregulation and tumor inhibition in various cancers in vitro and in vivo (Guo et al., 2015). For example, miR-199a-3p was downregulated in hepatocellular carcinoma and may act through the PI3K-Akt signaling pathway (Liu et al., 2020). MiR-199a-5p had downregulated expression and retarded proliferation, migration, invasion, and stem cell-like characteristics in breast cancer. However, miR-199a-3p was overexpressed in CCRCC, and overexpression of miR-199a-3p influenced cell growth and cell proliferation in CCRCC (Liu et al., 2018). Our previous study found that miR-199a-3p expression was increased in the STS tumor tissue, which may affect the expression of NF1 and lead to the occurrence of STS (Zhang et al., 2022). The regulating relationship between miR-199a and NF1 gene needs to be verified further.
As for gene polymorphisms related to miR-199a, a previous study had shown that the C/T variant of rs2057482, an SNP located near the miR-199a binding site in hypoxia-inducible factor-1 alpha (HIF-1α), might lead to differential regulation of HIF1α by miR-199a. Also, the miR-199ars2057482-CC genotype increases the susceptibility to pancreatic ductal adenocarcinoma and is associated with cancer progression (Wang et al., 2016). In the study of multiple sclerosis (MS), rs1005039, an SNP located in motifs flanking hsa-miR-199a1, had no statistical significance with the occurrence of MS (Hecker et al., 2022). However, there was no study on the relationship between genetic polymorphisms of miR-199a-related SNPs and the risk of STS. In this case–control study, the risk of STS increased significantly in patients with NF1-related miRNA SNP miR-199a2rs12139213 AT/TT. However, there was no significant correlation between miR199a1 rs74723057 and STS susceptibility.
To our knowledge, these findings are the first to implicate that miR-199a2 gene polymorphisms were associated with STS risk. This evidence promoted the potential use of miR-199a as a clinical biomarker and provided ideals for the pathogenesis of STS.
MiR-24-3p is located on human chromosome 9q22.32, and it is the active sequence of miR-24-1 and mir-24-2. MiR-24-3p may be involved in the development of various cancers, such as pancreatic cancer (Borchardt et al., 2021), lung adenocarcinoma (Olbromski et al., 2018), papillary thyroid cancer (Capriglione et al., 2022), and gastric cancer tissues (Dong and Liu, 2018). The role of miR-24-3p in cancer has been relatively vague, suggesting both protumor and antitumor effects. For example, miR-24-3p had a significant tumor suppressor activity in pancreatic cancer (Borchardt et al., 2021). miR-24-3p was downregulated and promotes tumor growth through the SOX18 transcription factor in lung adenocarcinoma cells (Olbromski et al., 2018).
However, there was no study on the relationship between miR-24-3p SNPs and the risk of STS. In this study, the risk of STS decreased significantly in patients with miR-24-3p rs4743988 AG/AA, which may be associated with the occurrence of STS. However, this needs to be further verified. To the best of our knowledge, this is the first time to analyze gene polymorphism distribution of miR-20a-3p rs4743988.
MiR-19a-3p is located on human chromosome 13q31.3 and a member of the miR-17-92 cluster (Khalifa et al., 2021). Dysregulation of miR-19a-3p often occurs in various malignancies and is associated with proliferation, apoptosis, metastasis, and chemotherapy resistance, including hepatocellular carcinoma (Jiang et al., 2018), breast cancer (Liu et al., 2019), and prostate cancer (Wa et al., 2018). Some studies have shown that the gene polymorphism of miR-19a-3p may be related to the occurrence of disease (Huang et al., 2019; Marques et al., 2017). For example, miR-19a-3p rs9301654 polymorphism might be associated with ischemic stroke susceptibility (Huang et al., 2019). Previous studies proved that the genotype distribution of rs4284505 was related to systemic lupus erythematosus susceptibility, with the (A/G) genotype having a protective effect and (G/G) genotype increasing susceptibility (Abdel-Gawad et al., 2020). MiR20a-3p is located on human chromosome 13q31.3 and a member of the miR-17-92 cluster (Khalifa et al., 2021).
A study showed that miR-20a-3p was significantly upregulated in gastric cancer serum (Huang et al., 2017). No study has investigated the relationship between miR-20a-3p gene polymorphism and disease. However, in this study, there was no significant correlation between miR-19a-3p rs4284505 or miR-20a-3p rs1888138 and STS susceptibility.
In this study, we investigated NF1-related miRNA gene polymorphism and STS risk. In addition, relevant SNPs can be used as biomarkers for the prevention and screening of STS and provide ideas for further studies on the mechanism of STS. However, there are several limitations to this study. First, the sample size included in this study was limited, and a stratified analysis of each subtype of STS was not conducted. Second, we analyzed the association between NF1-related miRNA SNPs and the susceptibility of STS. However, we did not study the molecular mechanism and function of miRNAs on regulating NF1 expression in the pathogenesis of STS, or the relationship between these miRNAs' polymorphisms and the prognosis of the patient with STS.
Therefore, in the next step, we will follow up the patients involved, continue to increase the number of the samples, and analyze the correlation between STS pathological subtypes or prognosis of STS patients and NF1-related miRNA SNPs, In addition, we will further explore the mechanism of NF1-related miRNAs affecting the occurrence of STS.
In conclusion, individuals carrying the AT/TT genotype for miR-199a2 rs12139213 or the GG genotype for miR24–3p rs4743988 may be susceptible to STS, which could provide a clue for the diagnosis of STS as biomarkers.
Footnotes
Acknowledgments
We appreciate all the people and patients involved in this work.
Authors' Contributions
P.Z. and L.L.H. wrote the main article text, X.L.L. and F.L.H. analyzed the data, X.Y.N. collected the samples, and Y.S. and W.T.Y. gave the instructions to this study. All the authors reviewed the article.
Ethics Approval
The study was reviewed and approved by the Ethical Committee of Zhengzhou University. The patients/participants provided written informed consent to participate in this study.
Availability of Data and Materials
All methods were performed in accordance with the relevant guidelines and regulations. Also, the data would be obtained by contacting the corresponding author.
Disclosure Statement
The authors declare no potential conflict of interest.
Funding Information
This study was financially supported by a grant from the scientific and technological innovation outstanding young talent training project from the Health Commission of Henan Province (No. YXKC2021031).
Supplementary Material
Supplementary Data
References
Supplementary Material
Please find the following supplemental material available below.
For Open Access articles published under a Creative Commons License, all supplemental material carries the same license as the article it is associated with.
For non-Open Access articles published, all supplemental material carries a non-exclusive license, and permission requests for re-use of supplemental material or any part of supplemental material shall be sent directly to the copyright owner as specified in the copyright notice associated with the article.
