




Abstract
Infiltrated immune cells are an important constitute of tumor microenvironment, which exert complex effects on gastric cancer (GC) pathogenesis and progression. By using weighted gene co-expression network analysis, integrating the data from The Cancer Genome Atlas-stomach adenocarcinoma and GSE62254, we identify Aldo-Keto Reductase Family 1 Member B (AKR1B1) as a hub gene for immune regulation in GC. Notably, AKR1B1 is associated with higher immune infiltration and worse histologic grade of GC. In addition, AKR1B1 is an independent factor for predicting the survival rate of GC patients. In vitro experiments further demonstrated that AKR1B1-overexpressed THP-1-derived macrophages promoted the proliferation and migration of GC cells. Taken together, AKR1B1 plays an important role in GC progression by regulating immune microenvironment, which could be a biomarker for predicting GC prognosis as well as a potential therapeutic target for GC treatment.
Introduction
Gastric cancer (GC) is a kind of malignant tumor with high morbidity and mortality, which is fifth most common cancer globally and the fourth leading cause of cancer deaths, responsible for 70,000 deaths worldwide annually (Poorolajal et al., 2020). The 5-year survival rate of GC is estimated <30%, since most patients are diagnosed at an advanced stage (Lordick et al., 2022; Wang et al., 2022b). Therefore, it is important to identify efficient biomarkers and therapy targets to improve the prognosis and treatment for GC.
Immune cell infiltration is an important part of tumor microenvironment, which participates in the survival, invasiveness, metastasis, and responsiveness to therapeutics of cancers (Turley et al., 2015). Recent studies revealed that tumor-infiltrated immune cells, including dendritic cells (DC), macrophages, neutrophils, T cells, and B cells, have complex effects on the GC pathogenesis and progression (Zavros and Merchant, 2022). Under ideal conditions, the cancer-related immunity could totally eradicate malignant cells (Ferrone and Dranoff, 2010). However, in circumstances of chronic inflammation, accumulation of reactive oxygen species (ROS), and immunosuppression, immune infiltration promotes GC development (Ferrone and Dranoff, 2010; Ma et al., 2022). Therefore, systemic analysis on the relationship between immune infiltration and GC using bioinformatics tools is useful and necessary.
Estimation of Stromal and Immune cells in Malignant Tumors using Expression data (ESTIMATE) algorithm is a method utilizing gene expression signatures to infer the fraction of stromal and immune cells in tumors (Yoshihara et al., 2013). Moreover, weighted gene co-expression network analysis (WGCNA) is a systematic strategy integrating highly correlated genes into several modules and investigating the association between gene groups and clinical/molecular phenotypes (Langfelder and Horvath, 2008). In this study, we analyzed genes that are highly associated with immune infiltration by ESTIMATE score and WGCNA using the data from The Cancer Genome Atlas (TCGA)-stomach adenocarcinoma (STAD) and GSE62254 and identify Aldo-Keto Reductase Family 1 Member B (AKR1B1) as a hub gene.
Aldo-keto reductase family 1 (AKR1) is known as oxidoreductases, which reduce electrons from nicotinamide adenine dinucleotide phosphate and play an important role in cellular energy metabolism (Penning, 2015; Srivastava et al., 2005). AKR1B1 participates in the polyol pathway catalyzing the conversion of excess glucose to sorbitol (Saraswathy et al., 2014). Recently, pioneer researches revealed high expression of AKR1B1 was associated with numerous cancer types (Khayami et al., 2020). Overexpression of AKR1B1 was proven to promote the proliferation and migration of cancer cells of colorectal cancer, breast cancer, and pancreatic cancer by in vitro experiments (Khayami et al., 2020; Reddy et al., 2017; Taskoparan et al., 2017; Xiao et al., 2018). However, the role of AKR1B1 in GC remains largely unknown. In this article, we investigated AKR1B1's functional annotation, association with immune infiltration, relationship to clinicopathological characteristics, and predictive value for GC prognosis.
Materials and Methods
Data collection
The RNA sequencing data of TCGA-STAD cohort containing 443 samples in fragments per kilobase per million form were downloaded from TCGA database. In addition, the GSE62254 dataset, including 300 samples, was obtained from the Gene Expression Omnibus (GEO) database. This study contains no data from original clinical trials. All human samples analyzed in this article were retrieved from public databases (TCGA and GEO).
Estimation of stromal and immune cells in malignant tumor tissues using expression data
Estimation of stromal and immune cells in malignant tumor tissues using expression data (ESTIMATE) algorithm is a tool to evaluate the immune score, stromal score, and tumor purity of each sample, which was calculated in R with packages of “estimate” and “tidyverse” (Yoshihara et al., 2013). The ESTIMATE scores were then defined as phenotypic data for subsequent WGCNA analysis.
Weighted gene co-expression network analysis
The “WGCNA” package was used to identify key gene modules remarkably related to immune infiltration. The expression profiling of TCGA-STAD and GSE62254 cohorts were input for WGCNA. TOM matrix was generated in the condition of the soft-thresholding power = 4 and the scale-free R 2 = 0.9. Then genes were clustered and the hub modules of TCGA-STAD and GSE62254 cohorts were identified, respectively.
Enrichment analyses and clinical significance evaluation of overlapped hub genes
The genes in hub modules of TCGA-STAD and GSE62254 cohorts were overlapped using jvenn (Bardou et al., 2014). Then “clusterProfiler” package was used to perform Gene Ontology (GO) and Kyoto Encyclopedia of Genes and Genomes (KEGG) analyses in R on the cutoff value of adj.p < 0.05. In addition, the Least Absolute Shrinkage and Selection Operator (LASSO) and Univariate Cox regression analyses were performed on overlapped genes using the “glmnet” package to determine possible hub genes (Tibshirani, 1996).
Gene set enrichment analyses for AKR1B1
According to AKR1B1 median expression, samples in TCGA-STAD cohort were divided into high and low expression groups. The differentially expressed genes (DEGs) were identified using “DESeq2” package in R. Then GO and KEGG were conducted and visualized with “clusterProfiler,” “GOplot,” and “ggplot2” packages. Moreover, GSEA analysis was adopted to find vital biological pathways between groups with different AKR1B1 expression.
Immunomodulation analysis for AKR1B1
Infiltration enrichment of 24 common immune cells in TCGA-STAD tissues were analyzed with single-sample Gene Set Enrichment Analysis (ssGSEA) and CIBERSORT algorithm (Newman et al., 2015). The association between AKR1B1 expression and immune cell infiltrates, as well as PDCD1 and CTLA4 expression was investigated using Spearman's correlation.
Clinical relevance investigation and a nomogram construction
Information of patients' clinical outcomes in TCGA-STAD cohort, including overall survival (OS), disease-specific survival (DSS), and progression-free interval (PFI), were collected. Prognosis value of AKR1B1 expression on clinical relevance factors was examined using Kaplan–Meier analysis, logistic regression analysis, and univariate/multivariate Cox regression analysis. Next, nomograms, which integrated AKR1B1 expression with other factors, were constructed as a prognostic model to evaluate the predictive probability of 1-, 2-, and 3-year OS, DSS, and PFI.
Cell culture and transfection of plasmid
MGC803 cell line (Human GC cell line) and THP-1 cell line (Human monocyte-macrophage cell line) were purchased from Yuanchuang Cooperation (China), which were cultured using normal medium (RPMI-1640 with 10% fetal bovine serum and 1% Penicillin/Streptomycin).
The plasmid overexpresses AKR1B1 was constructed by Genomeditech Cooperation (Shanghai, China). The transfection of AKR1B1-overexpressed and control plasmids to THP-1 cells was performed using Hieff Trans Suspension Cell-Free Liposomal Reagent (Yeasen Cooperation, China) according to the manufacturer's instructions.
In vitro co-culture experimental design
After transfection with AKR1B1 overexpressed and control plasmids, THP-1 cells were induced to differentiate into macrophages by co-culturing with 10 ng/mL PMA for 48 h (Sigma-Aldrich). Then the medium was collected for further use. THP-1 cells were then lysed for isolating total RNA using an RNA extraction kit (Yishan, China). Then complementary DNA was synthesized by HiScript III RT SuperMix (Vazyme, China). And mRNA levels of TNFα, IL1β, IL4, IL10, TGFβ, and GAPDH were assessed by real-time PCR using Taq Pro Universal SYBR qPCR Master Mix (Vazyme, China). Primers used in this research are listed in Supplementary Table S1.
The collected THP-1 cell medium was mixed with normal medium at a ratio of 1:2 as conditioned medium (CM) to culture MGC803 cell line as a co-culture system. Then cell viability of MGC803 cells was measured by CCK-8 (Dojindo, Japan) following the manufacturer's instructions. In addition, the cell migration ability of MGC803 cells was evaluated by scratch wound assay and transwell migration assay, as previously described (Chen et al., 2016; Wang et al., 2018).
Statistical analysis
Data are expressed as mean ± standard deviation. Two groups were compared by Student's t test and multiple groups were compared by one-way analysis of variance (ANOVA) using GraphPad prism software. Differences were considered significant at p < 0.05.
Results
Identification of modules by WGCNA
Clustered gene modules were constructed using the data from TCGA-STAD and GSE62254 cohort (Fig. 1A, B). Then the association between modules and ESTIMATE scores measured by Spearman correlation analysis was shown by heat maps (Fig. 1C, E). For GSE62254 cohort, 24 co-expression modules were constructed (Fig. 1C). Notably, greenyellow module had the highest positive association with StromalScore (Cor = 0.77, p = 2e-59), ImmuneScore (Cor = 0.92, p = 2e-126), and ESTIMATE Score (Cor = 0.98, p < 2e-200), as well as negative relationship with Tumor Purity (Cor = −0.91, p = 2e-118) (Fig. 1C, D).
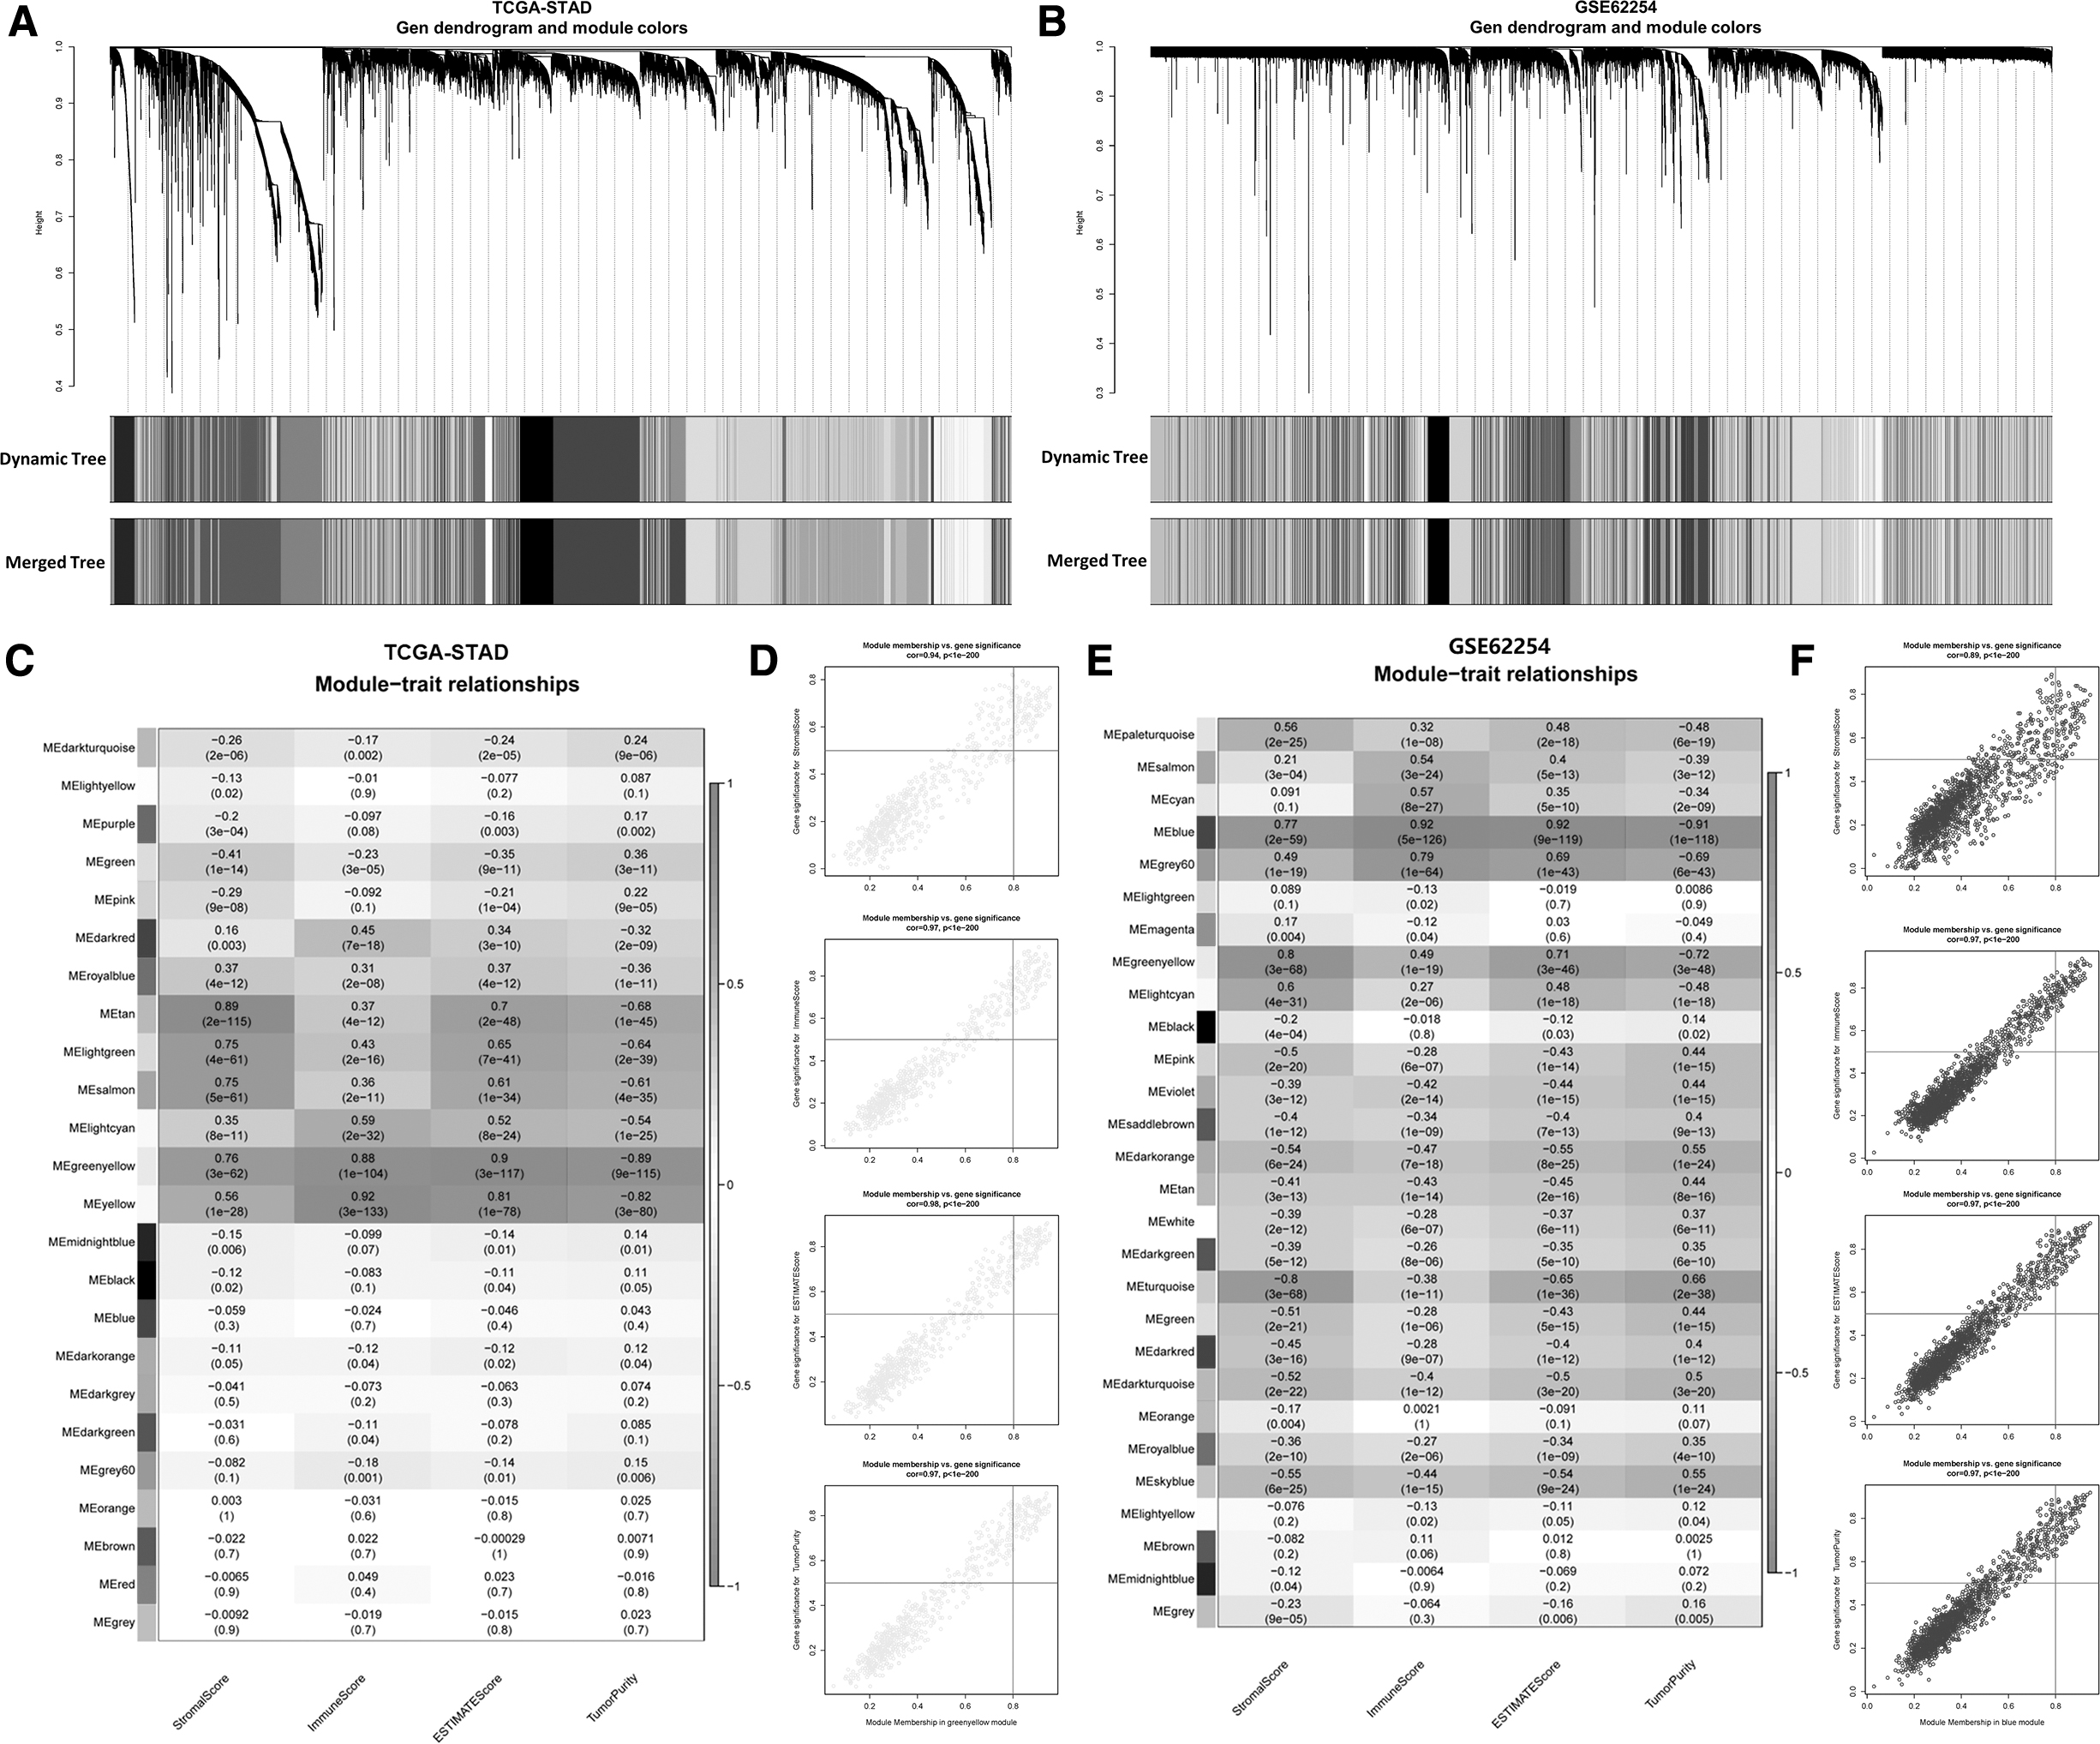
Identification of modules correlated with the immune infiltration of GC.
For GSE62254 cohort, 28 co-expression modules were clustered, with the blue module having the strongest correlation with StromalScore (Cor = 0.77, p = 2e-59), ImmuneScore (Cor = 0.92, p = 2e-126), ESTIMATE Score (Cor = 0.92, p = 2e-119), and Tumor Purity (Cor = −0.91 p = 2e-118) (Fig. 1C, D). Therefore, 662 genes in the greenyellow module and 1745 genes in the blue module were screened as potential immune infiltration-related hub genes for further investigation in this study.
Enrichment analysis of the overlapped genes and identification of hub genes
Genes in the above greenyellow and blue modules were overlapped and screened to 131 potential key genes, which were input for enrichment analysis (Fig. 2A). GO analysis results showed that these genes were enriched into the process of organelle fission, nuclear division, spindle, and condense chromosomal region in terms of Biological Process (BP) and Cellular Component (CC) (Fig. 2B). Tubulin binding, Microtubule binding, Extracellular matrix structural constituent, and Chemokine receptor binding were mainly enriched terms in Molecular Function (MF) (Fig. 2B). In addition, KEGG analysis demonstrated that cell cycle, cytokine-cytokine receptor interaction, cellular senescence, oocyte meiosis, and chemokine signaling pathway were main processes related to overlapped genes (Fig. 2C).
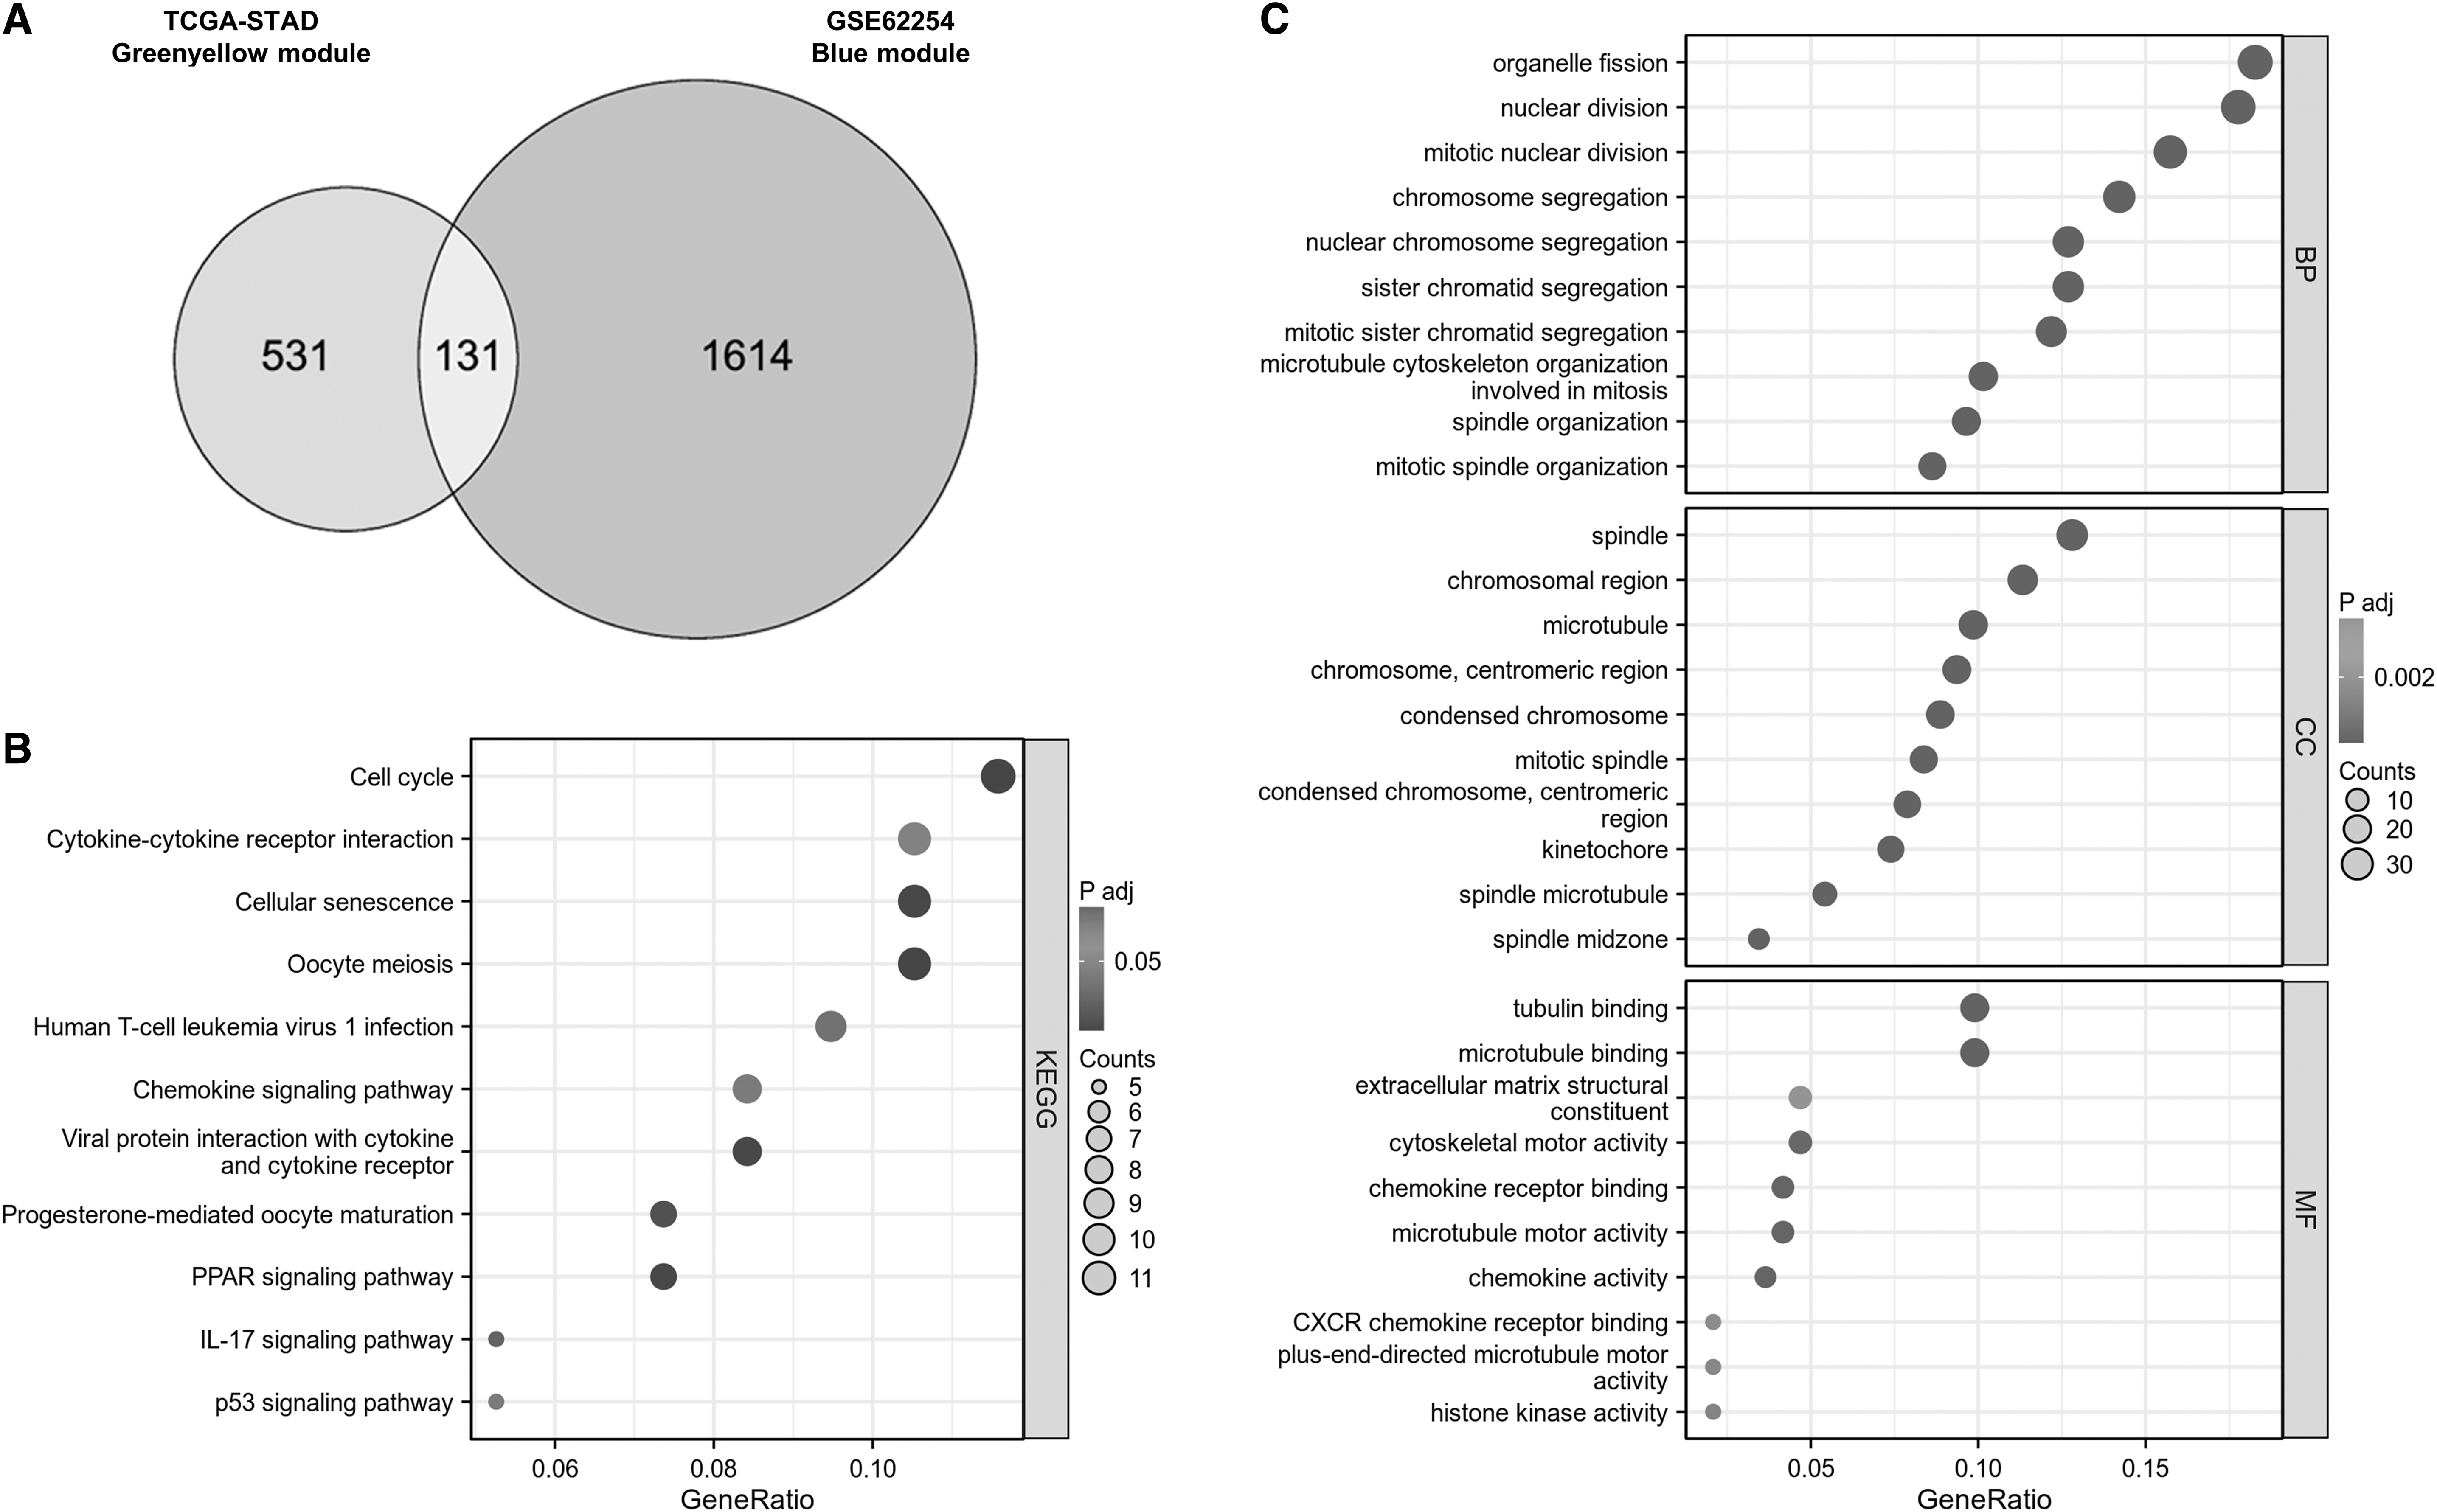
Functional analyses of the ESTIMATE-based signature.
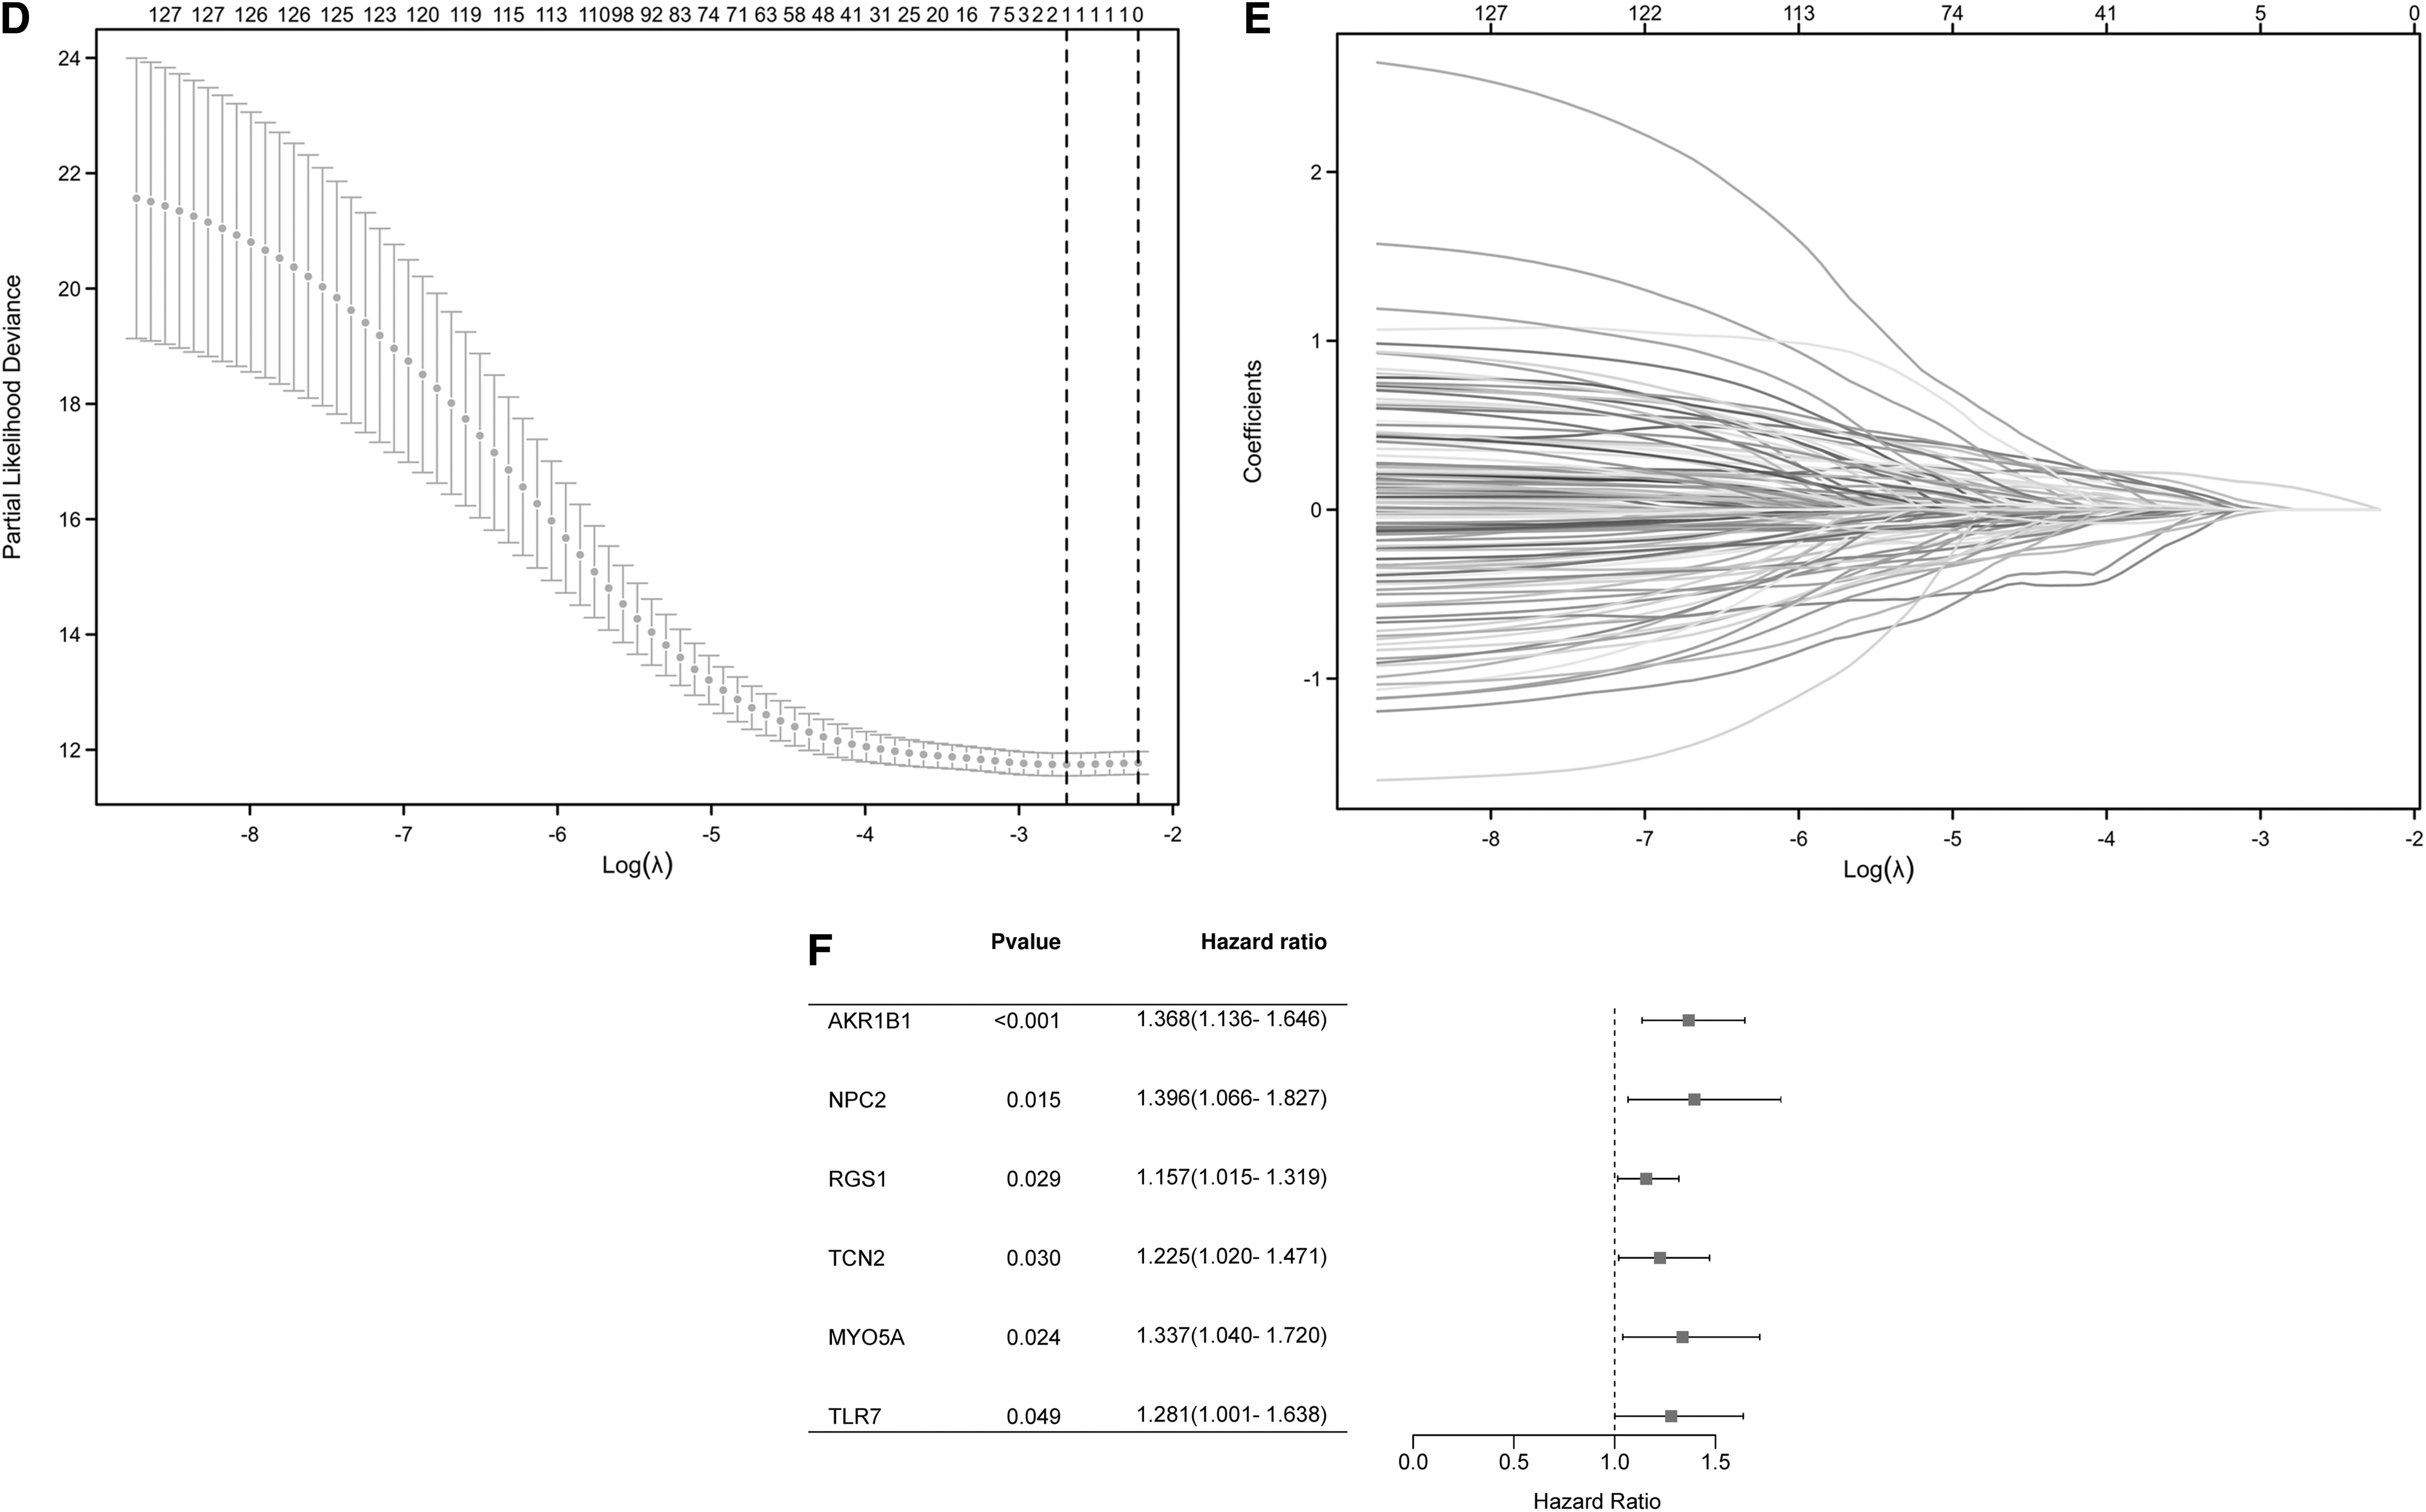
These 131 genes were further subjected to LASSO regression model using the data from TCGA-STAD cohort to determine the minimum l value (Fig. 2D, E). Then these genes were analyzed by Univariate Cox regression analysis model with OS from TCGA-STAD cohort as dependent variables. The results are shown in Supplementary Figure S1 and genes with p < 0.05 were listed in Figure 2F. Notably, AKR1B1 is the only gene with p < 0.001 in Univariate Cox regression analysis; thus, it was identified as a hub gene for immune infiltration of GC.
Functional annotation of AKR1B1-associated DEGs in GC
To determine AKR1B1-associated signaling pathways, TCGA-STAD datasets were divided into high and low AKR1B1 expression groups based on AKR1B1 median expression. DEGs were identified with the cutoff value of log2FC >1, adj.p < 0.05 (Fig. 3A). As shown in Figure 3B, the most significant terms of BP, CC, MF, and KEGG were humoral immune response, intermediate filament, receptor ligand activity, and cytokine-cytokine receptor interaction, respectively. To find GO or KEGG terms having related DEGs, a network was drawn, in which significant terms were Treg proliferation, leukocyte cell-cell adhesion, lysosomal lumen, vacuolar lumen, coreceptor activity, and immune network for lgA production (Fig. 3C).
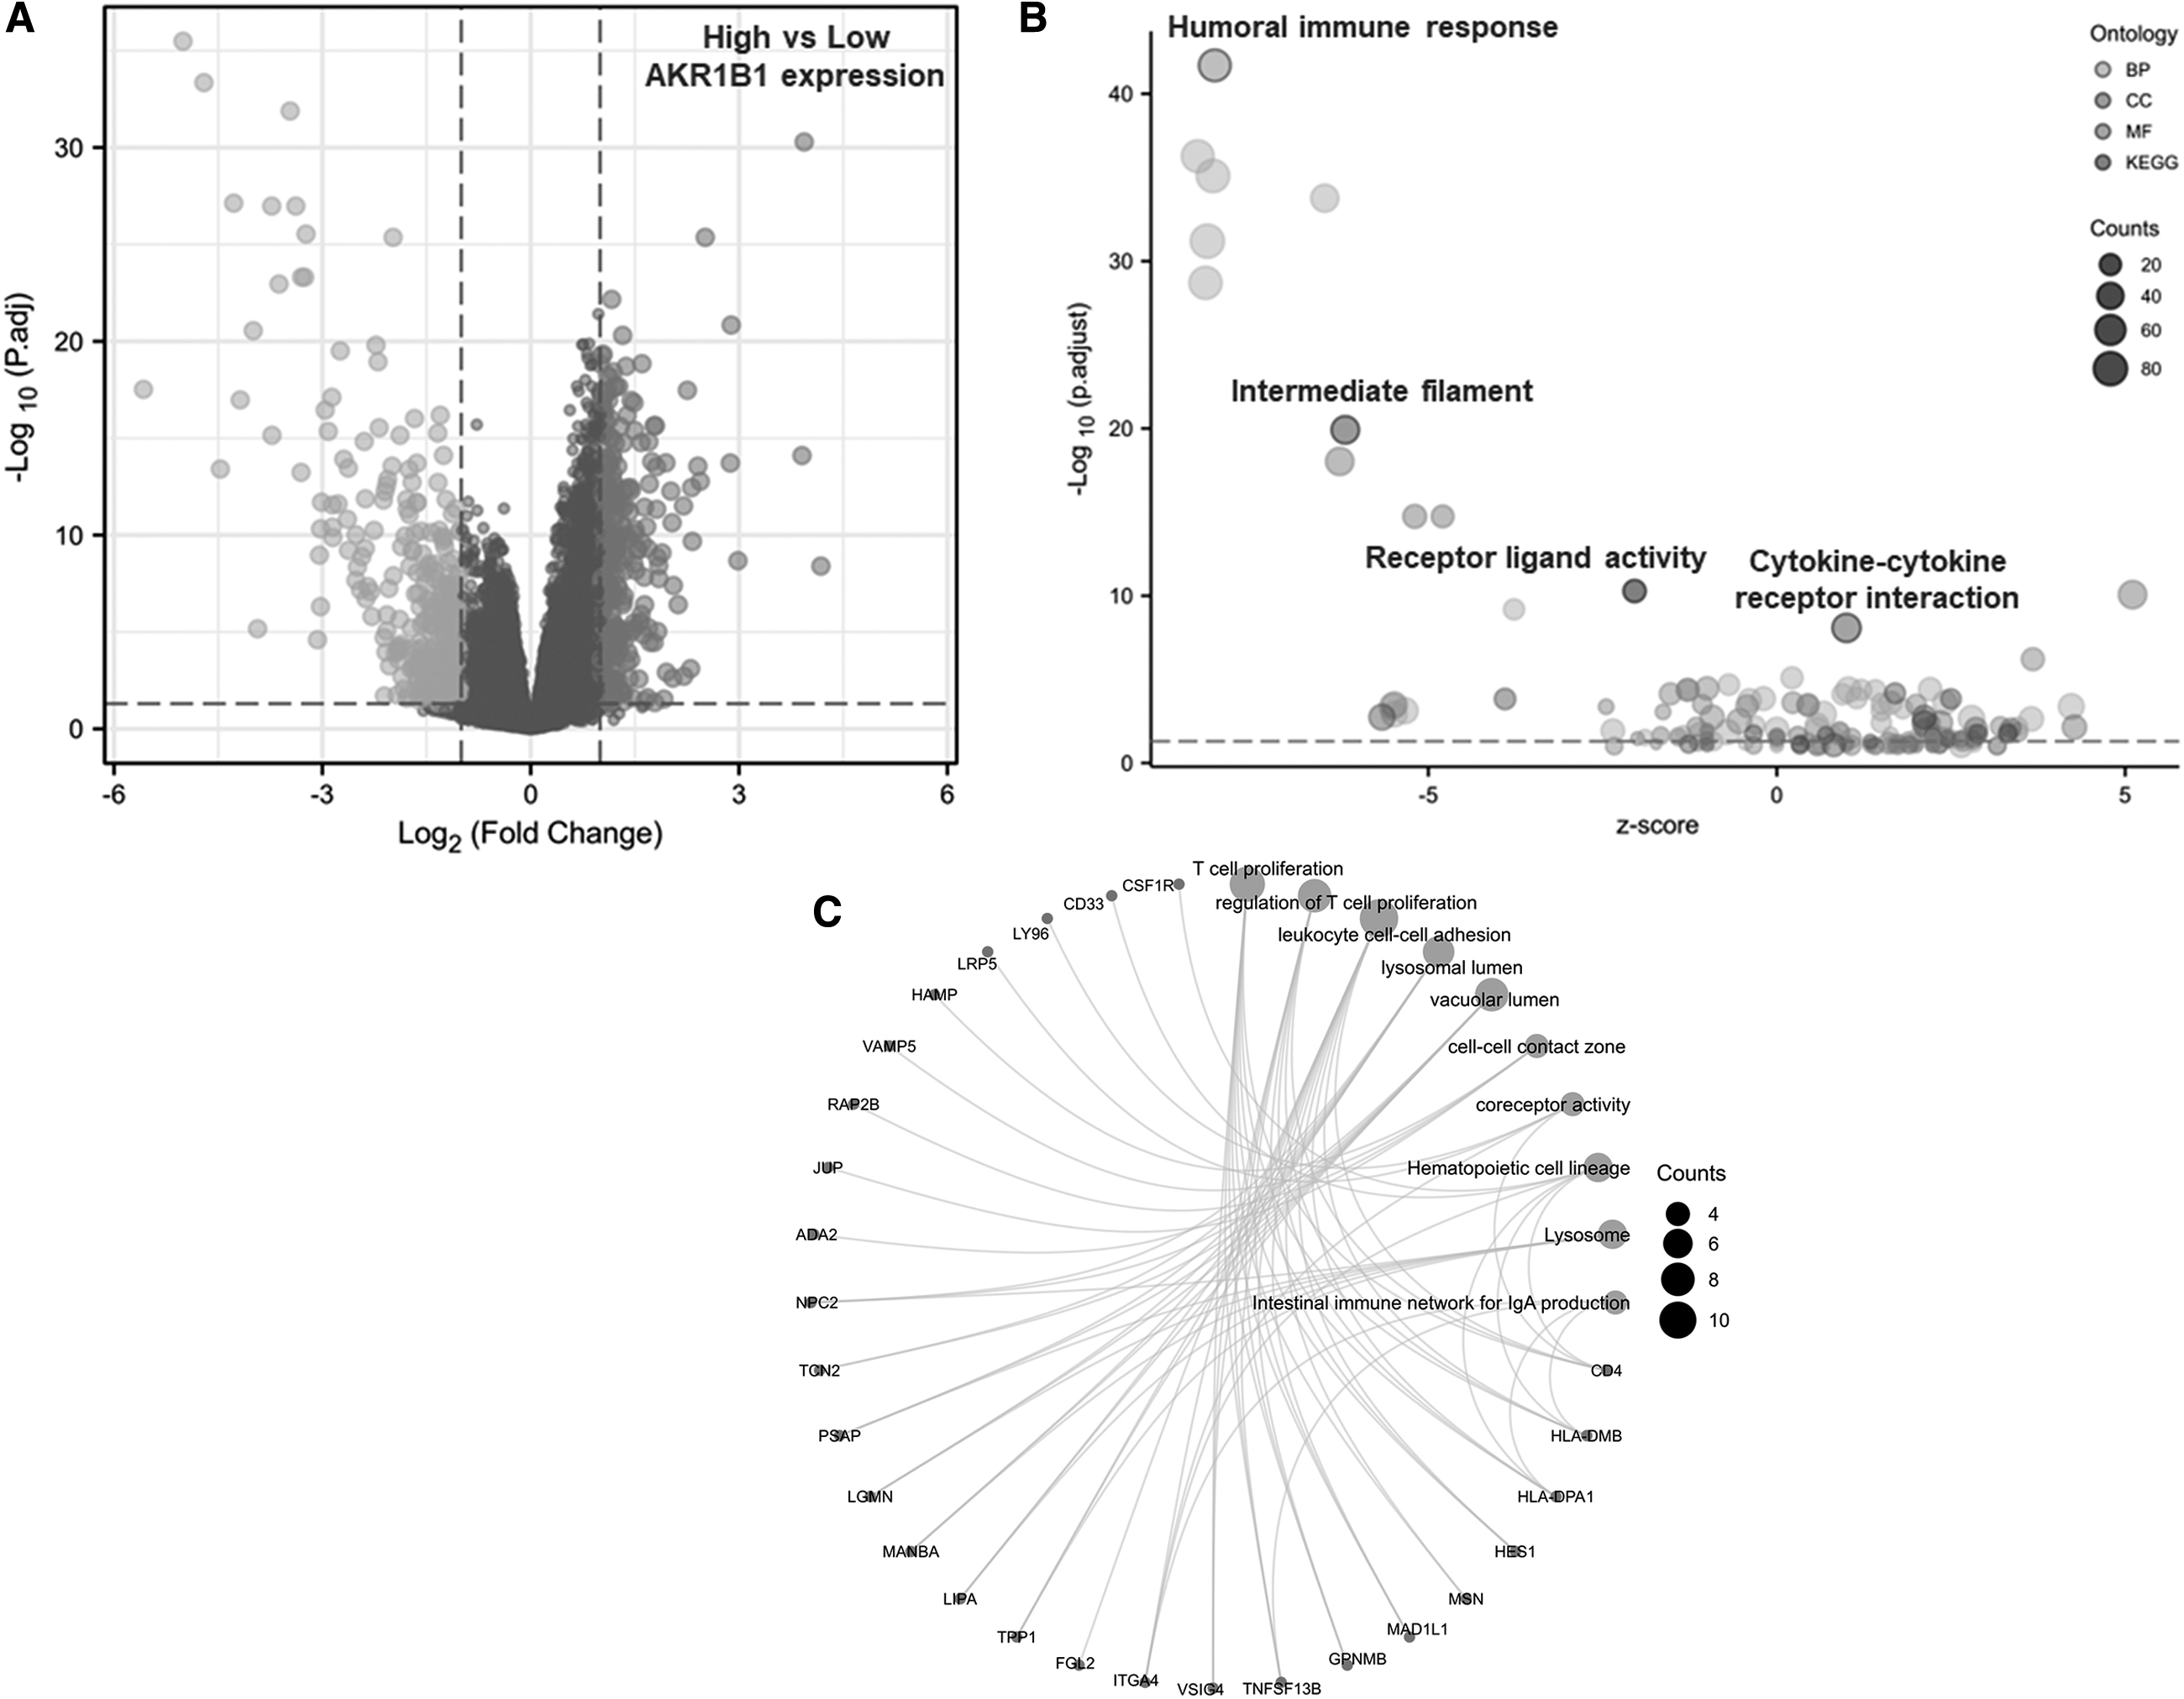
Functional annotation of DEGs in GC patients with distinct AKR1B1 levels.

We then performed GSEA analyses and representative significant terms are listed in Figure 4D. Signaling pathways, including Onder CDH1 Targets 2, Jaeger metastasis, Rickman tumor differentiation well versus poorly, and Lin silenced by tumor microenvironment, were remarkably downregulated in high AKR1B1 expression group (Fig. 3D).

Correlation of immune cell infiltration and AKR1B1 expression in patients with GC.
Association of AKR1B1 and immune cell infiltration in GC
To investigate the association between AKR1B1 and immune cell infiltration, ssGSEA method was adopted to reveal the proportion of immune cells in TCGA-STAD datasets according to high and low AKR1B1 expression groups. High AKR1B1 expression was positively associated with the accumulation of immature dendritic cells (iDC), macrophages, DC, T helper 1 (Th1) cells, mast cells, T follicular helper cells, T cells, eosinophils, activated dendritic cells, T effector memory; B cells, regulatory T cells (Treg), CD8 T cells, cytotoxic cells, natural killer (NK) cells, neutrophils, T gamma delta, plasmacytoid dendritic cells, and NK CD56 dim cells, but negatively with NK CD56 bright cells (Fig. 4A, B).
No significant correlationship was found between AKR1B1 expression and Th17 cells, Th2 cells, and T central memory cells (Fig. 4A). Then we also used CIBERSORT algorithm to assess immune cell infiltration and similar results were obtained (Fig. 5A, B). Finally, we investigated the relationship between PDCD-1/CTLA4 and AKR1B1 expression by Pearson correlation analysis and found that PDCD-1 (r = 0.267, p < 0.001) and CTLA4 (r = 0.226, p < 0.001) were positively associated with AKR1B1 (Fig. 5C, D). Taken above, these results demonstrated that AKR1B1 was related to increased immune infiltration and immunosuppressive effects in GC.
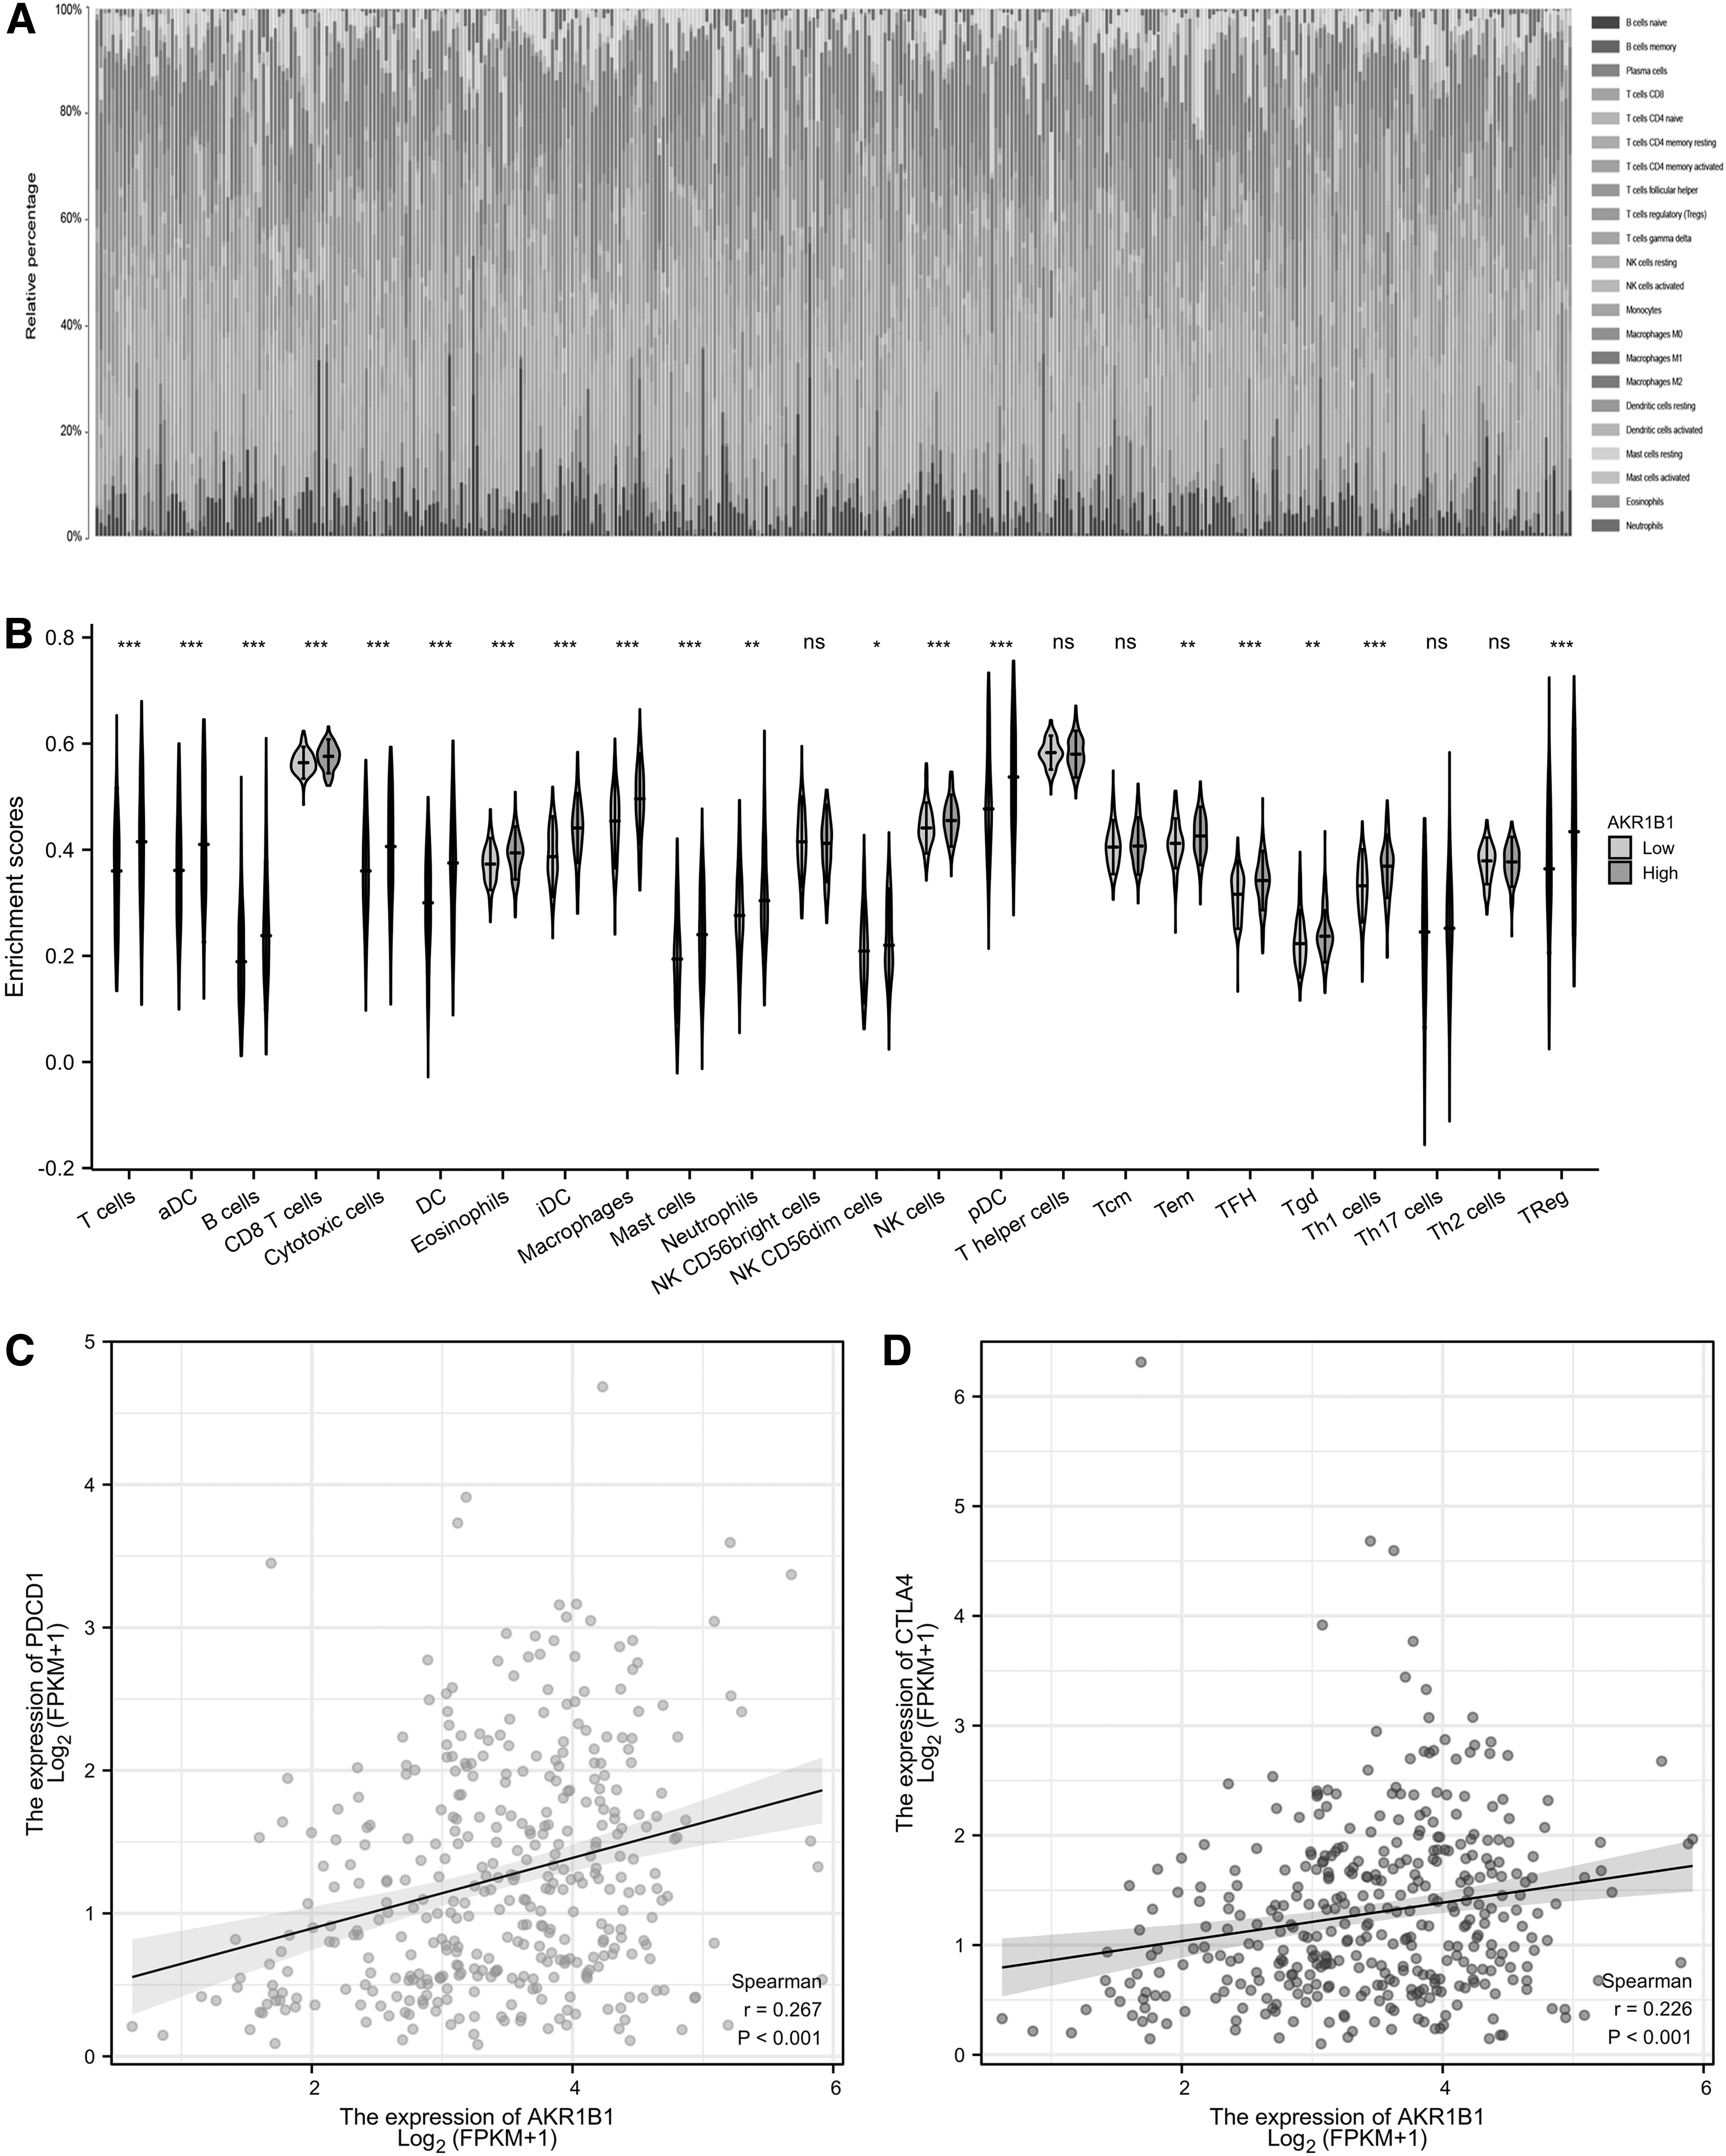
Immune cell landscape in TCGA-ESCC cohort with high and low AKR1B1 expression.
Association of AKR1B1 expression and clinicopathological characteristics in patients with GC
We explored the clinicopathological characteristics of GC patients with distinct AKR1B1 expression, as shown in Table 1. Compared to low AKR1B1 expression patients, individuals with high AKR1B1 expression had more severe T stages and worse histological grade. However, no significant difference was observed in gender, age, N stage, M stage, pathologic stage, and primary therapy outcome (Table 1). We also performed logistics analysis to investigate the correlation between AKR1B1 expression and clinicopathological characteristics (Table 2). Similarly, T stage and histological grade were positively associated with AKR1B1 levels (Table 2).
Clinicopathological Characteristics of Stomach Adenocarcinoma Patients with Different Aldo-Keto Reductase Family 1 Member B Expression
All significant factors with their p values are shown in bold. * p < 0.05, *** p < 0.001.
AKR1B1, Aldo-Keto Reductase Family 1 Member B; CR, complete response; PD, progressive disease; PR, partial response; SD, stable disease.
Logistic Regression Analysis of Association Between Clinicopathological Characteristics and Aldo-Keto Reductase Family 1 Member B Expression in Stomach Adenocarcinoma Patients
All significant factors with their p values are shown in bold. ** p < 0.01, *** p < 0.001.
OR, odds ratio.
Predictive value of AKR1B1 for GC prognosis
We utilized Kaplan-Meier and Cox regression analyses to assess the predictive value of AKR1B1 on clinical outcomes. High AKR1B1 expression group was manifested with worse OS [hazard ratio (HR): 1.83, p < 0.001), DSS (HR: 1.61, p = 0.009), and PFI (HR: 1.69, p = 0.014) (Fig. 6A–C). In addition, AKR1B1 expression was an independent risk factor for OS (HR: 2.026, p < 0.001), DSS (HR: 2.170, p < 0.001), and PFI (HR: 1.906, p = 0.002) in multivariate Cox regression (Table 3). Notably, primary therapy outcome was also a risk factor for OS (HR: 4.103, p < 0.001), DSS (HR: 8.446, p < 0.001), and PFI (HR: 7.808, p < 0.001) (Table 3). Besides, age was associated with worse OS, and histologic grade was related to worse OS and PFI (Table 3).
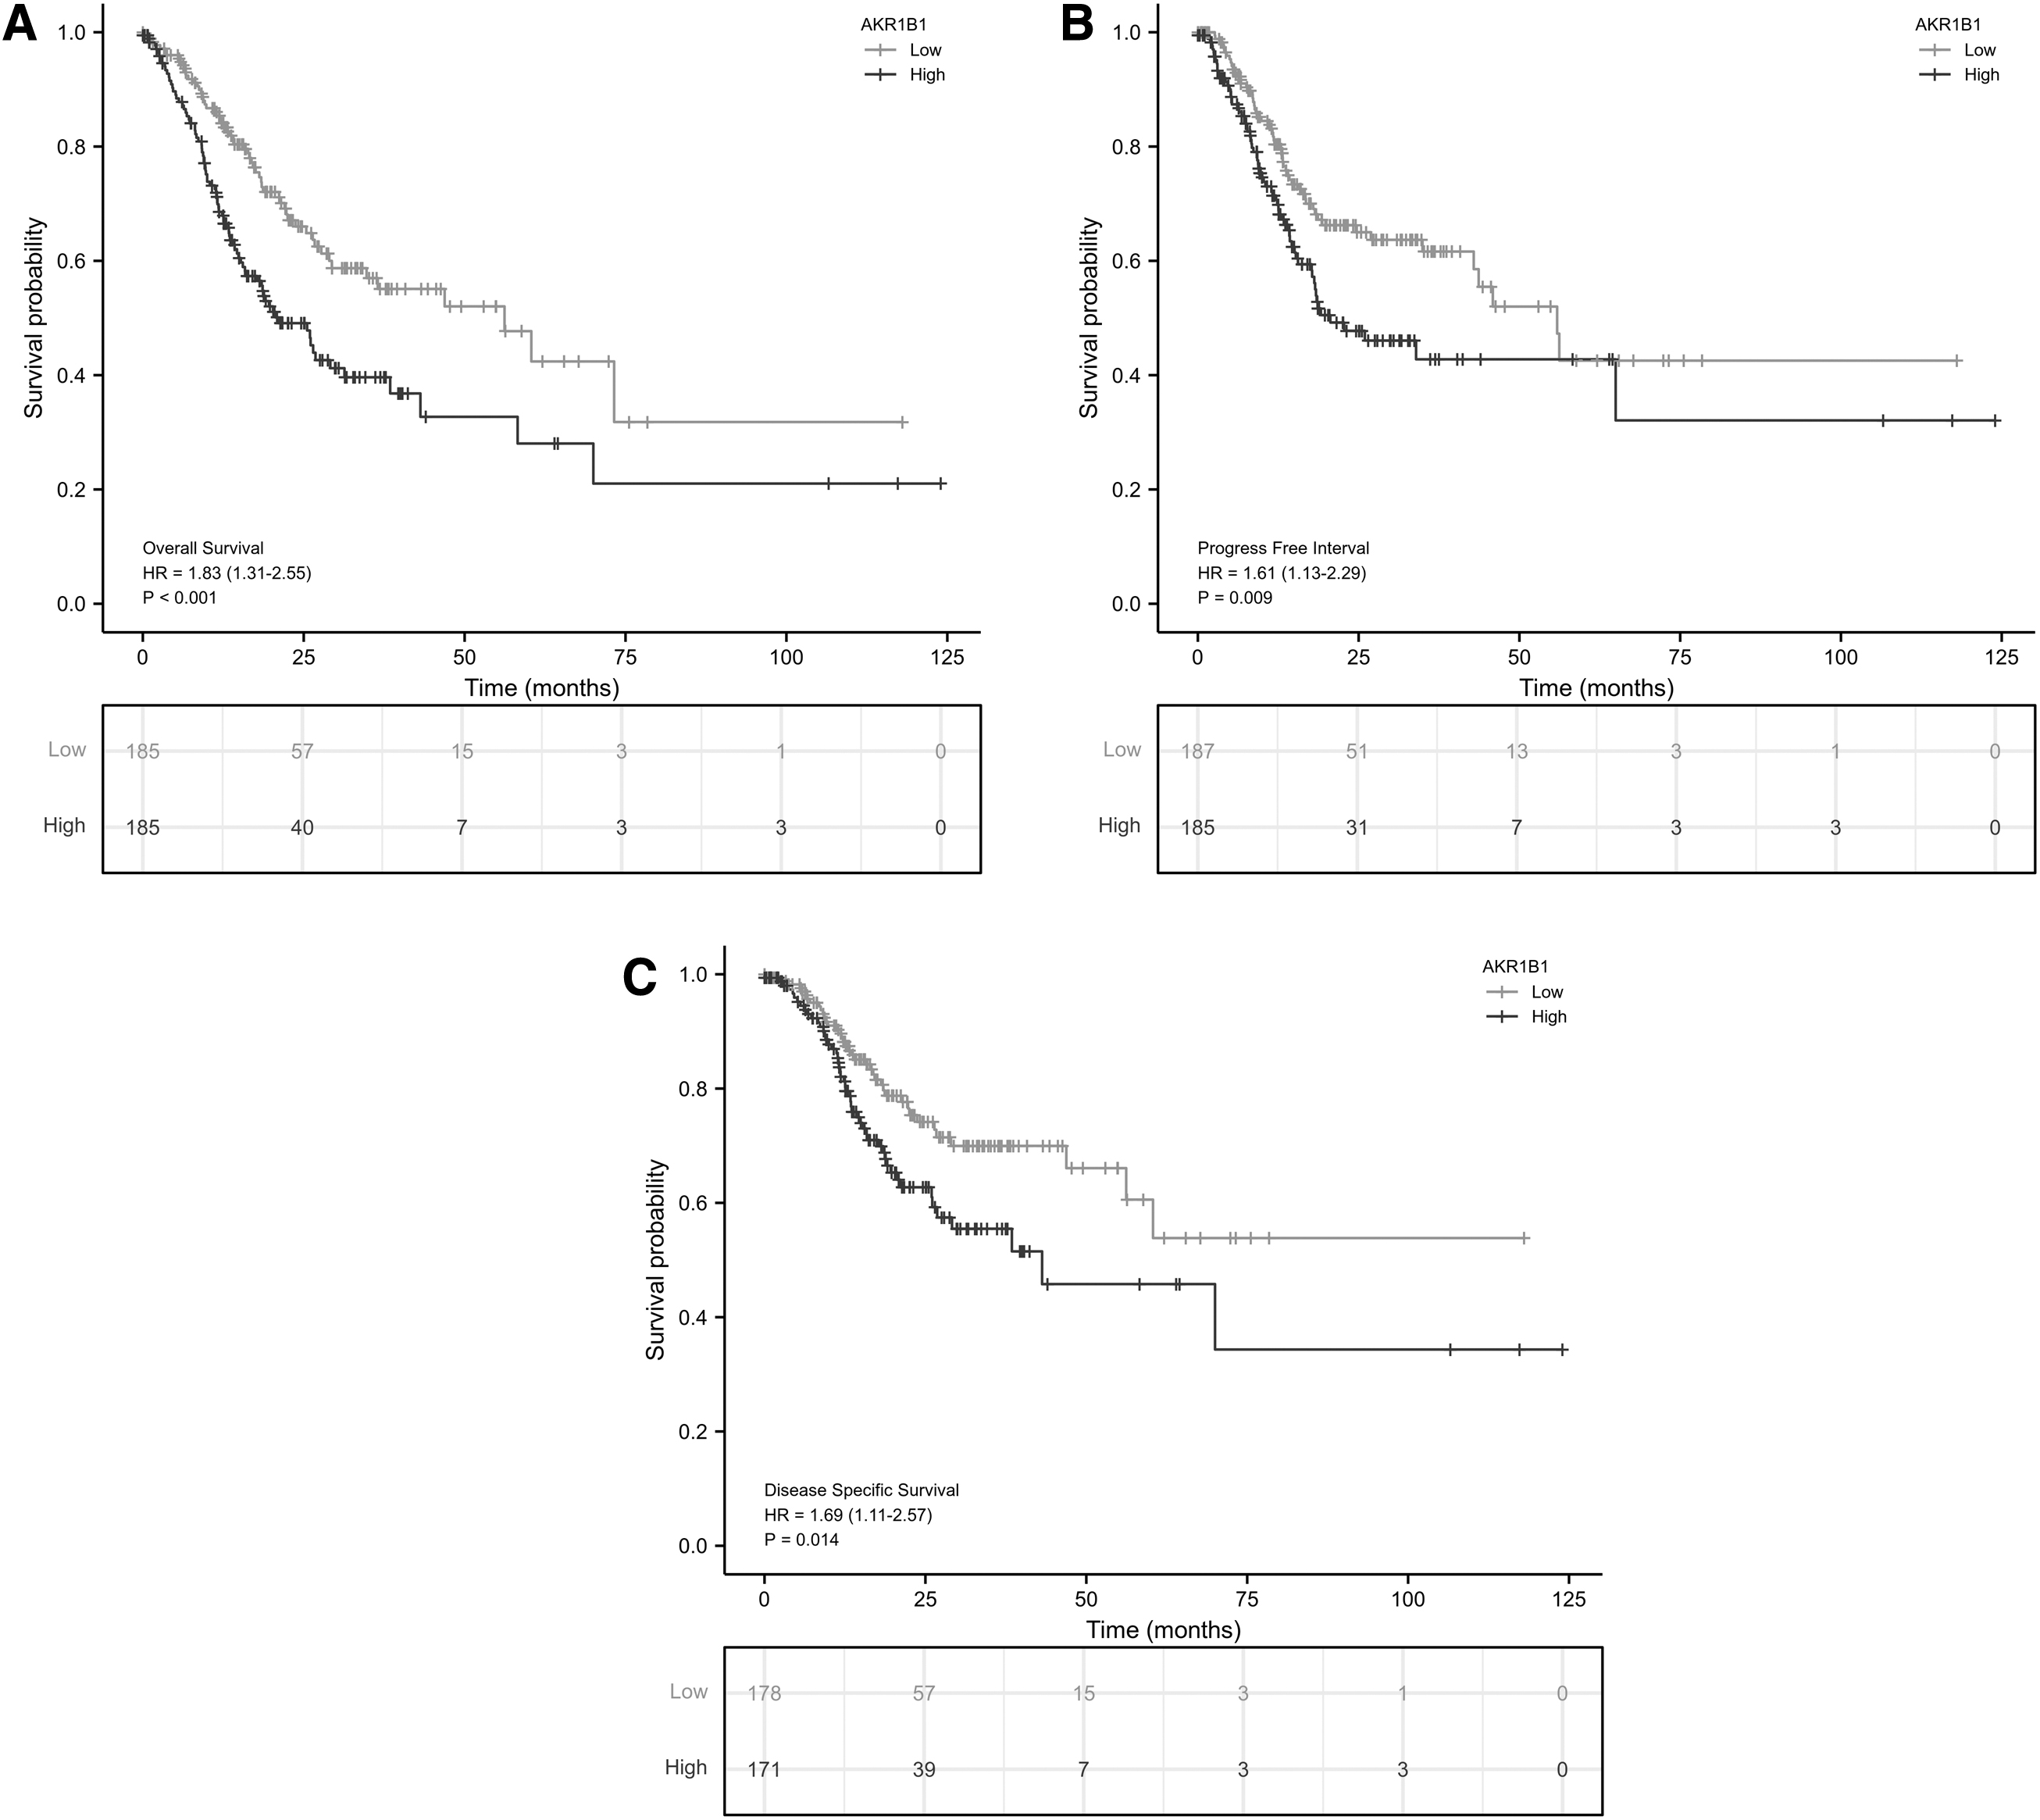
Predictive value of AKR1B1 expression for clinical outcomes in patients with GC. The K-M analyses comparing OS
Cox Regression Analysis for Clinical Outcomes in Stomach Adenocarcinoma Patients
All significant factors with their p values are shown in bold. * p < 0.05, ** p < 0.01, *** p < 0.001.
DSS, disease-specific survival; HR, hazard ratio; OS, overall survival; PFI, progression-free interval.
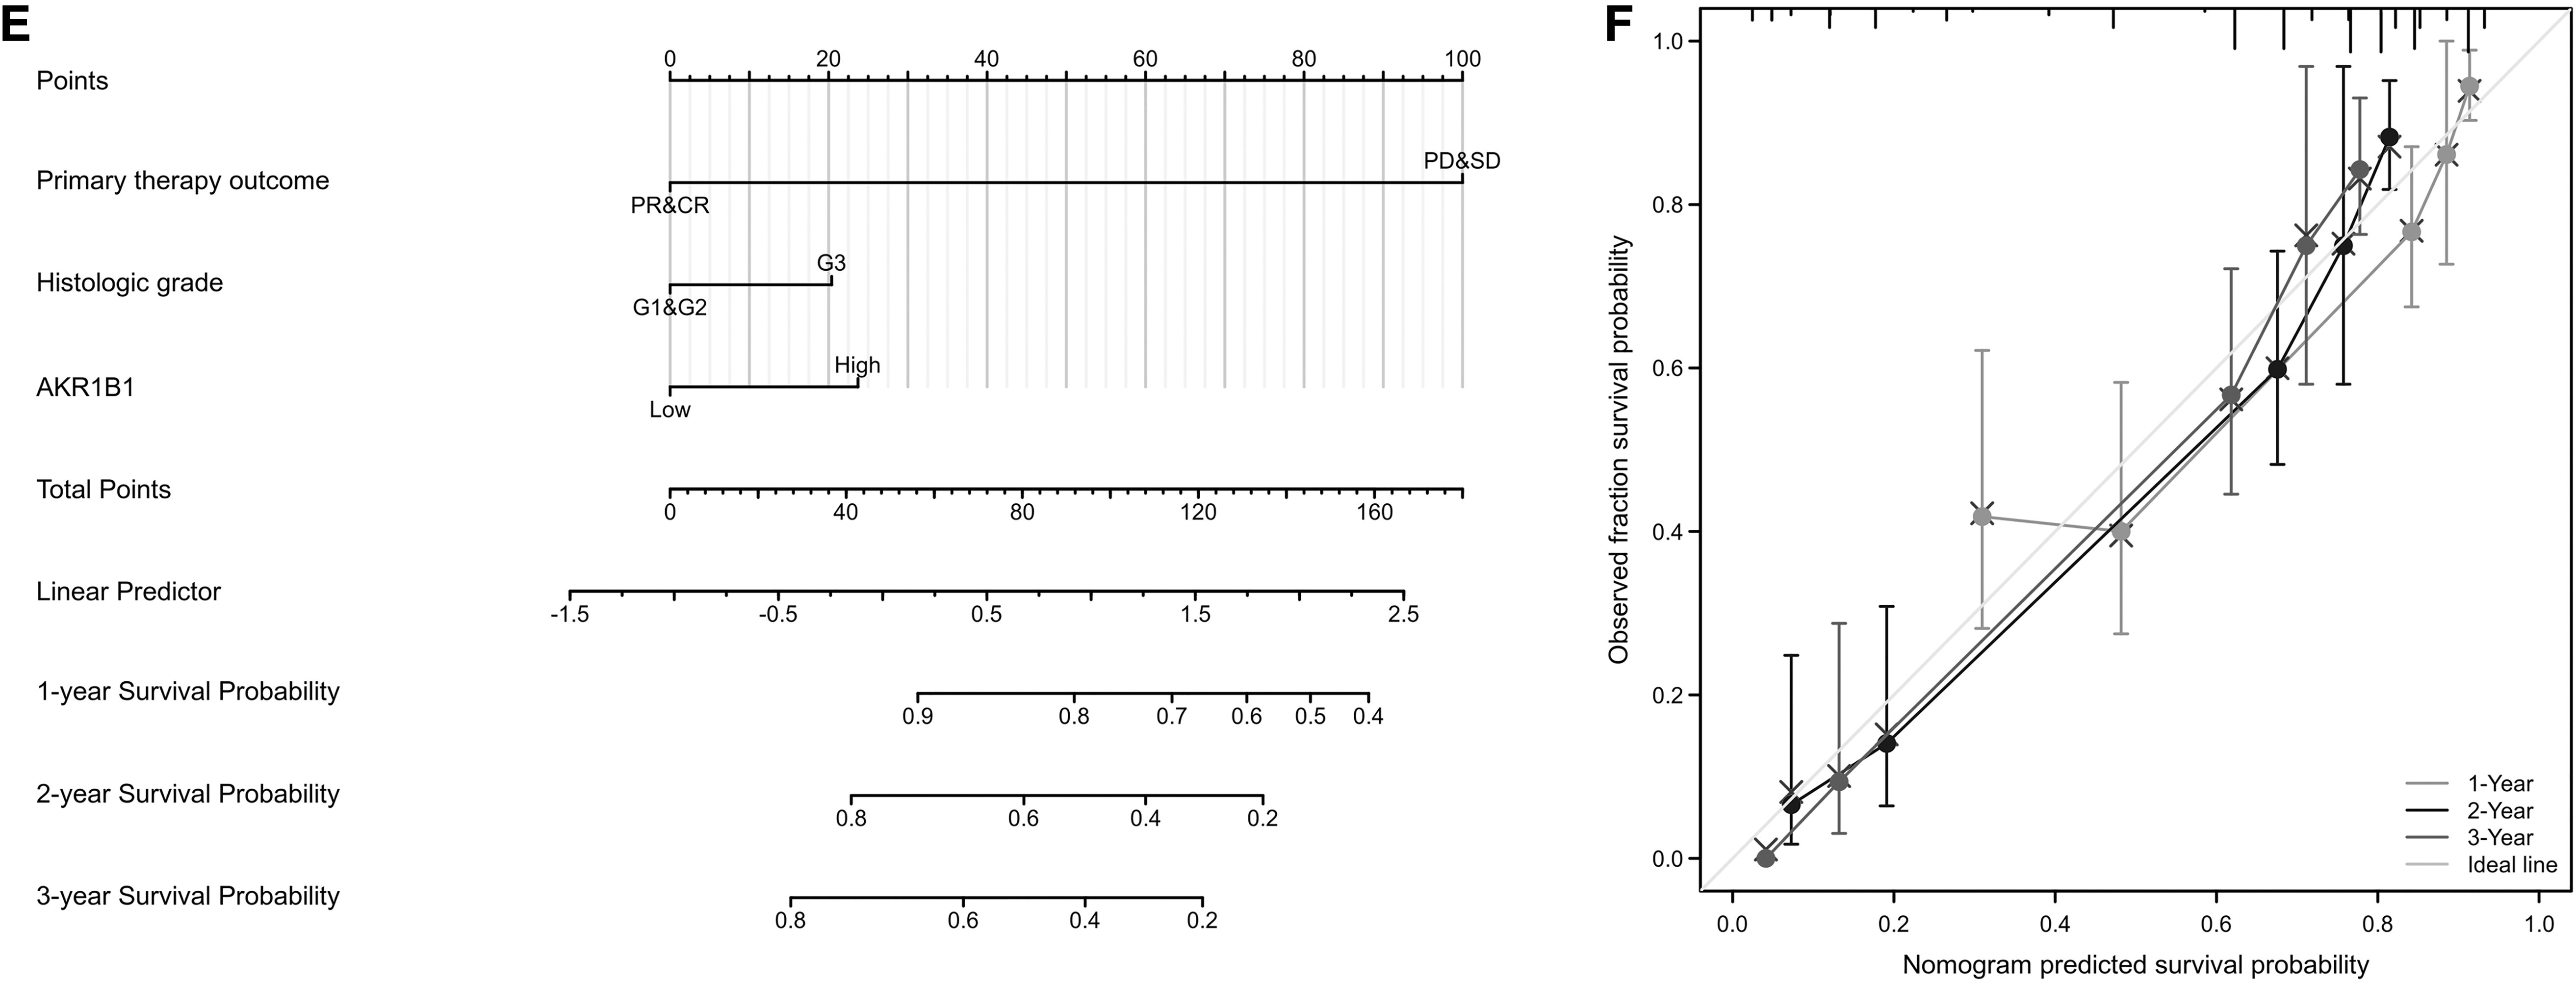
Then prognostic nomograms were established by inputting all significant prognostic factors identified in multivariate Cox analysis, of which efficiency was examined by calibration curve. Age, primary therapy outcome, historical grade, and AKR1B1 expression were included to construct a predictive nomogram for OS with a C-index of 0.710 (Fig. 7A). Primary therapy outcomes and AKR1B1 expression were integrated in a nomogram for DSS (C-index: 0.781) (Fig. 7C). Moreover, primary therapy outcome, historical grade, and AKR1B1 expression were used to establish a predictive nomogram for OS, which had a C-index of 0.767 (Fig. 7E). In accord, the calibration curve of the nomogram of 1-, 2-, and 3-year clinical outcomes manifested satisfied fitting between the predicted and observed values (Fig. 7B, D, F).
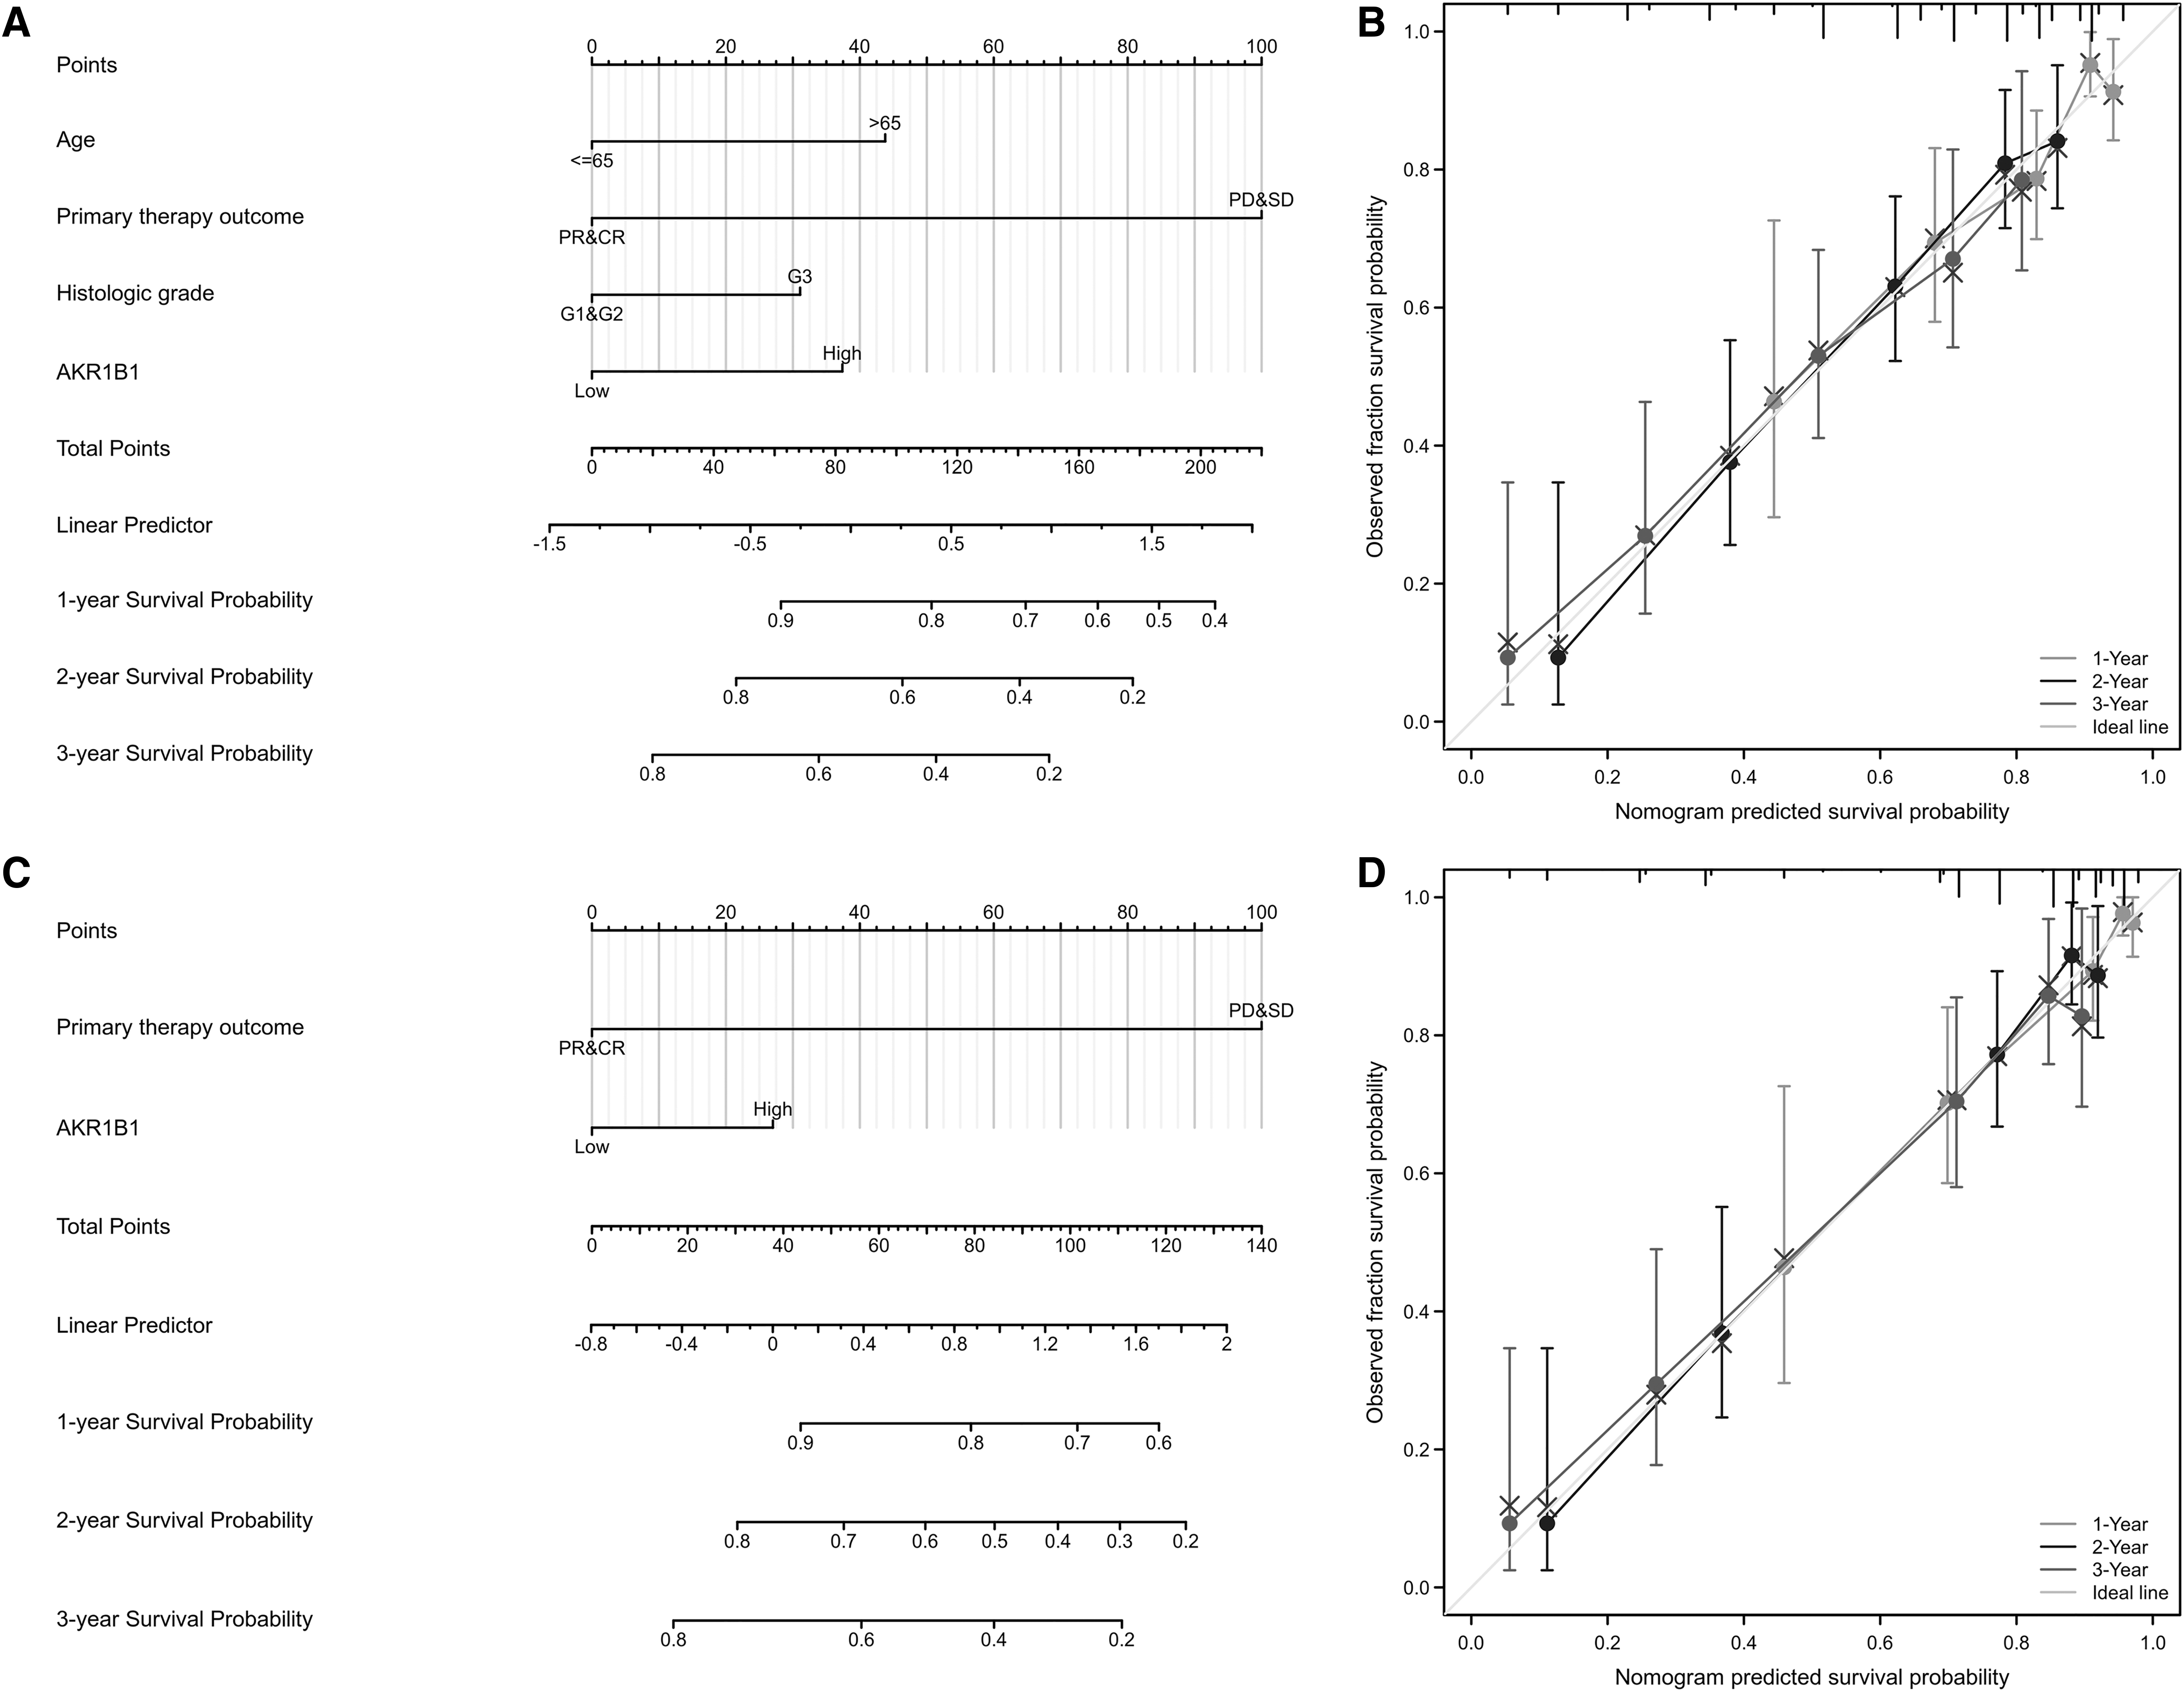
Construction and validation of nomograms based on AKR1B1 expression. Nomograms of AKR1B1 expression-based risk scoring models for 1-, 2-, and 3-year OS
AKR1B1-overexpressed macrophages promote the proliferation and migration of GC cells
To further demonstrate whether AKR1B1 could regulate the interaction between macrophages and GC cells, in vitro co-culture experiments were performed using THP-1 cells (human monocyte-macrophage cell line) and MGC803 cells (human gastric carcinoma cell line). We constructed AKR1B1-overexpressed THP-1-derived macrophages by plasmid transfection (Fig. 8A). Then it was shown that several cytokines, including IL1β, IL4, IL10, and TGFβ, increased after AKR1B1 was overexpressed (Fig. 8B, C).
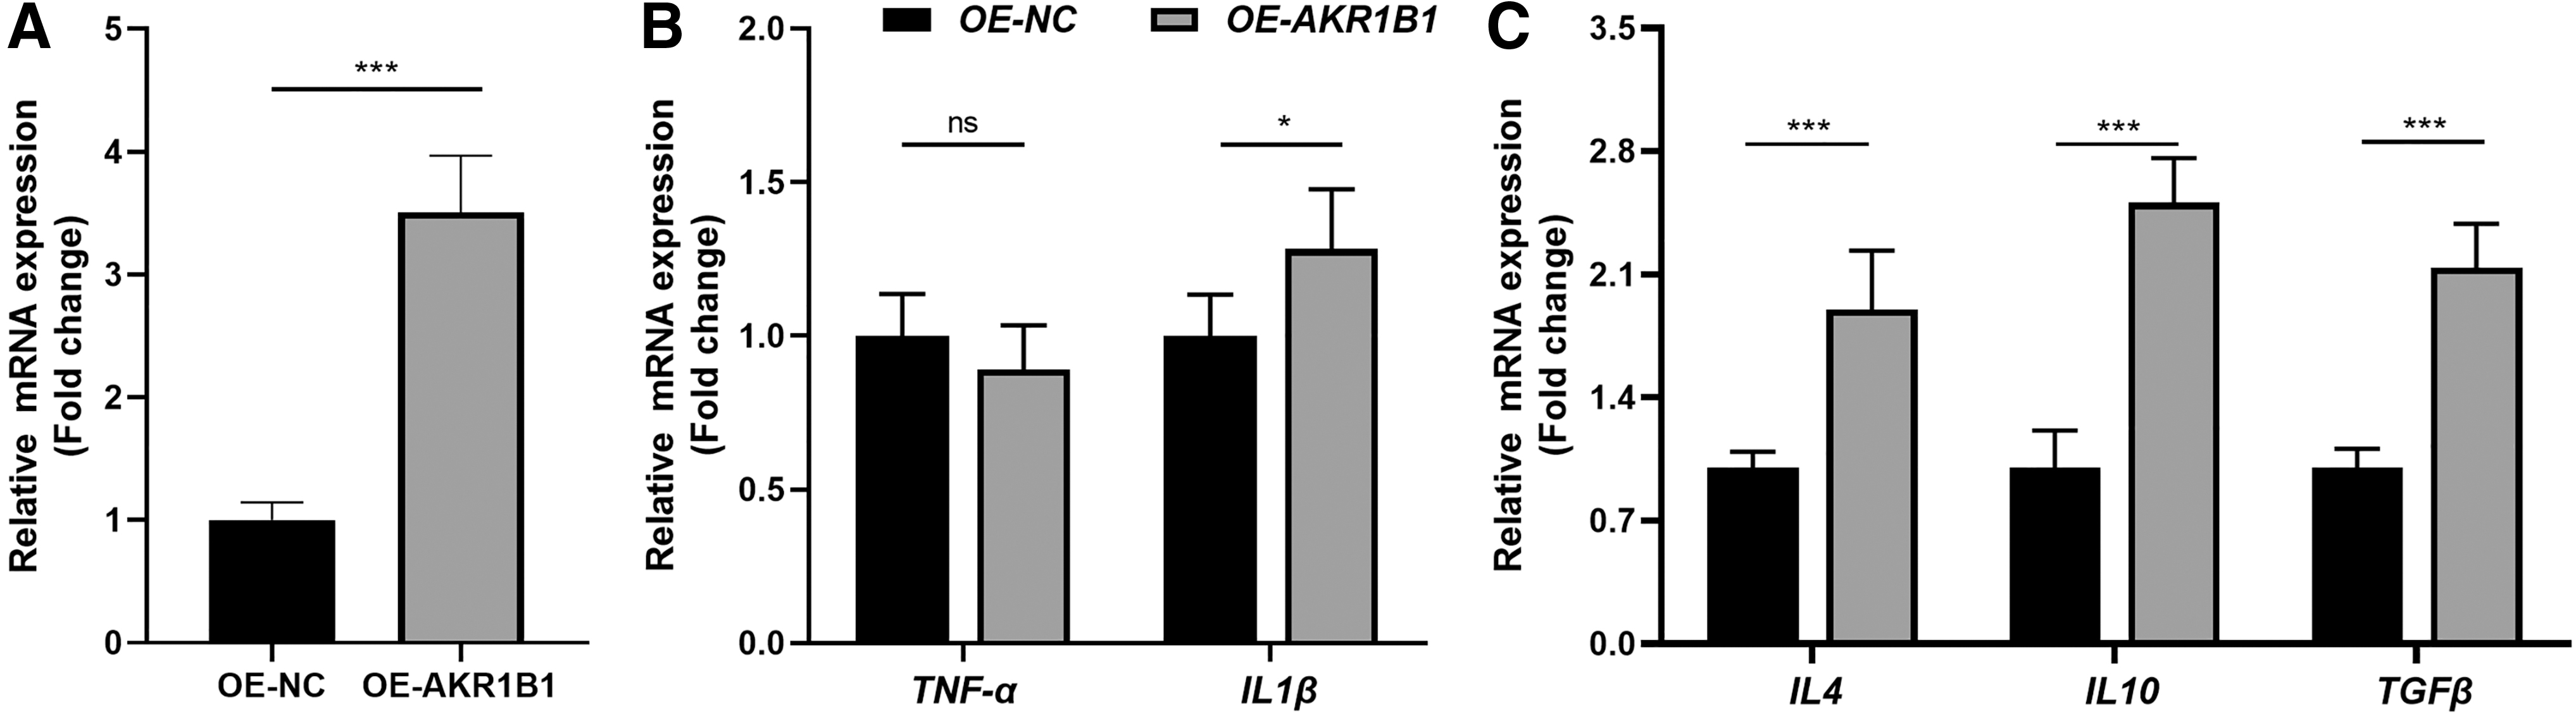
The construction of AKR1B1-overexpressed THP-1-derived macrophages. The mRNA expression levels of AKR1B1
To build a co-culture system, the medium of THP-1-derived macrophages was collected and mixed with normal medium at a ratio of 1:2 as CM to culture MGC803 cells for further experiments (Fig. 9A). CCK-8 assay showed that CM from macrophages with overexpressed AKR1B1 significantly enhances the proliferation of MGC803 cells (Fig. 9B). In addition, as evidenced by the transwell assay and scratch wound assay, AKR1B1-overexpressed macrophages notably promote the migration ability of EPCs (Fig. 9C–F). These experiments indicated that AKR1B1 could regulate macrophage phenotype to impact GC progression.
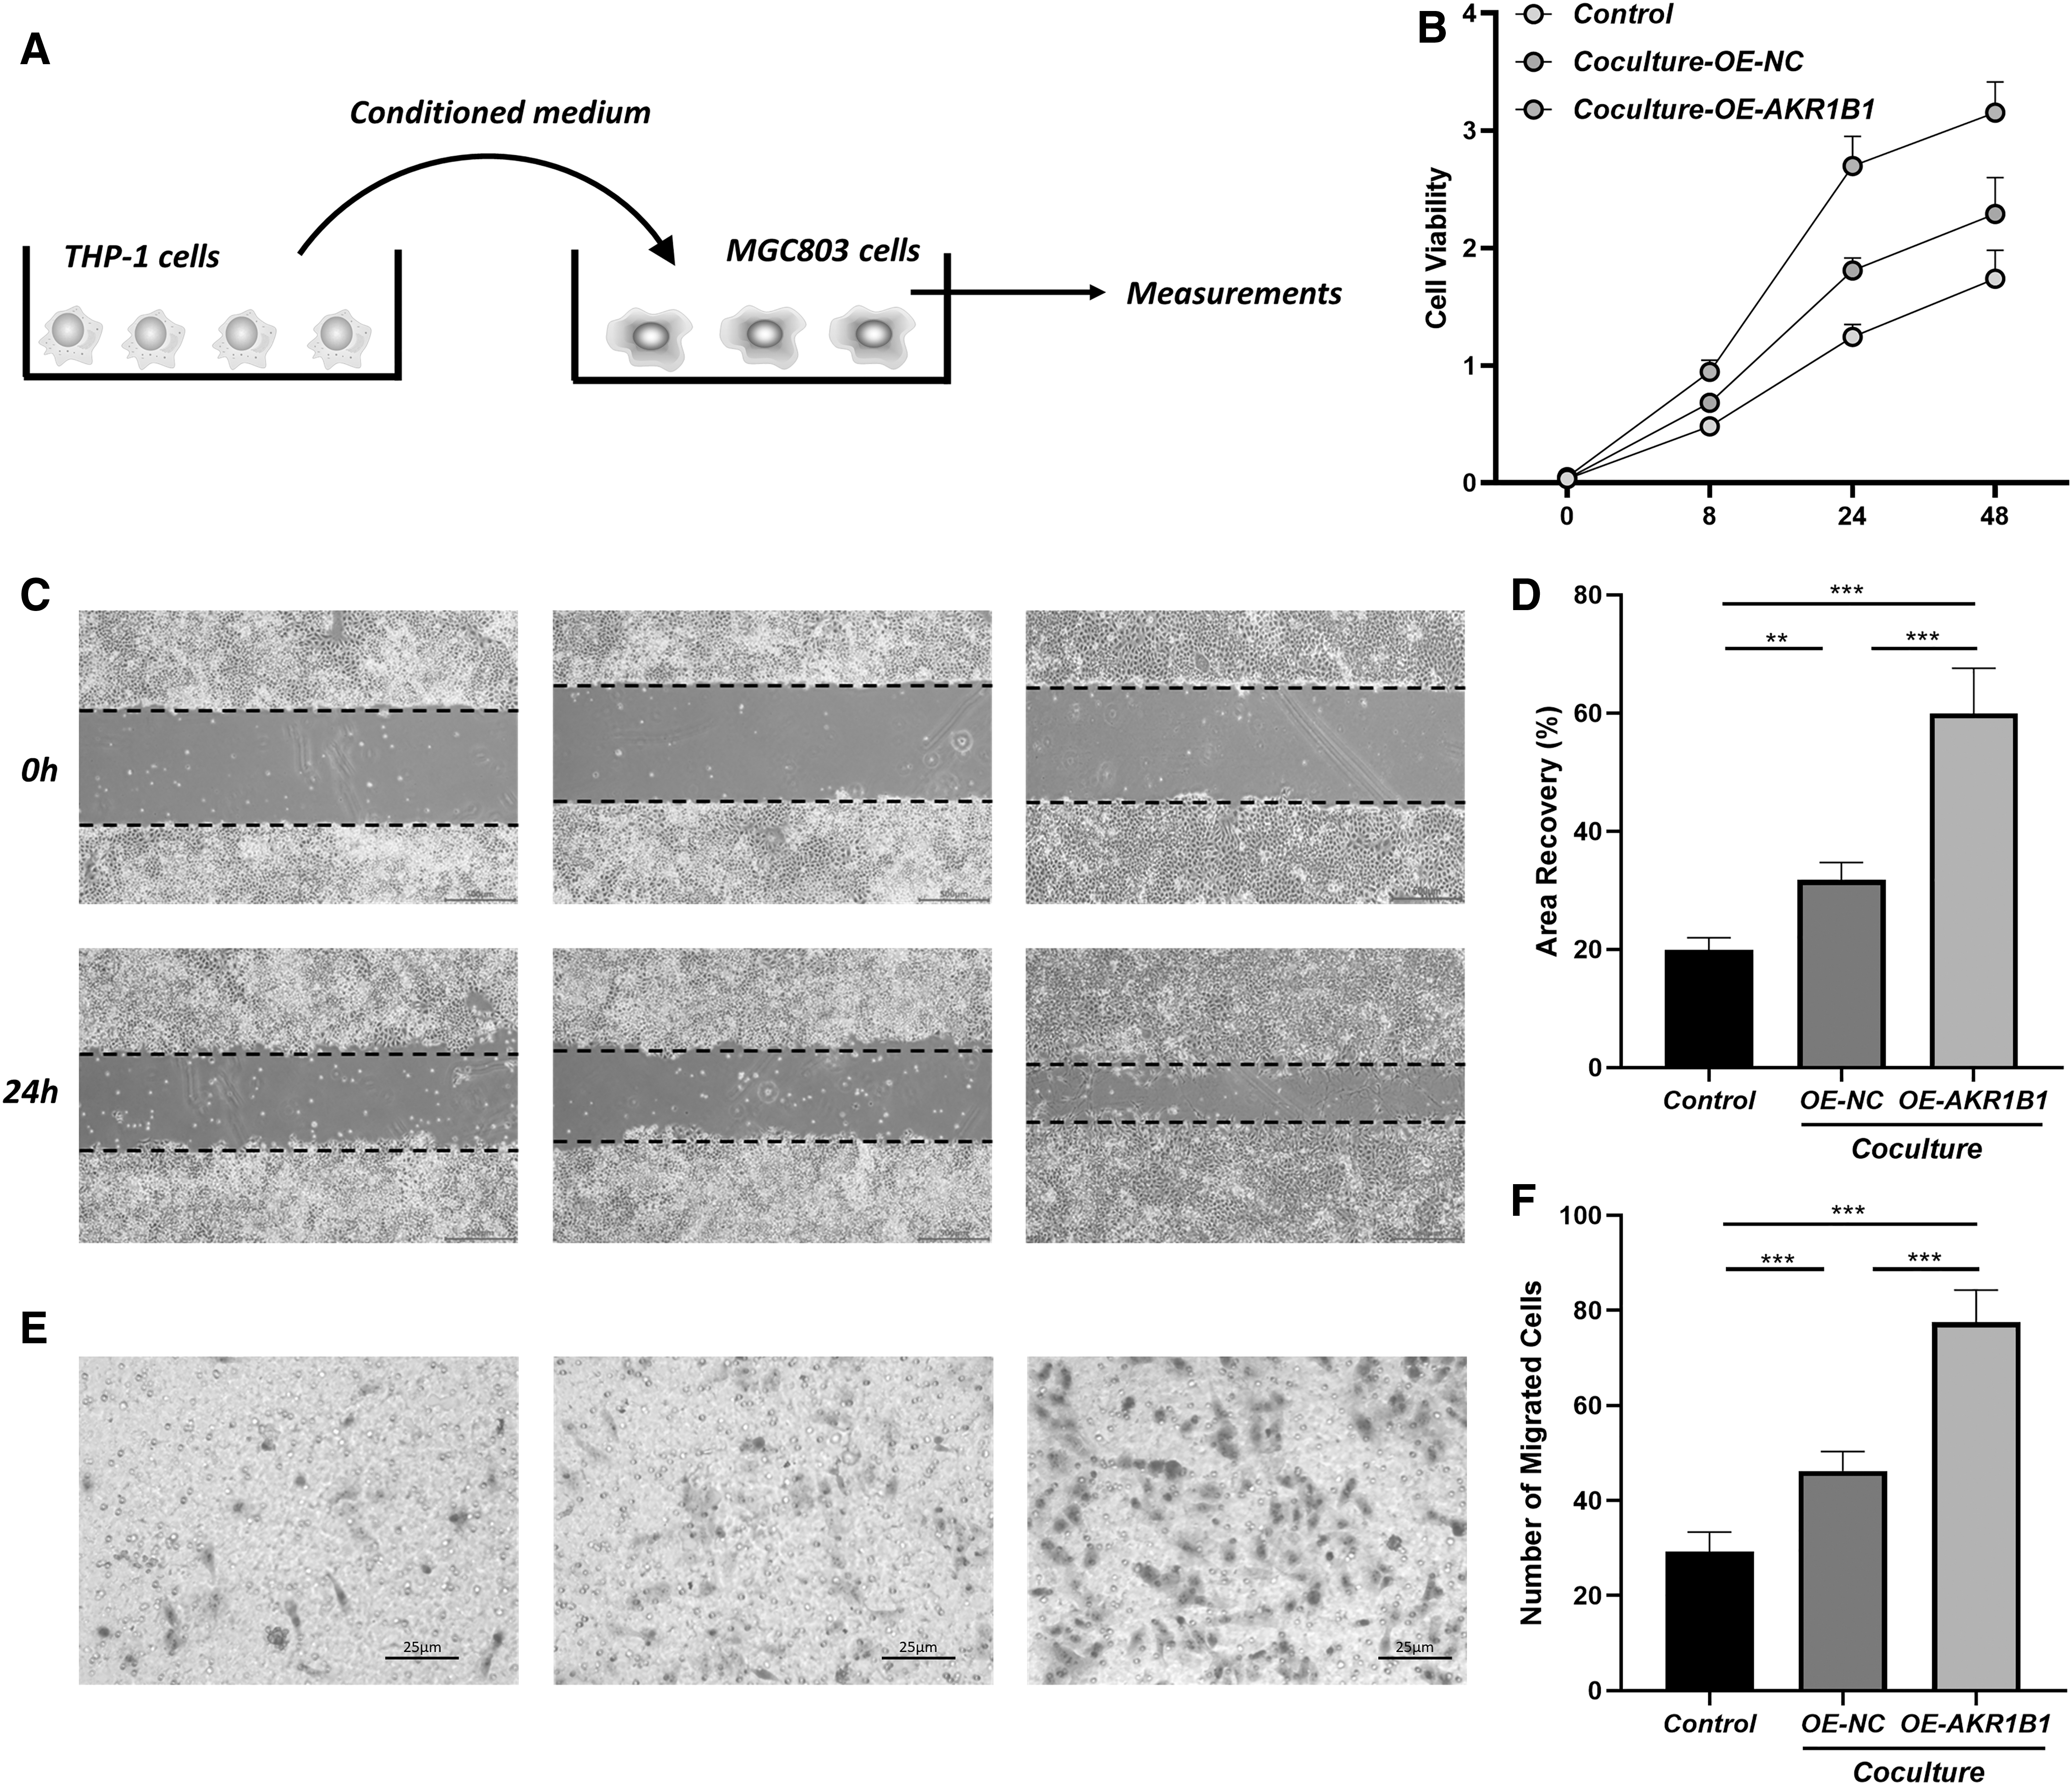
Coculture of THP-1 derived macrophages and MGC803 GC cells.
Discussion
Immune cells are an important part of tumor microenvironment and play a vital role in tumor biology (Barkley et al., 2022). The improper immune infiltration could cause lasted low-grade inflammation and regional immunosuppression (Greten and Grivennikov, 2019). Chronic inflammation caused by H. pylori, gastritis, aging, and unhealthy diet could trigger tissue repair reactions, which produce various cytokines, angiogenic cytokines, and immune regulatory molecules, and then create a microenvironment suitable for GC pathogenesis, progression, and metastasis (Lei et al., 2022; Zavros and Merchant, 2022).
In addition, GC cells express some immune checkpoint molecules, including PDCD1 and CTLA4, which could inhibit cytotoxic CD8+ T cells and promote the differentiation of immunosuppressive Treg and Breg cells (Hamilton et al., 2022). In this study, by analyzing genes enriched in immune infiltration-related WGCNA modules, we reported that these genes were highly associated with cell cycle, chemokine recognition, and cellular senescence. Then LASSO regression model and univariate Cox regression analysis were performed to further identify hub genes with clinical value. It was noticed that AKR1B1 expression was significantly related to survival rate in GC patients.
AKR1B1 is widely expressed in most tissues and regulates energy metabolism in physiological state (Bailly, 2022). However, recent studies have revealed that AKR1B1 is overexpressed in several cancers, including colorectal carcinoma, hepatocellular carcinoma, and lung cancer (Penning, 2015). The elevation of AKR1B1 upregulates the expression of ROS and prostaglandin by activating nuclear factor kappa-light-chain enhancer of activated B cells (NFκB), mammalian target of rapamycin, and protein kinase B, which lead to chronic inflammation and cancer progression (Khayami et al., 2020). In this research, we demonstrated that high AKR1B1 expression group has more immune cell infiltration, especially macrophages and iDCs. GO and KEGG analysis revealed AKR1B1 regulates Treg activity, chemokine receptor physiology, and tumor differentiation. Moreover, AKR1B1 expression is positively associated with PDCD1 and CTLA4 expression. These results support the idea that AKR1B1 is associated with creating an immunosuppressive tumor microenvironment.
To improve the prognosis and treatment of GC, many genetic and epigenetic signatures has been identified using bioinformatics. The team of TCGA Research Network has published a GC molecular classification system consisting of genomically stable (e.g., CDH1, RHOA), chromosomal instability (e.g., TP53), microsatellite instable (e.g., KRAS, PIK3A, ARID1A), and Epstein–Barr virus positive (e.g., CDKN2A) (Network, 2014; Panarese et al., 2017). Other epigenetic modifications such as DNA methylation (DNA methyl methyltransferase family), histone modifications (histone acetyl transferase and deacetylating enzyme family), and noncoding RNA (lncRNA, miRNA, and circRNA) were also used to characterize GCs (Sogutlu et al., 2022).
In addition, series of genes, including cystathionine beta-synthase (CBS), GLIS Family Zinc Finger 3 (GLIS3), and COMM Domain Containing 10 (COMM10), were reported as independent factors for the prognosis of GC (Ding et al., 2023; Zhao et al., 2023; Zhao et al., 2021). However, our understanding of GC pathogenesis, especially the role of immune environment, is still inadequate. More studies are still needed in this field to explore valuable biomarkers for GC.
In previous studies, AKR1B1 has been included in prognosis models consisting of multiple genes for GC (Chen et al., 2022; Wang et al., 2022a; Zhang et al., 2022). In addition, human protein atlas database has reported that higher AKR1B1 expression was associated with worse survival rate. However, the relationship between AKR1B1 and GC has not been analyzed by systemic bioinformatics methods. To further investigate the clinical value of AKR1B1 in GC, we then tested the relationship between AKR1B1 expression and clinicopathological characteristics. AKR1B1 is positively associated with T stage and histologic grade, further confirming its participation in tumor proliferation and immune infiltration.
However, N stage, M stage, and primary therapy outcome are not statistically correlated with AKR1B1, suggesting AKR1B1 may have limited effects in tumor metastasis and chemotherapy responses. We then demonstrated that AKR1B1 level is an independent factor for predicting the prognosis of GC patients. GC patients with high AKR1B1 expression manifested with significantly decreased OS, DSS, and PFI. Combined with primary therapy outcome, historic grade, and age, prognostic nomogram was established with good fitting between the predicted and observed survival rate of GC patients. Taken above, AKR1B1 could serve as a biomarker for GC.
Finally, to confirm the role of AKR1B1 in tumor immune components, we performed in vitro experiments by co-culturing THP-1-derived macrophages and MC803 GC cells. TNFα, IL-1β, IL-4, IL-10, and TGFβ were important cytokines secreted from macrophages and related to worse prognosis of GC (Zavros and Merchant, 2022). TNF-α, IL-1β, IL-10, and TGFβ directly promote the carcinogenesis, invasion, and metastasis of GC (Chen et al., 2019; Cui et al., 2020; Huang et al., 2014; Park et al., 2002). IL-4 levels were significantly higher in GC patients than healthy controls, indicating its pernicious role (Gabitass et al., 2011).
The AKR1B1-overexpressed macrophages showed higher levels of inflammatory cytokine IL1β, but not TNFα. In addition, the expression of immunosuppressive cytokines, including IL4, IL10, and TGFβ, increased in macrophages with upregulated AKR1B1. We further demonstrated that CM from macrophages with AKR1B1 overexpression promoted the proliferation and migration of GC cells. These results suggest that AKR1B1 influences immune environment, especially the cytokines from macrophages to assist GC progression.
Conclusion
In summary, this study identifies AKR1B1 as an important regulator in the immune infiltration and clinical outcomes of GC. Since AKR1B1 overexpression is found related to immunosuppression and worse survival, it could be a biomarker for predicting GC prognosis as well as a potential therapeutic target for GC treatment.
Data Availability Statement
The datasets in this study were downloaded from the TCGA database, GEO database, and IMvigor210CoreBiologies R package. The data of in vitro experiments presented in this study are available on request from the corresponding author.
Footnotes
Disclosure Statement
No competing financial interests exist.
Funding Information
This research was supported by Western Medicine Guidance Project of Shanghai Science and Technology Commission (19411970700) to X.Z.
Supplementary Material
Supplementary Figure S1
Supplementary Table S1
References
Supplementary Material
Please find the following supplemental material available below.
For Open Access articles published under a Creative Commons License, all supplemental material carries the same license as the article it is associated with.
For non-Open Access articles published, all supplemental material carries a non-exclusive license, and permission requests for re-use of supplemental material or any part of supplemental material shall be sent directly to the copyright owner as specified in the copyright notice associated with the article.
