




Abstract
Chromatin immunoprecipitation (ChIP) assesses DNA–proteins interactions and hence helps to generate intricate relationships and vital information. ChIP determines the genomic location of specific proteins or post-translational modifications at an individual locus or genome-wide. The protocol endures complexity; hence it is of utmost importance to identify the variable responsible for experimental erraticism. The most sensitive and critical step involves the chromatin fragmentation step. In the current study, the parameters required for chromatin shearing in the Kasumi-1 cell line have been optimized. To address this, the protocol includes the fixation of cells with formaldehyde followed by cell lysis and nuclei isolation. Further chromatin shearing using various sonication buffers and sonicator parameters was performed. Successful sonication was observed at the following settings: peak incident power of 150 W, duty factor 7.0%, cycles per burst 200, and water fill level 8 generating fragments of ∼250–600 bp in 7 min. To analyze enriched DNA sequences that are associated with the target protein ChIP coupled with quantitative PCR was performed. With this study, the optimal procedure has been standardized for a percentage of detergents, SDS (0.15%), DOC (0.05%) in the sonication buffer, and duration of sonication to achieve the desired fragmentation pattern. The quality of shearing determines the success of the experiment.
Introduction
DNA–protein interactions help to unravel the mechanism crucial for gene regulation, structural organization, DNA replication, repair mechanism, transcription, and so forth. Transcription factors (TFs) play an important role in regulating transcription (Collas, 2010). These regulatory elements are associated with specific proteins that bind to DNA transiently. To study DNA–protein interactions, chromatin immunoprecipitation (ChIP) technique is used. A ChIP protocol comprises of series of steps. To study these TFs or other proteins, the DNA–protein interactions need to be stabilized by cross-linking reagents to preserve the interaction for subsequent target identification. To capture the DNA–protein interactions, formaldehyde (FA) alone or can be used in combination with other available crosslinkers like dimethyl adipimidate, dimethyl 3,3′-dithiobispropionimidate, disuccinimidyl glutarate (Gavrilov et al., 2015; Hoffman et al., 2015; Zeng et al., 2006). The DNA–protein complexes are then released by cell lysis buffer containing either a low concentration of a nonionic detergent that helps in the extraction of nucleoplasm and hence does not disturb the nuclei integrity or isotonic buffer containing a higher concentration of nonionic detergents that ensures cell lysis and release of nuclei (Splinter et al., 2012; Zhang et al., 2020). These DNA–protein complexes are sheared by sonication or by enzyme to approximate 300 bp target size (Browne et al., 2014). Further, the sheared chromatin is immunoprecipitated with an antibody specific to the protein of interest (Fig. 1). ChIP identifies novel sites of occupancy of DNA binding proteins that may be important in biological processes and disease mechanisms (Browne et al., 2014; Landt et al., 2012). The accomplishment of a ChIP experiment includes the abundance of the target proteins and their accessibility in chromatin to antibodies. The crucial variable is shearing which needs to be optimized to improve the sensitivity and reproducibility of the experiment. Shearing the chromatin generates smaller fragments (typically 300–700 bp) making it amenable for subsequent sequencing platforms and thus identifying specific interactions between genomic regions by capturing the physical proximity of these fragments (Keller et al., 2021). Herein, we have performed chromatin shearing optimization in suspension cells (Kasumi-1) using Covaris S220 Focused-ultra-sonicator, as it provides a competent mean of chromatin shearing by preventing excessive heat generation preventing protein epitopes, DNA, and protein–DNA cross-link moreover, also preventing cross-contamination, and hence increasing sensitivity and reproducibility of the experiment results (Khoja et al., 2016). Finally, the enriched DNA sequences associated with the target protein were analyzed by quantitative PCR (Mukhopadhyay et al., 2008).
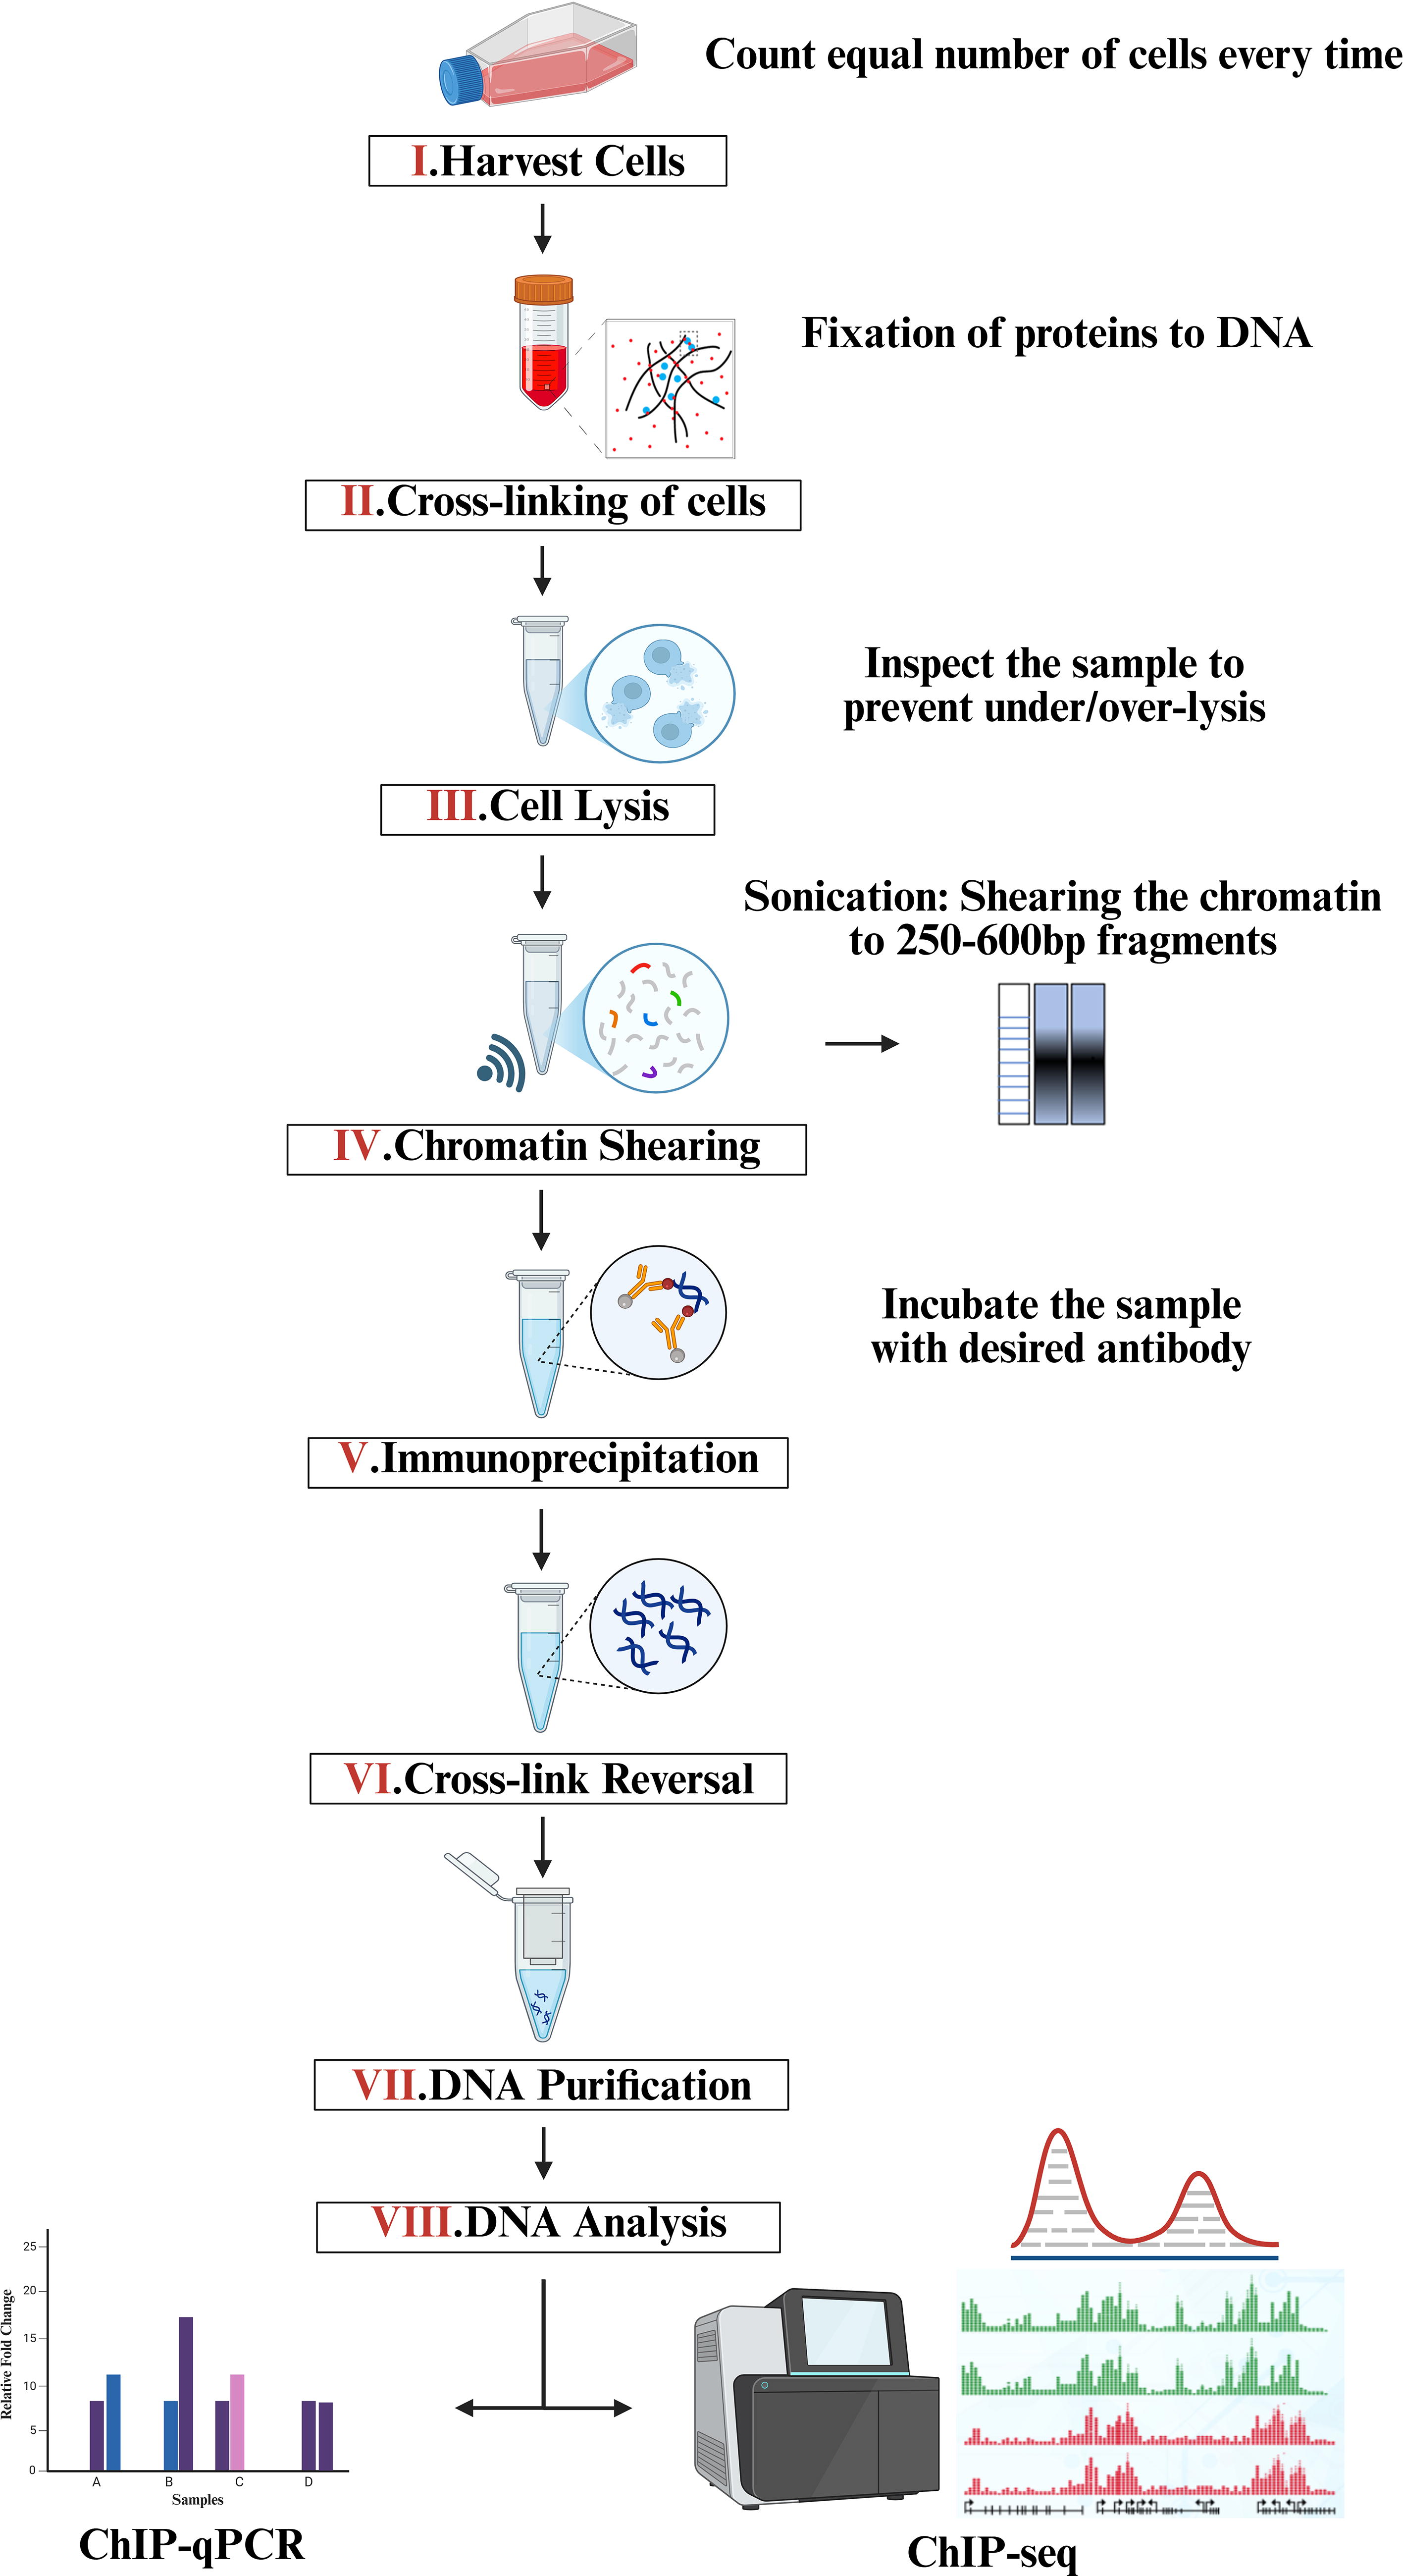
ChIP workflow. Schematic representation of step-by-step workflow of ChIP experiment. Cross-linked chromatin is sheared and DNA is purified and analyzed. ChIP, chromatin immunoprecipitation.
Materials and Methods
Culturing and fixation of cells
Kasumi-1 (ATCC #CRL-2724) cells were routinely cultured in RPMI 1640 (Gibco) supplemented with 10% fetal bovine serum and 1% penicillin/streptomycin at 37°C and passaged every 3–4 days. All the cells were maintained at 37°C in a 5% CO2 humidified chamber. Cells were grown to a concentration of 1 million per mL. Cells were subjected to formaldehyde (FA) treatment only at a final concentration of 1%. Cross-linking of cells was allowed for 10 min at room temperature (RT), gently by placing the tubes on the rocker. The reaction was quenched with 0.125 M glycine for 5 min at RT. The cross-linked cells were pelleted at 2500 g for 10 min at 4°C and washed twice with cold PBS stored at −80°C after snap freeze or proceeding immediately (Mumbach et al., 2016).
Cell lysis and nuclei isolation
The cell pellet (30 million cells) was completely thawed on ice, then resuspended in 1 mL of ice-cold lysis buffer (10 mM Tris-HCl pH 8.0, 10 mM NaCl, and 0.2% NP-40) with 1X PIC (Roche #4693132001) and rotated at 4°C for 40 min. After lysis, the cells were centrifuged at 2500 g for 5 min at 4°C and discarded the supernatant. Check cell lysis with trypan blue (This step serves as a control to prevent under-lysis of the sample for nuclei preparation) (Supplementary Fig. S1). Without disturbing, wash the pellet again with 1 mL of lysis buffer. Herein, to the pellet 12.6 μL of 10% SDS (final SDS concentration is 0.3%) was added to a total volume of 400 μL (Reaction volume was adjusted with nuclease-free water). Incubated, the sample at 37°C in ThermoMixer C (Eppendorf) for 1 h with gentle agitation, to open chromatin. To quench the SDS activity, add 62.5 μL of 20% triton X-100 (final concentration is 1.125%). The sample was mixed gently and further, incubated the sample at 37°C for 15 min in ThermoMixer C with agitation. For quality check (QC), take 20 μL of the sample as a control “nonsonicated” (C1) (Krijger et al., 2020; Massie and Mills, 2012; Mumbach et al., 2016).
Quality checks and cross-link reversal
The control (nonsonicated) sample, C1; volume was adjusted up to 100 μL with 1X TE buffer. Incubated the sample with RNase A (5 μL of 20 mg/mL) (Invitrogen #12091021) at 37°C for 15 min and de-cross-linked with proteinase K (5 μL of 20 mg/mL) (Sigma-Aldrich #P2308) at 65°C for 4 h with agitation 900–1000 rpm using a ThermoMixer C.
Next, purify C1 using phenol:chloroform (Sigma-Aldrich #77617). The sample was briefly vortexed and centrifuged at maximum speed for 10 min and the aqueous layer was transferred to a fresh microfuge tube (Krijger et al., 2020). Quantify the DNA using the Qubit dsDNA BR Assay kit (Invitrogen #Q32853) and load 600–1000 ng of DNA in 1.2% TBE agarose gel to check the DNA integrity (Fig. 2). Electrophoresis was performed at RT for 60 min at 80 volts. Gel images were captured using Gel-Doc (Bio-Rad).
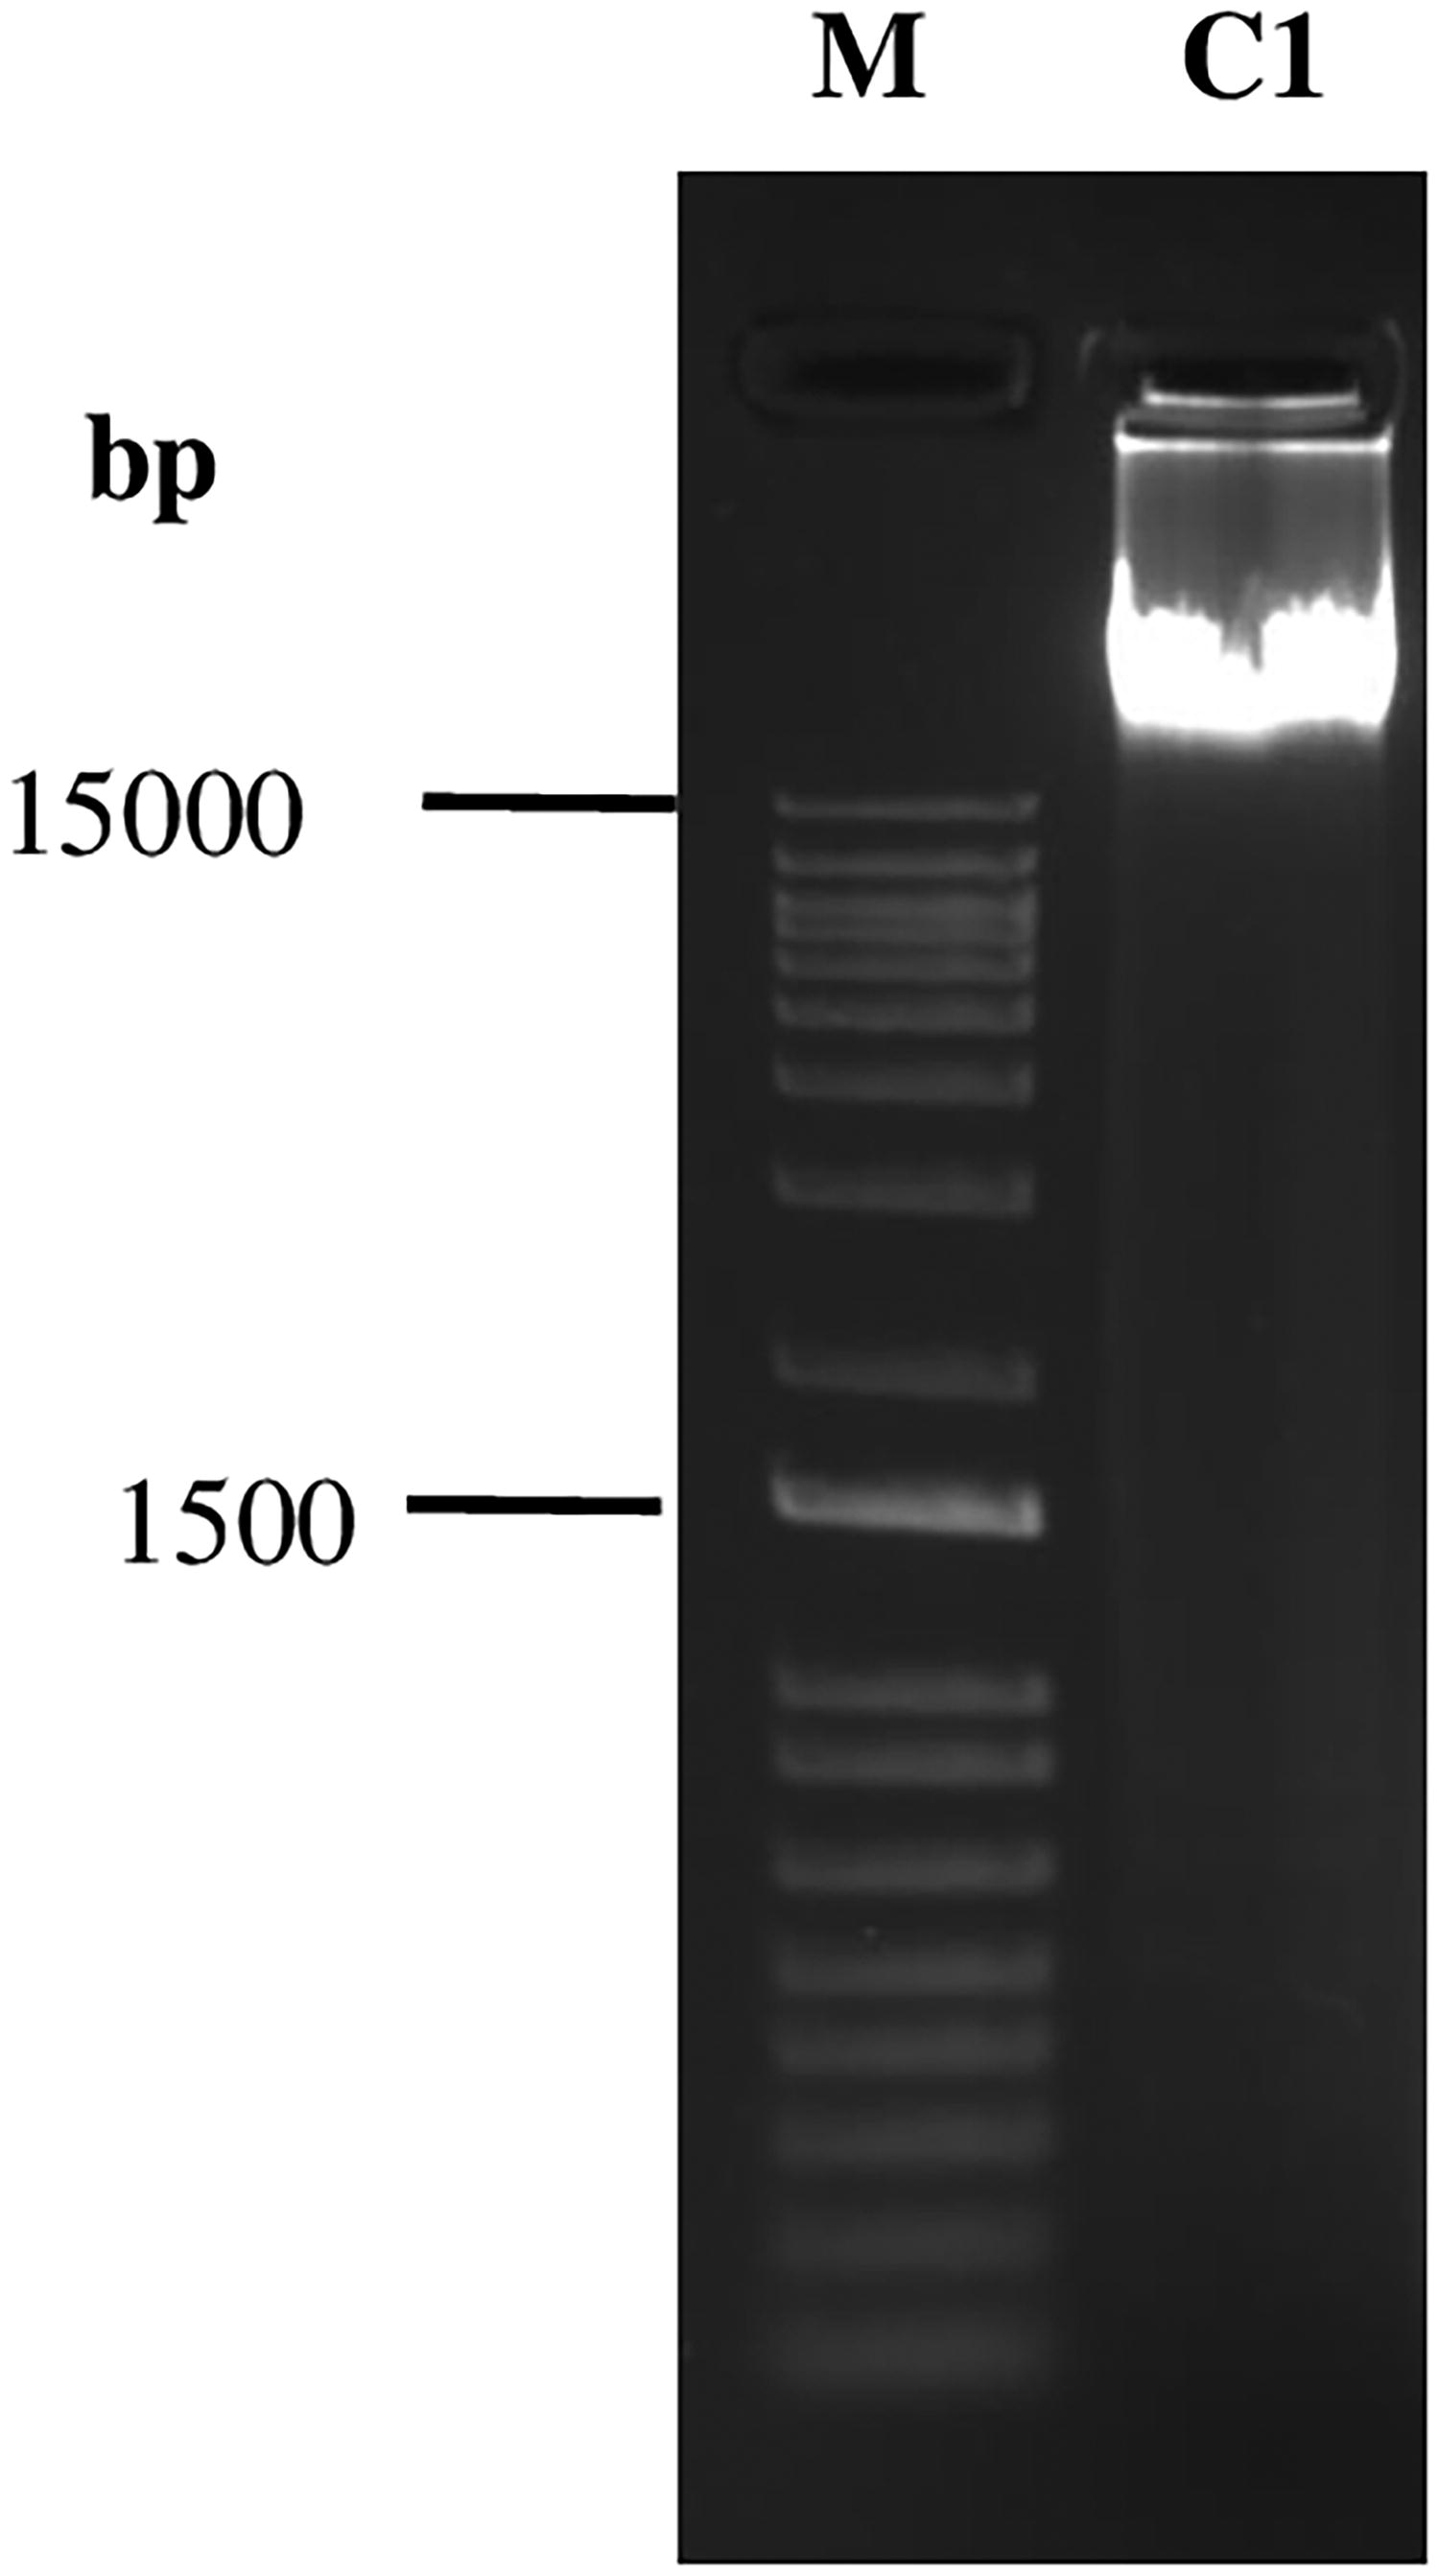
Kasumi-1 cells were fixed with 1% FA at RT for 10 min, quenched with 0.125 M with glycine for 5 min at RT, washed twice with 1X ice-cold PBS, and then resuspended in ice-cold lysis buffer. Following cell lysis, the nonsonicated (C1) sample was de-cross-linked and purified DNA was analyzed on 1.2% agarose gel showing an intact band of high molecular weight. The left lane shows the 1 kb plus DNA molecular weight marker (M) and the right lane shows nonsonicated control. RT, room temperature.
Optimization of chromatin shearing
Shearing is used to fragment the fixed chromatin isolating soluble chromatin that will shear into a size range suitable for sequencing (Keller et al., 2021). In this work, the S220 Focused-ultra-sonicator (Covaris) was used and all the parameters can be adjusted according to the user. “Peak incident power” (PIP) is the measure of ultrasonic power used for a sample which ranges from 2.5 to 500 Watts. “Duty factor” (DF) is the percentage of time for which the ultrasonic signal is given to the sample ranging from 1.0% to 50.0%. “Cycles per burst” (CPB) is the number of cycles of ultrasonic energy delivered during the “on” portion of the duty cycle. “Duration” is the total time taken to complete the sonication cycle (Covaris, 2020).
After cell lysis in lysis buffer (10 mM Tris-HCl pH 8.0, 10 mM NaCl, and 0.2% NP-40), isolated nuclei were resuspended in a sonication buffer. For chromatin preparation, we used a multi-buffer with varying detergent (SDS and DOC) concentrations. Under the optimized protocol, different sonication buffer with varying strengths of detergent was added to each individual pellet and mixed gently to form a uniform suspension. Low detergent requirements (reduced SDS 0.1%) are suitable for immunoprecipitation and require less chromatin dilutions. Shearing with high concentrations of SDS can solubilize a significant amount of the desired epitope. The sonication was carried out in milli-tube 1 mL AFA fiber tube (# 520130). Various sonication buffers and sonication parameters were tried to obtain an efficient sonication. At different time intervals, samples were taken and stored at 4°C. All the stored aliquots (20 µL) of the control sample were adjusted to the 100 µL volume with the sonication buffer and subjected to centrifugation at 21,000 g (Rotor #FA-45-24-11) at 4°C for 10 min. All the cytoplasmic impurities remained in the tube and the sonicated chromatin released in the supernatant was transferred to a new microfuge tube. Post shear fragment size distribution analysis was done by treating the sample with RNase A at 37°C for 15 min and cross-reversed with proteinase K at 65°C for 4 h with agitation 900–1000 rpm using a ThermoMixer C. Phenol:chloroform purification of the samples was performed and agarose gel electrophoresis was used to check fragment size of chromatin.
Chromatin immunoprecipitation
Chromatin immunoprecipitation (ChIP) protocol was performed as described (Gade and Kalvakolanu, 2012; Mukhopadhyay et al., 2008). ChIP involves appropriate controls to assess the true data and excludes the variations generated during the experiment. These include input DNA and bead-only controls. Because of chromatin conformation, some regions of the genome are more accessible to digestion or sonication. Therefore, it is preferred to extract DNA from an aliquot of cross-linked and sonicated chromatin before the immunoprecipitation step referred as “input DNA” and used as a control to compare against the immunoprecipitated DNA, to assess the relative enrichment of a specific DNA sequence bound by a protein of interest following the immunoprecipitation reaction. Another approach to measure the levels of unspecific binding of an immunoprecipitation assay is to perform immunoprecipitation in the absence of an antibody known as “beads only” control, which allows measuring the background enrichment of DNA fragments produced simply by mixing chromatin with beads. Sonicated lysate was clarified by centrifugation at 21,000 g (Rotor #FA-45-24-11) for 10 min at 4°C. The supernatant (Chromatin) was transferred to a new tube, and a 25 μL aliquot was kept as an input (representing total genomic DNA). The remaining volume was incubated with protein G magnetic beads bound with the specific antibody, RUNX1(Abcam #ab23980) overnight at 4°C for enrichment of proteins bound to DNA while a negative control deprive of antibody was also maintained. Sequentially, beads were washed with wash buffers A, B, C, and D respectively. All the washing steps were performed at RT on the magnetic stand by adding 1000 μL of each wash buffer, swirling the beads back and forth by moving the sample relative to the magnet, and the supernatant was discarded after every wash. Furthermore, DNA was eluted off from the beads by incubation at 65°C for 1 h in 200 μL elution buffer (Table 1). Further DNA was purified by treating with RNase A for 30 min at 37°C and cross-reversed with proteinase K at 67°C for 4 h after adding 10 μL of 4 M NaCl. Finally, the DNA was purified using a QIAquick PCR purification kit (Qiagen # 28104) according to the manufacturer’s protocol and eluted in 80 µL TE. The eluted DNA was quantified by Qubit dsDNA HS Kit (Invitrogen #Q32851) and used for qPCR.
Chromatin Immunoprecipitation Wash Buffers
Wash beads sequentially with low-salt wash buffer (wash buffer A), high-salt wash buffer (wash buffer B), LiCl wash buffer (wash buffer C), and finally, with wash buffer D. Beads are finally eluted in the elution buffer.
qPCR was performed on primers specific for the FUT7, NFE2, KREMEN1, OGG1, and SPI1 genes. Relative occupancy was calculated as fold change over the background, for which the promoter of the MYO gene was used (Table 2). qPCR was performed for input, negative control, and ChIP DNA sample using the 12.5 μL 10× SYBR Master mix, 0.5 μL forward primer (from 10 μM), 0.5 μL reverse primer (from 10 μM), 3 μL DNA and nuclease-free water up to 25 μL. PCR program was applied as follows: 95°C for 6 min; 95°C for 10 s, 60°C for 45 s, 68°C for 3 min, apply for 30 cycles; 68°C for 5 min.
List of Primers
The table lists the sequences of forward and reverse primers.
Results
A long incubation time will strengthen the cross-linking between DNA-protein, hence resulting in inefficient sonication whereas a shorter incubation time leads not very strong bonding between them and hence will result in poor detection of chromatin interactions (Barman et al., 2023; Hoffman et al., 2015). From the literature, it was observed that 10 min fixing was sufficient for DNA–protein interactions (DeCaprio and Kohl, 2020; Hoffman et al., 2015; Mumbach et al., 2016). Therefore, all the cross-linking steps were carried out for 10 min. To quench the FA activity glycine was added and incubated at RT for 5 min and further incubated for 15 min on ice to completely cease the left-overactivity of FA (Arrigoni et al., 2016; Nelson et al., 2006).
To confirm the integrity of DNA before sonication, an aliquot was de-cross-linked and purified DNA was visualized on 1.2% agarose gel which showed an intact DNA band (∼15 kbp) (Fig. 2). Further, nuclei were sonicated in sonication buffer (final SDS 0.1% and 0.1% DOC) (Table 3) at the following settings: PIP (140 W), DF (5%), and CPB (200) (Fig. 3). A high molecular DNA chunk ∼103 kb is observed in gel even when sonication duration was increased to 20 min (Fig. 3a), suggesting that only a small portion of chromatin is fragmented and majority of chromatin remained undisturbed. Since shearing of chromatin did not occur efficiently, again, sonication was checked in the above buffer, to determine the role of the DF variable. Only, DF (5%) was changed to DF (10%), and other parameters were the same as above. The chromatin was sonicated for 10 min. As compared to non-sonicated chromatin, no visible difference was observed after sonication (Fig. 3b). Further, we increased only DF to 20% while PIP (140 W), and CPB (200) were the same and varied the time intervals (15, 20, and 25 min). Again, almost no visible difference was observed between the samples and even after 25 min of sonication, the chromatin was sheared to 10 to 3 kb fragments (Fig. 3c) (Supplementary Fig. S2). This result suggests that increasing DF and sonication time does not effectively generate the desired length of chromatin fragments.
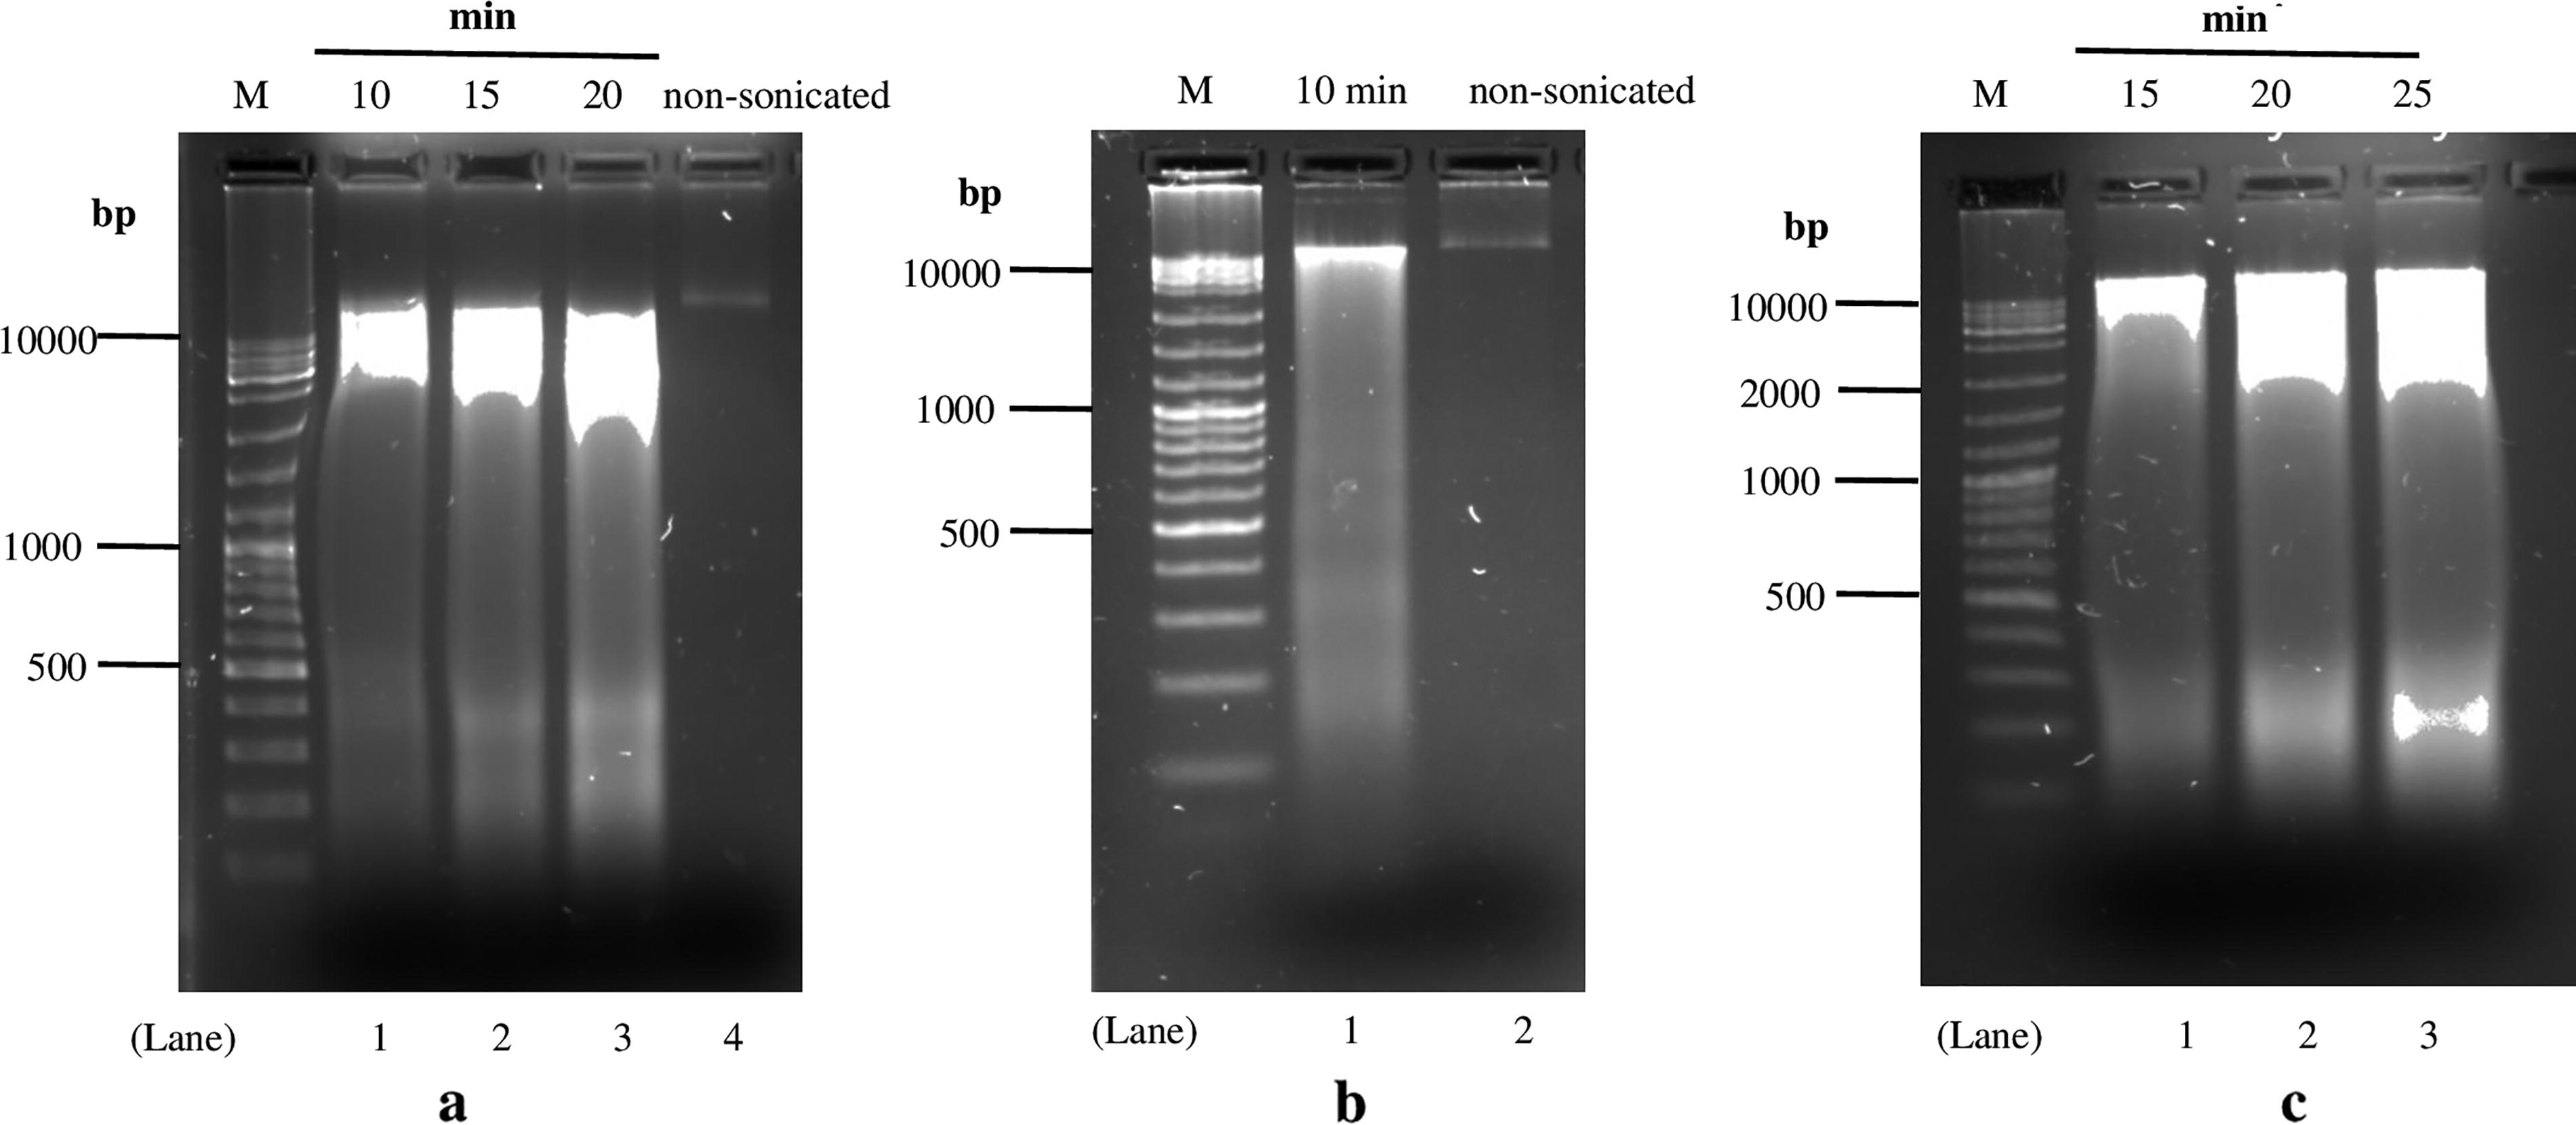
The effect of buffer composition and sonication parameters on sonication efficiency. After chromatin sonication, the cross-link was reversed and the purified DNA was subjected to electrophoresis as in Figure 2a and c. The left lane shows the 1 kb DNA molecular weight marker (Thermo Scientific # MAN0013033), and the right lane shows different time points.
Components of Sonication Buffer
Table enlists the various components of the sonication buffer required for shearing of the chromatin.
Different sonication buffers were checked with a final percentage of SDS; 0.12% (A), 0.13% (B), and 0.14% (C). Each sonication buffer was prepared individually and the final percentage of SDS and DOC was maintained in each buffer (Table 4). Individually three nuclei pellet was resuspended in the above buffers respectively and sonication efficiency was determined using PIP (185 W), DF (10%), and CPB (200). In Figure 4, in all three conditions (A, B, C) no major difference was observed in the shearing pattern between the samples taken at different time intervals.

Systematic optimization of sonication parameters with varying concentrations of SDS and DOC with different intervals of sonication conditions.
Determination of the Optimal Chromatin Sonication Parameters
Cells were lysed and nuclei were isolated. Chromatin was sonicated with varying percentages of SDS and DOC in sonication buffer for variable time periods. An aliquot of sonicated chromatin was examined on an agarose gel after de-cross-linking.
Increasing sonication time generated too small DNA fragments (<500 bp) (Figure 4a). Hence, at the above settings desired chromatin fragmentation was limited. Since SDS aids in chopping the DNA into smaller fragments, next we assessed sonication efficiency with varying percentages of SDS and DOC and modified the sonication parameters to achieve better chromatin fragmentation. The nuclei were sonicated at different parameters, PIP (160 W), DF (15%), CPB (200), and final SDS (0.18%) and DOC (0.05%) and were maintained in sonication buffer (condition D) (Table 4). We observed that, in SDS (0.18%), most of the DNA fragments ranged less than 300 bp at 10 min of time interval. However, increasing the sonication duration up to 30 min does not drastically impact the fragmentation and generated DNA smear of less than 300 bp. Hence, the maximum time required for sonication was observed to be 10 min (Fig. 4b) To confirm the time for effective sonication, the experiment was repeated by reducing the duration of sonication with SDS (0.18%) and DOC (0.05%) in sonication buffer. Sonication was studied at different time intervals (i.e., 2, 5, 7, and 10 min) that generated a DNA smear with approximate DNA size of the sheared chromatin fragments less than 1 kb as visualized in agarose gel electrophoresis (Fig. 4c) (Supplementary Fig. S3). The results suggest efficient sonication with a DNA fragment size distribution of 200–750 bp in 5 min of sonication. Samples at time intervals of 7 min and 10 min yielded fragments of less than 500 bp.
As sequencing requires fragments of ∼300 bp, thus sonication was performed at different conditions. Since sonication parameters used in condition D resulted in chromatin sonication within 200–750 bp, therefore to fine-tune the sonication we assessed sonication efficiency with varying percentages of SDS (0.15%, 0.175%, and 0.2%) (Fig. 5) and for each condition sonication parameters were set similar: PIP (150 W), DF (7%), CPB (200), and water fill level (8).
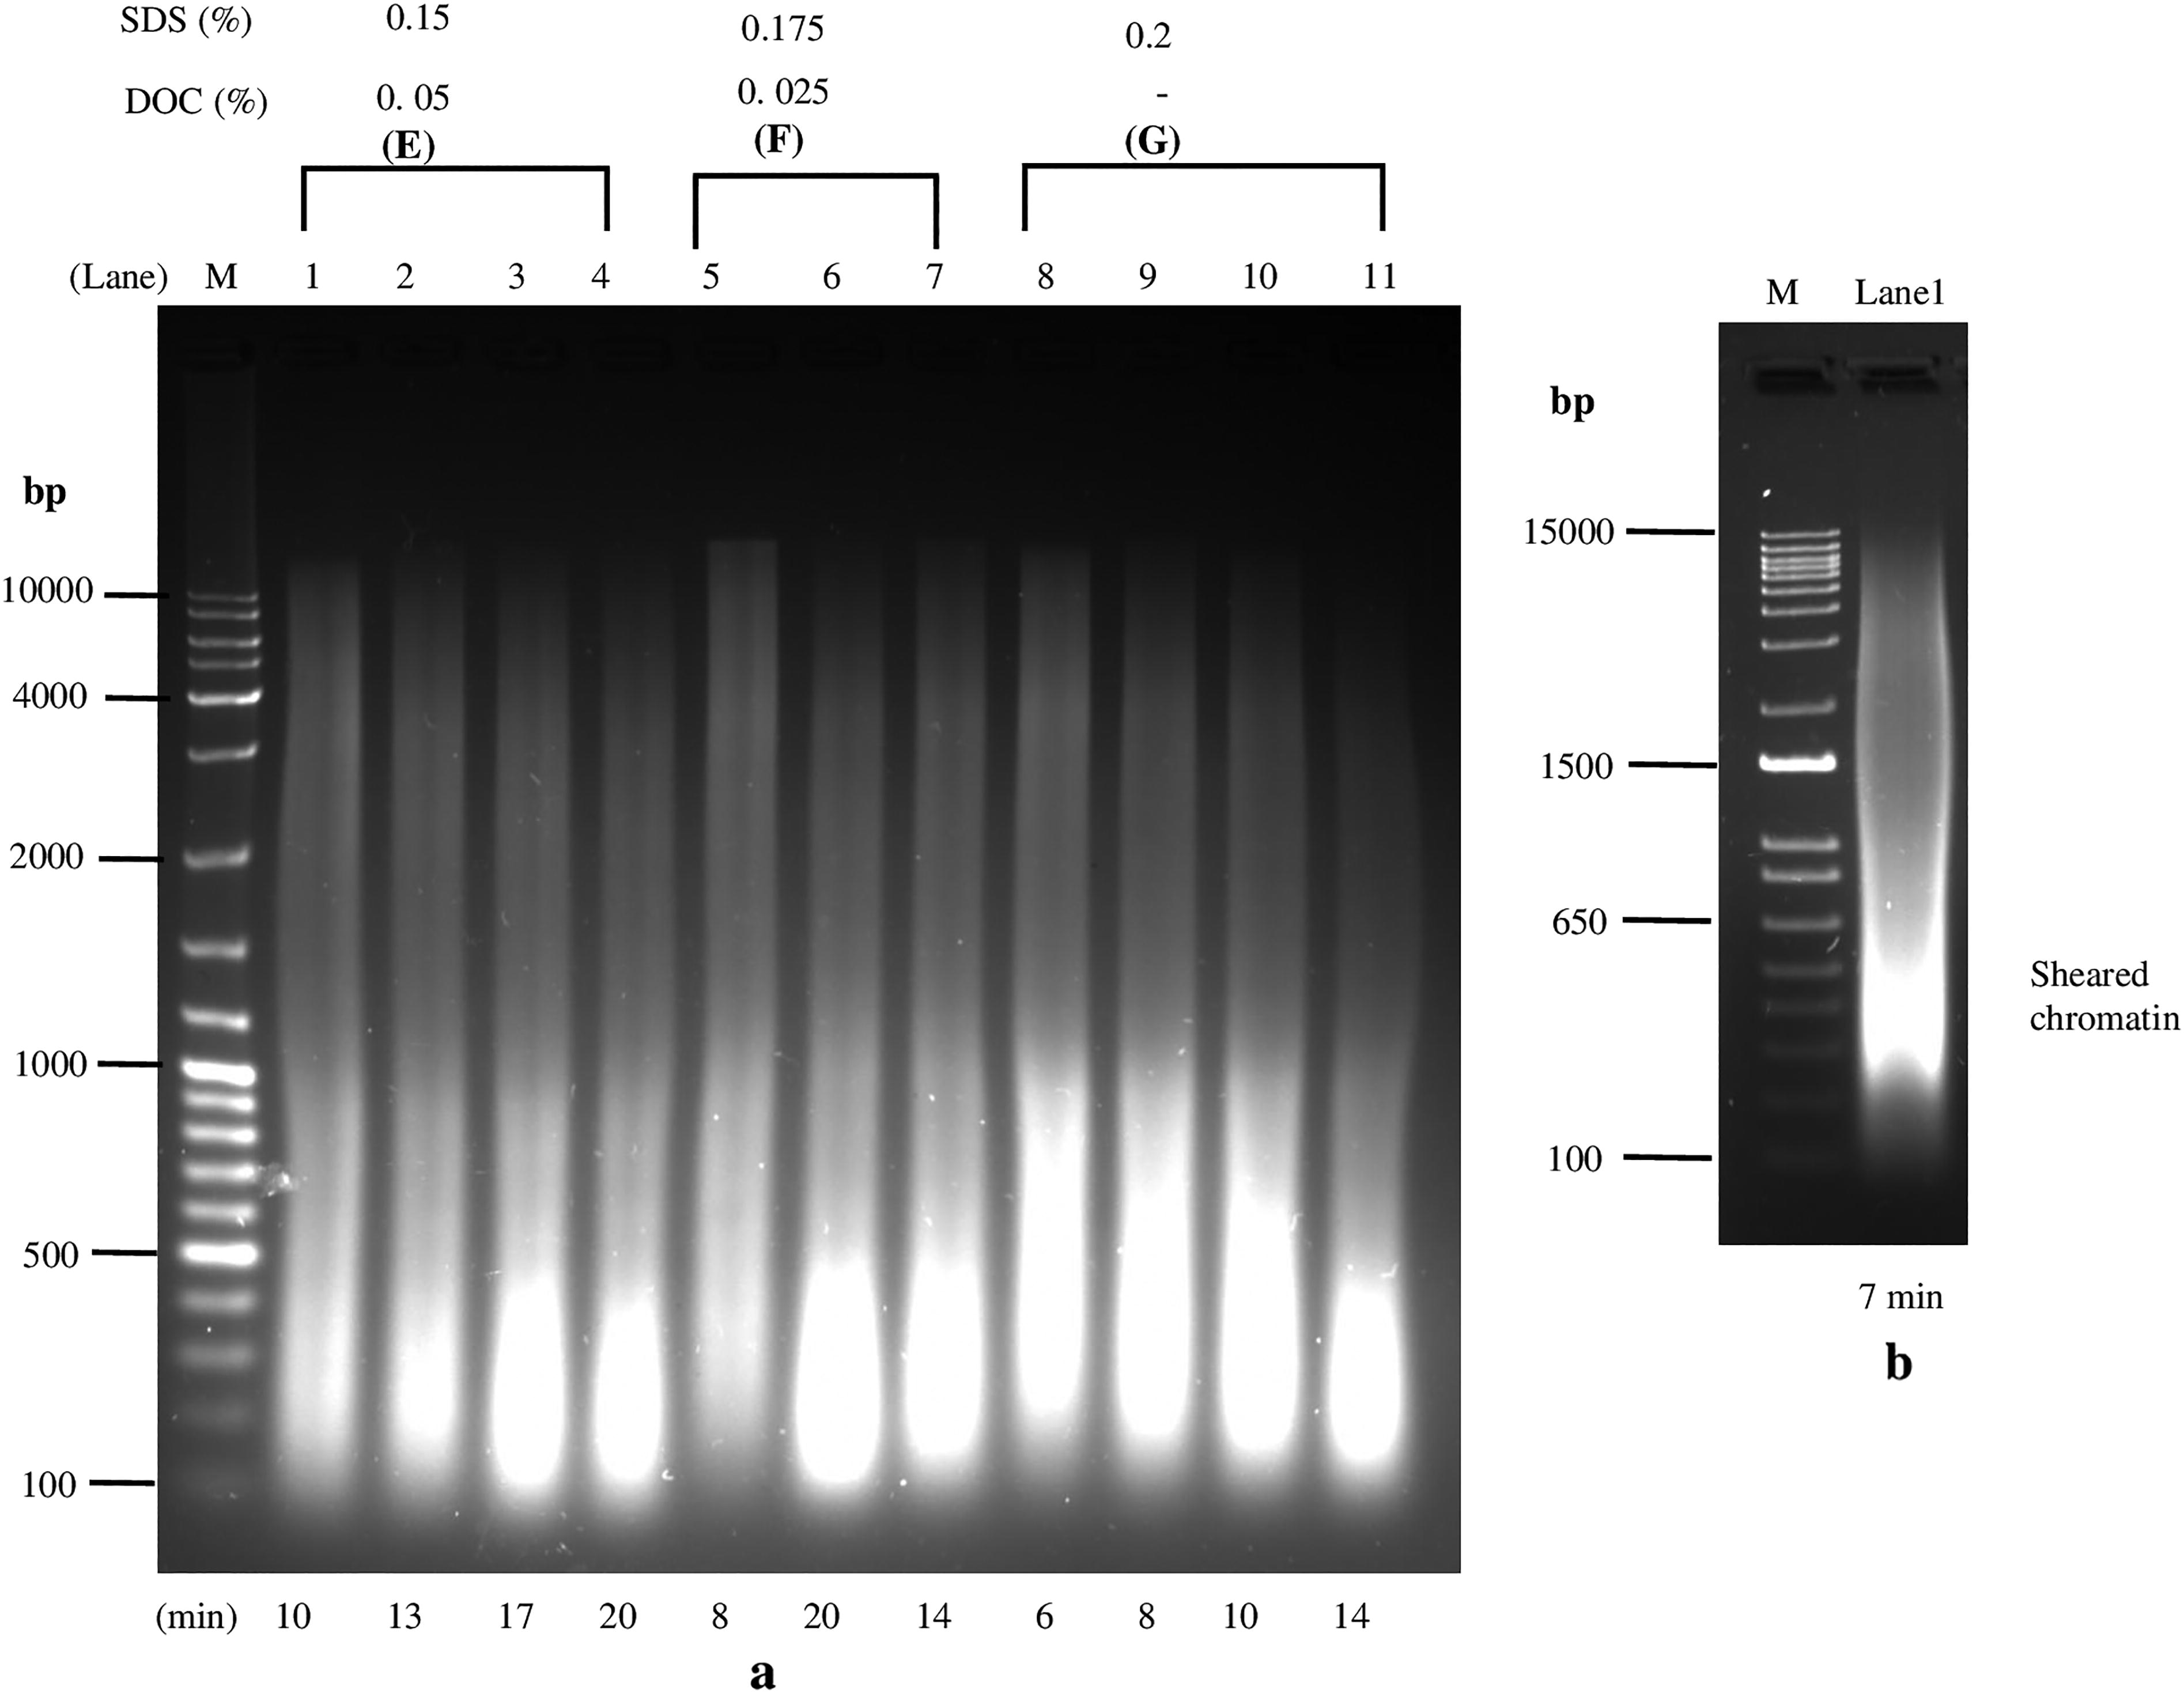
Agarose gel electrophoresis analysis of purified fragments.
As follows from Figure 5a, sonication under condition E, generated chromatin fragments of less than 500 bp at 10 min. Even increasing sonication for 20 min yielded DNA fragments ranging from ∼150–400 bp in length. Sonication under condition F, at the time interval of 8 min yielded sheared chromatin; while with an increase in time to 20 min, limited chromatin fragments to ∼100–500 bp length. Under condition G, the shearing effect in the presence of only 0.2% SDS was studied. The time for chromatin processing at 6, 8, 10, and 14 min was carried out. Initially, shearing at a time interval of 6 min yielded fragments of <1 kb. With the increase in time, 8 min and 10 min, a shift in the size of the fragments is observed limiting the generation of chromatin fragments of ∼200–800 bp length. Fragmentation pattern was also assessed at intervals of 14 min, yielding chromatin fragments of less than 500 bp fragments. This suggests that efficient sonication was observed with minor differences in all three conditions irrespective of the composition of the buffer at the same sonication parameters. Further, the above sonication parameters: PIP (150 W), DF (7%), CPB (200), and water fill level (8) were again confirmed with respect to sonication time to achieve chromatin fragments of desired range and to check the repeatability of the experiment. The agarose gel electrophoresis result suggests that the sonication of cross-linked chromatin generates a fragmentation pattern with an average size ranging from 250 to 600 bp at 7 min of time interval (Fig. 5b) (Supplementary Fig. S4). Thus, to achieve optimal sonication, 0.15% SDS and 0.05% DOC in the sonication buffer are well considerable. During sonication, a lower SDS-containing buffer is preferred as higher SDS concentration compromises immunoprecipitation efficiency by reducing antigen availability in chromatin for the antibody. Ideally one should choose the minimum sonication time that gives rise to the ideal range (typically 250–600 bp). The process was well optimized for sonication at the following settings: PIP of 150 W, DF 7.0%, CPB 200, and water fill level 8, where 7 min was the optimal sonication time (Fig. 5b). However, the results from the agarose gel need to be considered to make a decision. As long as the majority of the DNA is below 1000 bp we can accept the condition.
As anticipated, the sheared chromatin fragments of the desired size were generated. Following shearing, ChIP was performed and confirmed by ChIP-qPCR. Positive gene loci were enriched in the samples incubated with the antibody, whereas no binding was observed in the negative control sample lacking the antibody (Fig. 6).
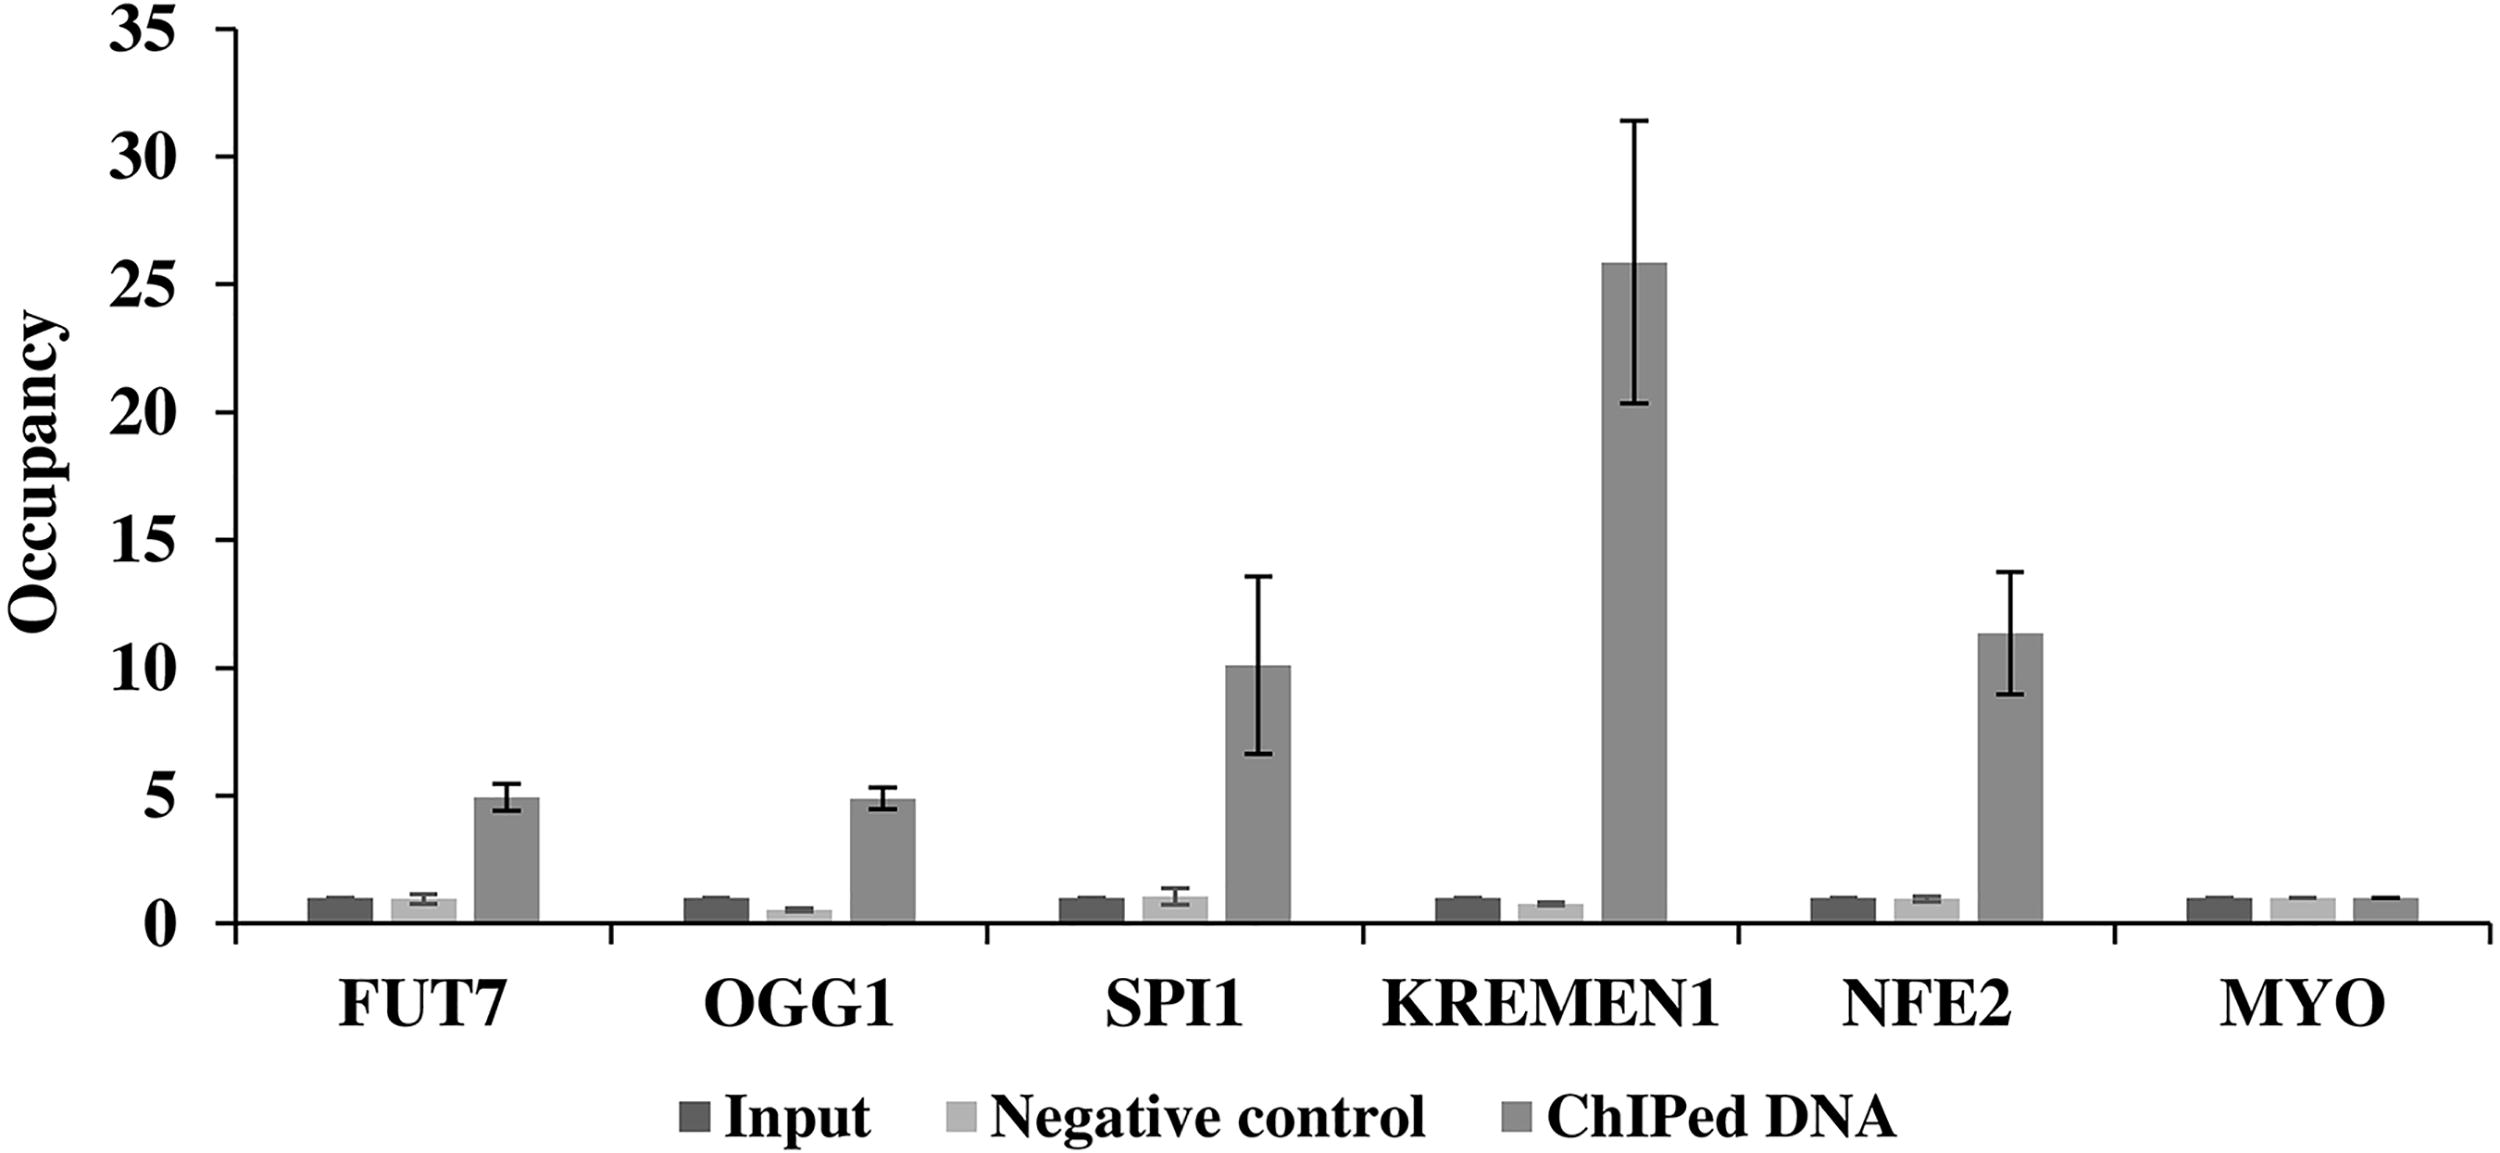
An aliquot of 1 × 10⁷ Kasumi-1 cells were cross-linked and sonicated. Cell lysate was immunoprecipitated and 3 μL of antibody was used per ChIP experiment. After cross-reversal DNA is purified. Following ChIP, the binding sites of transcription factor to target gene promoter were analyzed by qPCR. The graph shows the occupancy, calculated as the ratio + control/background for which the promoter of the MYO gene was used. Each bar represents the occupancy of promoter RUNX1 ± SEM from two independent experiments.
Discussion
To identify and optimize conditions for chromatin sonication, variables such as cell density, cell lysis buffer, sonication buffer, and sonication time are considered crucial. Cell viability and density are the first critical steps to achieve the desired result as they can affect the downstream performance. Cell fixation is another important aspect that defines the shearing and recovery of DNA. A handful of methods for cell lysis are reported in the literature and based on the design of the experiment the buffer can be selected. However, detergent in lysis buffer plays an important role in achieving sonication. Nuclei are completely released in the presence of a higher content of nonionic detergents in the buffer although nuclei remain intact, while hypotonic condition ensures efficient extraction of the nucleoplasm (Arrigoni et al., 2016; Kim and Dekker, 2018). In this study, uniform suspension of cells was observed. A highly viscous lysate indicates that DNA is released from nuclei and appears to be degraded (data not shown).
Two critical factors in determining optimum sonication conditions are the duration of sonication and the power output. To avoid excessive heating and preserve the integrity of the sample, the total sonication time is usually partitioned into a number of “cycles” of sonication (i.e., 3, 6, 9 min vs. a single long pulse 9 min), as it will help to determine the intermittent sonication time to analyze most appropriate DNA size distribution. Too long sonication destroys the epitope sites and hence target protein does not bind to its site (Covaris, 2020; Mukhopadhyay et al., 2008). ChIP is the common method to study protein–DNA interactions at a genome-wide level and helps to better understand gene regulation. ChIP assay is used to isolate specific TF gene targets thus identifying binding sites (Collas and Dahl, 2008; Im et al., 2004; Sullivan and Santos, 2020). To confirm the efficiency of subsequent immunoprecipitation, it is crucial to control the chromatin fragments mostly in the range of 250–600 bp, and also epitope sites should not be damaged. Together, considering all points can provide good data about the proteins associated with DNA and their function in gene regulation.
Conclusions
Herein, we present the approach for chromatin sonication of the suspension cell line in the Covaris S220 Focused-ultra-sonicator. This process discloses various key points for a successful outcome of sonication. A periodical assessment of chromatin shearing is the next important step to define ideal chromatin fragment size ranges from 250 to 600 bp, for the success of the experiment. The extent of chromatin sonication determines how far a specific protein can be mapped along the gene. The ChIP assay allows to study of transcription factor binding sites. The range of chromatin fragment sizes is critical for good coverage and resolution of data, without losing material due to overfragmentation. For each cell line and type of sonicator used, the sonication parameters need to be optimized to obtain a desired fragmentation pattern to deliver high-quality chromatin for the most sensitive results in a highly reproducible manner.
Footnotes
Acknowledgments
The authors thank the Department of Pharmaceuticals (DoP), Ministry of Chemical and Fertilizers, and NIPER-Ahmedabad.
Authors’ Contributions
A.C. and P.P.V. carried out the experiment. A.C. was a major contributor in writing the article, analyzed, and interpreted the data. A.M. conceived the article’s initial conceptualization, decision on topics, and supervised the study. A.C. and P.P.V. prepared all the figures and tables. A.C., P.P.V., and V.U. reviewed and edited the draft. All the authors further revised the final version of the article. All the authors have read and approved the final article.
Author Disclosure Statement
The authors declare no conflicts of interest.
Funding Information
No funding was received for this article.
Supplementary Material
Supplementary Figure S1
Supplementary Figure S2
Supplementary Figure S3
Supplementary Figure S4
References
Supplementary Material
Please find the following supplemental material available below.
For Open Access articles published under a Creative Commons License, all supplemental material carries the same license as the article it is associated with.
For non-Open Access articles published, all supplemental material carries a non-exclusive license, and permission requests for re-use of supplemental material or any part of supplemental material shall be sent directly to the copyright owner as specified in the copyright notice associated with the article.
