
Abstract
The side effects associated with flutamide as a first-line drug treating prostate cancer, including hepatotoxicity, the aim of this research was to use melatonin as an anticancer candidate to reduce the dose of flutamide and reduce its side effects. We evaluated the effect of melatonin, flutamide, and melatonin–flutamide combination therapy in LNCaP, DU145, and PC3 cell lines. The assessment includes Hoechst dye staining, scratch-wound assay, colony formation assay, flow cytometric analysis of apoptosis and DNA cell cycle, real-time PCR (BAX [BCL2 Associated X]/B-cell lymphoma-2 [BCL2], E-cadherin, Zinc finger protein SNAI2 [SNAIL], Hypoxia Inducible Factor 1 Subunit Alpha [HIF1α], Vascular Endothelial Growth Factor C [VEGFC], and kallikrein-related peptidase 3 [KLK3] genes). To determine Half maximal inhibitory concentration (IC50) levels, cell lines were exposed to different concentrations of the drugs. Our data indicated that IC50 values for melatonin (75 µM) and three cell lines and flutamide (12 and 10 µM) for PC3 and LNCaP/DU145, respectively, with 3-(4,5-dimethylthiazol-2-yl)-2,5 diphenyl tetrazolium bromide were approved by flow cytometry in a dose and time-dependent manner which was as a consequence of cell cycle arrest at G0/G1 phase. Due to the efficacy of melatonin in combination with flutamide, we used 75 µM melatonin, and 5 µM flutamide instead of 12 µM in DU145, and 6 µM in PC3 and LNCaP, respectively. The combination of melatonin and flutamide significantly upregulated the expression of BAX/BCL2 ratio in all three cell lines (p < 0.0001) and downregulated the expression of KLK3 (p < 0.01), HIF1α (p < 0.01), VEGFC (p < 0.001), and epithelial–mesenchymal transition pathway genes in PC3 and LNCaP (p < 0.01). Melatonin in combination with flutamide reduced its dose and increased the sensitivity of prostate cancer cells to treatment.
Introduction
Developing effective treatment strategies for advanced or aggressive forms of prostate cancer is of paramount importance for several reasons. Advanced prostate cancer is often difficult to treat and has a poor prognosis. As the disease progresses to metastatic or castration-resistant states, it becomes more resistant to conventional therapies. Moreover, aggressive prostate cancers, characterized by high Gleason scores or rapid progression, pose a significant threat to patient survival. Identifying and implementing personalized treatment strategies tailored to the molecular and genetic profiles of these aggressive cancers can potentially improve response rates and prolong survival (Tidahy et al., 2022).
Prostate cancer, the second most frequently diagnosed cancer and the fifth leading cause of cancer-related deaths among men globally increases sharply after 55, peaking around 70–73 years old. The only well-established risk factors are advanced age, African ancestry, and family history of prostate cancer. Prostate cancer is commonly asymptomatic in its early stages. The clinical course can range from indolent and requiring minimal treatment to aggressive and rapidly progressing (James et al., 2024). Androgen receptor (AR) signaling plays a critical role in prostate cancer through mechanisms such as AR gene alterations (Choi et al., 2022). These diverse AR-driven pathways contribute to the development and progression of prostate cancer. Androgen deprivation therapy is the primary systemic treatment for advanced prostate cancer, but the disease often progresses to a castration-resistant state where AR signaling continues despite low androgen levels.
Flutamide, a nonsteroidal antiandrogen, inhibits prostate cancer cell growth and survival by blocking AR signaling through several key mechanisms (Mazdak et al., 2022; Boehm et al., 2023). Flutamide also leads to decreased AR protein levels by promoting AR degradation, reducing the overall AR-driven oncogenic signaling. Flutamide has shown synergistic effects when combined with other compounds, such as resveratrol, suggesting that combination therapies may enhance the efficacy of AR-targeted treatments (Posdzich et al., 2023).
Melatonin, a hormone produced by the pineal gland, has been shown to exert a wide range of anticancer effects in prostate cancer through multiple mechanisms. It promotes apoptosis by activating tumor necrosis factor (TNF) and TNF-related apoptosis-inducing ligand pathways, downregulating antiapoptotic proteins, and disrupting the mitochondrial membrane potential. Melatonin also inhibits metastasis by suppressing the expression of matrix metalloproteinases, impairing the invasive and migratory capacities of prostate cancer cells, and inhibiting angiogenesis. In addition, melatonin modulates cell cycle and proliferation by regulating cyclins, cyclin-dependent kinases, and signaling pathways such as PI3K/AKT and MAPK/extracellular signal-regulated kinases (ERK). It targets AR signaling, particularly the castration-resistant AR-V7 splice variant, and exerts antioxidant and anti-inflammatory effects. Melatonin also influences mitochondrial function and metabolic pathways, as well as circadian rhythm regulation, which may contribute to its overall antitumor properties in prostate cancer (Tamehri Zadeh et al., 2020).
The combination of melatonin and flutamide could have synergistic or additive effects in managing prostate cancer through complementary mechanisms of action. By targeting both full-length AR and its variants, the combination could more effectively suppress AR-driven tumor growth and progression. Melatonin also suppresses the expression of matrix metalloproteinases involved in cancer cell invasion and metastasis, which could complement flutamide’s antiproliferative effects to impede tumor growth, invasion, and metastasis. Furthermore, melatonin can inhibit additional prosurvival pathways, and the combination with flutamide’s AR inhibition could synergistically disrupt multiple oncogenic signaling cascades (Allam et al., 2023; Megerian et al., 2023; Mafi et al., 2023).
The combined impact of melatonin and flutamide on prostate cancer cell behavior, particularly for the LNCaP, PC3, and DU145 cell lines, remains an area that requires further investigation. As a result, several gaps in the current understanding can be inferred. First, there are no studies that have examined the combined effects of melatonin and flutamide on prostate cancer cells, with the available literature focusing solely on their individual impacts. Consequently, it is unclear whether their combination would lead to synergistic, additive, or antagonistic effects on key cellular processes, such as proliferation, invasion, migration, or apoptosis. In addition, the potential differences in the combined effects of melatonin and flutamide across androgen-sensitive (e.g., LNCaP) and androgen-insensitive (e.g., PC3, DU145) prostate cancer cell lines have not been explored. In this study, we are going to examine flutamide and melatonin alone and in combination within different assays in order to compare the effect of each drug and combination therapy on prostate cancer cell lines.
Materials and Methods
Cell culture
Cell lines of PC3 (NCBI code: C428), LNCaP-FGC-10 (NCBI code: C439), and DU145 (NCBI code: C428) were obtained from the Pasteur Institute of Iran. Cell lines were maintained in DMEM medium (Gibco) supplemented with 10% fetal bovine serum, 1000 units/mL penicillin, and 100 µg/mL streptomycin (Gibco) in a 5% CO2 humidified incubator at 37°C.
Cell proliferation assay
IC50 and the inhibitory effect of melatonin on the metabolic activity of prostate cancer cell lines were evaluated using 3-(4,5-dimethylthiazol-2-yl)-2,5 diphenyl tetrazolium bromide (MTT) assay, after seeding at 5 × 10³ cells/mL per well in 96-well plates, cell lines were exposed to various concentration of melatonin for 24, 48, and 72 h. Then cells were incubated with 100 µL of MTT solution (0.5 mg/mL, Sigma−Aldrich) for 4 h at 37°C. After the dissolving of formazan crystals in 100 µL of Dimethyl Sulfoxide (DMSO), the optical density was measured at the wavelength of 570 nm by an ELISA microplate reader. Dose–response curves were plotted and IC50 was graphed using GraphPad Prism software (v9). Cell viability calculation formula (%) = ([average absorbance of triplicate treatment wells)/(average absorbance of control wells]) 100.
3D cell colony formation assay
Cell lines in the treatment group and control group were seeded at the rate of 1.5 × 10³ cells per well on six-well plates and incubated for 2 weeks. After 14 days, the bottom of the plate was coated with 2% agarose gel. Then, cells were mixed with the culture medium containing 0.7% agarose gel and poured on the gel-coated surface of the plate. The culture medium was changed every 4 days. After this time, cells were fixed with cold formaldehyde, washed with Phosphate Buffer Saline (PBS), and stained with 0.1% crystal violet. Calculation of the colony formation rate was done using ImageJ software.
Flow cytometric measurement of apoptosis
Cell viability, apoptosis, and necrosis were determined using an Annexin-V and PI (propidium iodide) kit according to the manufacturer’s instructions.28 After overnight incubation of cell lines in DMEM/10% FBS at 37°C, cells were exposed to various concentrations of flutamide, melatonin, and combination for 2 days. Incubation in darkness for 15 min at 37°C was done after the addition of PI and Annexin-V, and then cells were analyzed by flow cytometry device.
Staining of treated and control cells with Hoechst dye (33342)
Apoptosis was further assessed by the Hoechst staining method. Both cell lines were implanted in 24-well plates (3 × 10⁵ cells per well), and incubated with various concentrations of flutamide, melatonin, and combination for 48 h. Cells were treated with cold methanol (50 µL) for 20 min. After centrifugation, pellets were incubated with 100 µL PBS and 4 µL Hoechst dye for 20 min at 25°C in darkness, then observed under a fluorescence microscope (100× magnification).
Migration potential analysis by scratch-wound assay
A vertical scratch was applied via pipette tip to the confluent PC3 and LNCaP cells (about 85% confluency) and the plates were washed with serum-free medium twice. After overnight serum starvation, control and experimental groups were exposed to PBS and quercetin, respectively. Finally, cell imaging was performed at 24 h intervals. The cell migration rate was estimated by measurement of area among the two scratch edges in comparison to the control group.
DNA cell cycle analysis
Quercetin-treated (48 h) and untreated cells were fixed using 70% cold ethanol for 24 h. After double washing with PBS, cells were incubated with RNase I and 500 µL PI for 30 min at 37°C. Cell detection was performed by flow cytometer. Flow jo software was used to analyze the data. Cell arrest at sub-G0/G1 was considered apoptosis.
Gene expression analysis by real-time PCR
Total RNA extraction was performed using Tri Pure Isolation Reagent. Colibri Microvolume Spectrometer was used to determine the RNA concentration. cDNA was generated using a Takara cDNA synthesis kit. Real-time PCR was performed using QIAGEN’s thermocycler with a total sample volume of 20 µL. The PCR reaction specificity confirmation was applied through melting curve analysis. GAPDH mRNA levels were considered as an internal control to estimate the relative expression levels by the 2−ΔΔCT method. Table 1 represents the nucleotide sequences of primers.
Primer Sequences of Target and Normalizer Genes
KLK3, kallikrein-related peptidase 3.
Statistical analysis
All experiments were performed in triplicate and the data were presented as means ± SD. Statistical analysis was performed by Analysis of variance (ANOVA) and Student’s t-test. Statistical significance was considered as *p < 0.05, **p < 0.01, ***p < 0.001, and ****p < 0.0001.
Morphological changes
Quercetin-related alterations in the morphology of prostate cancer cell lines were observed through an inverted microscope (Fig. 1). Cells underwent modifications such as membrane protrusion, shrinkage, and rounding, indicating that flutamide, melatonin, and combination can prompt apoptosis in malignant prostate cells. Also, a significant decrease in the number of colonies commends that flutamide, melatonin, and combination can effectively inhibit cellular proliferation (Fig. 2).

Dose–response effects of flutamide and melatonin, alone and in combination at 24, 48, and 72 h after treatment using the indicated concentrations of flutamide

Morphological changes in prostate cancer cell lines. Representative phase-contrast micrographs show the morphological effects of melatonin, flutamide, and their combination on LNCap, DU145, and PC3 prostate cancer cells after 48 h of treatment. Scale bar: 100 μm.
Flutamide, melatonin, and combination prevent cell viability of PC3 and LNCaP cell lines in a time- and dose-dependent manner
In both cell lines, the cytotoxic effects of flutamide, melatonin, and combination (0–25 µM) were studied and the antiproliferative properties of this phytochemical were evaluated by MTT assay (Fig. 3). IC50 values were determined as 20 and 10 µM for PC3 and LNCaP, respectively. Flutamide, melatonin, and combination significantly exerted cytotoxicity on cancer cells in dose- and time-dependent manners.
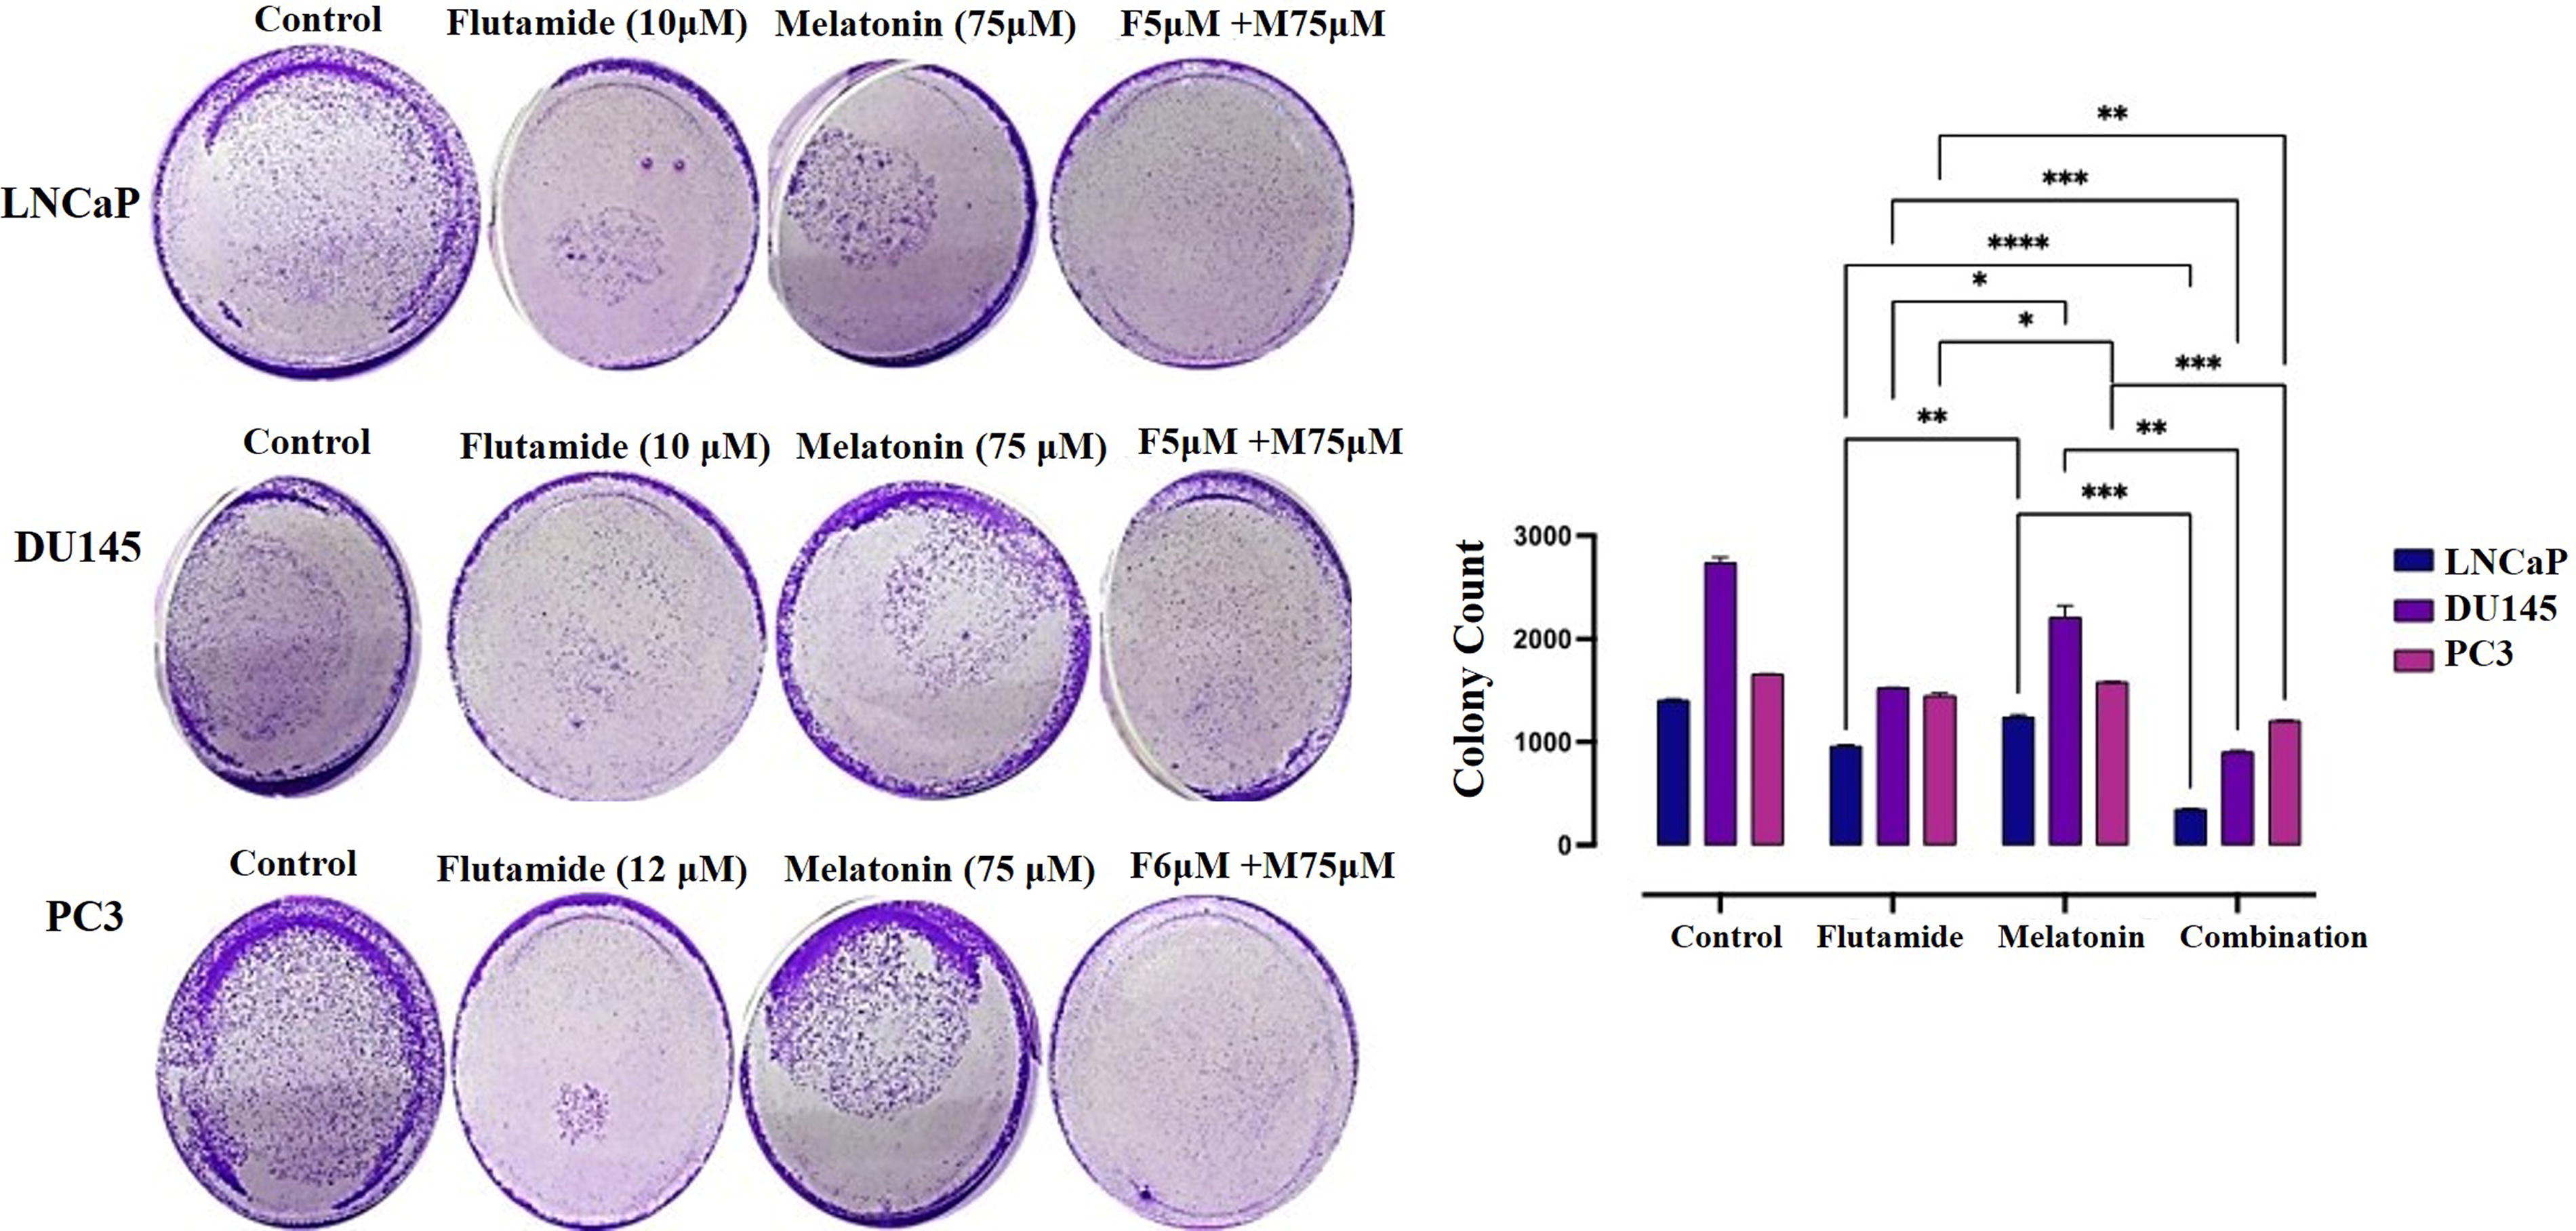
Inhibition of colony formation in prostate cancer cell lines by melatonin and flutamide treatment. The bar graph represents the percentage of colonies formed relative to the untreated control. Data are presented as mean ± SEM from three independent experiments.
Effects of flutamide, melatonin, and combination on the programmed cell death (apoptosis)
Annexin-V/PI staining was executed to determine whether melatonin can prompt apoptosis of prostate cancer cell lines. Flutamide, melatonin, and combination exposure for 48 h augmented the rate of apoptotic cell death (p < 0.01), indicating that flutamide, melatonin, and combination could ameliorate apoptosis in prostate carcinoma in vitro (Fig. 4).
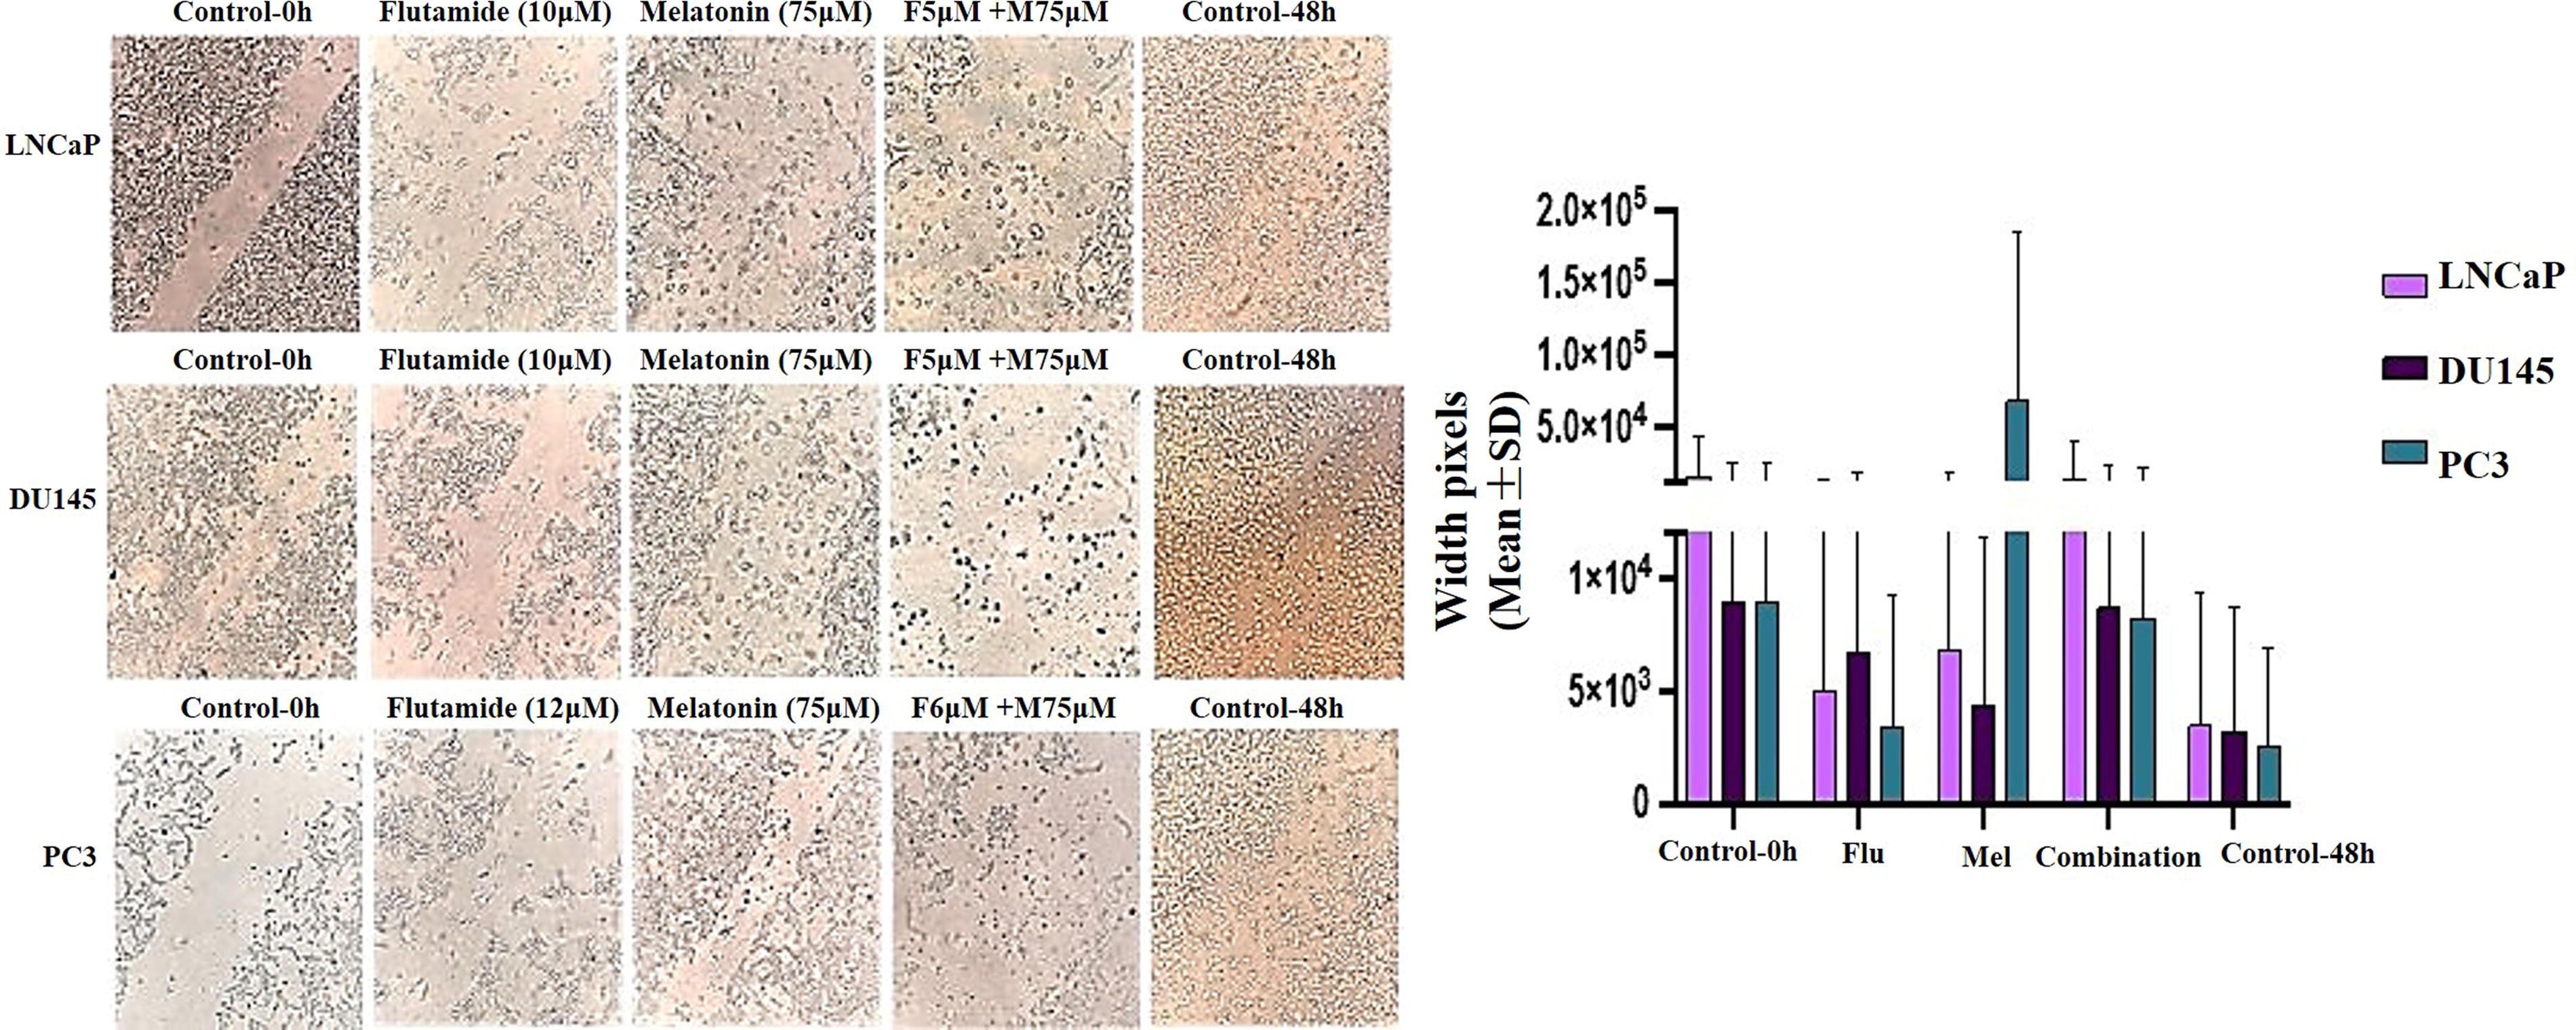
Inhibition of cell migration in prostate cancer cell lines by melatonin and flutamide treatment. The images show the migratory patterns of cells in the respective treatment groups compared to the untreated control. Data are presented as mean ± SEM from three independent experiments. Statistical significance was determined using one-way ANOVA with Dunnett’s multiple comparison test. Scale bar: 200 μm.
Flutamide, melatonin, and a combination arrested prostate cancer cells at sub-G1/G1 phase
The impact of flutamide, melatonin, and combination on cell cycle arrest of prostate cancer cell lines was assessed by flow cytometry analysis (Fig. 4). Our data revealed a significant increase in the proportion of both cell lines arrested at the sub-G1/G1 phase in a dose-dependent manner. Posttreatment accumulation of cells at sub-G1 phase can be considered as a demonstration of apoptosis. Therefore, our results indicated that quercetin-related arrest of the cell cycle eventually led to apoptosis compared to the control group (Fig. 5).
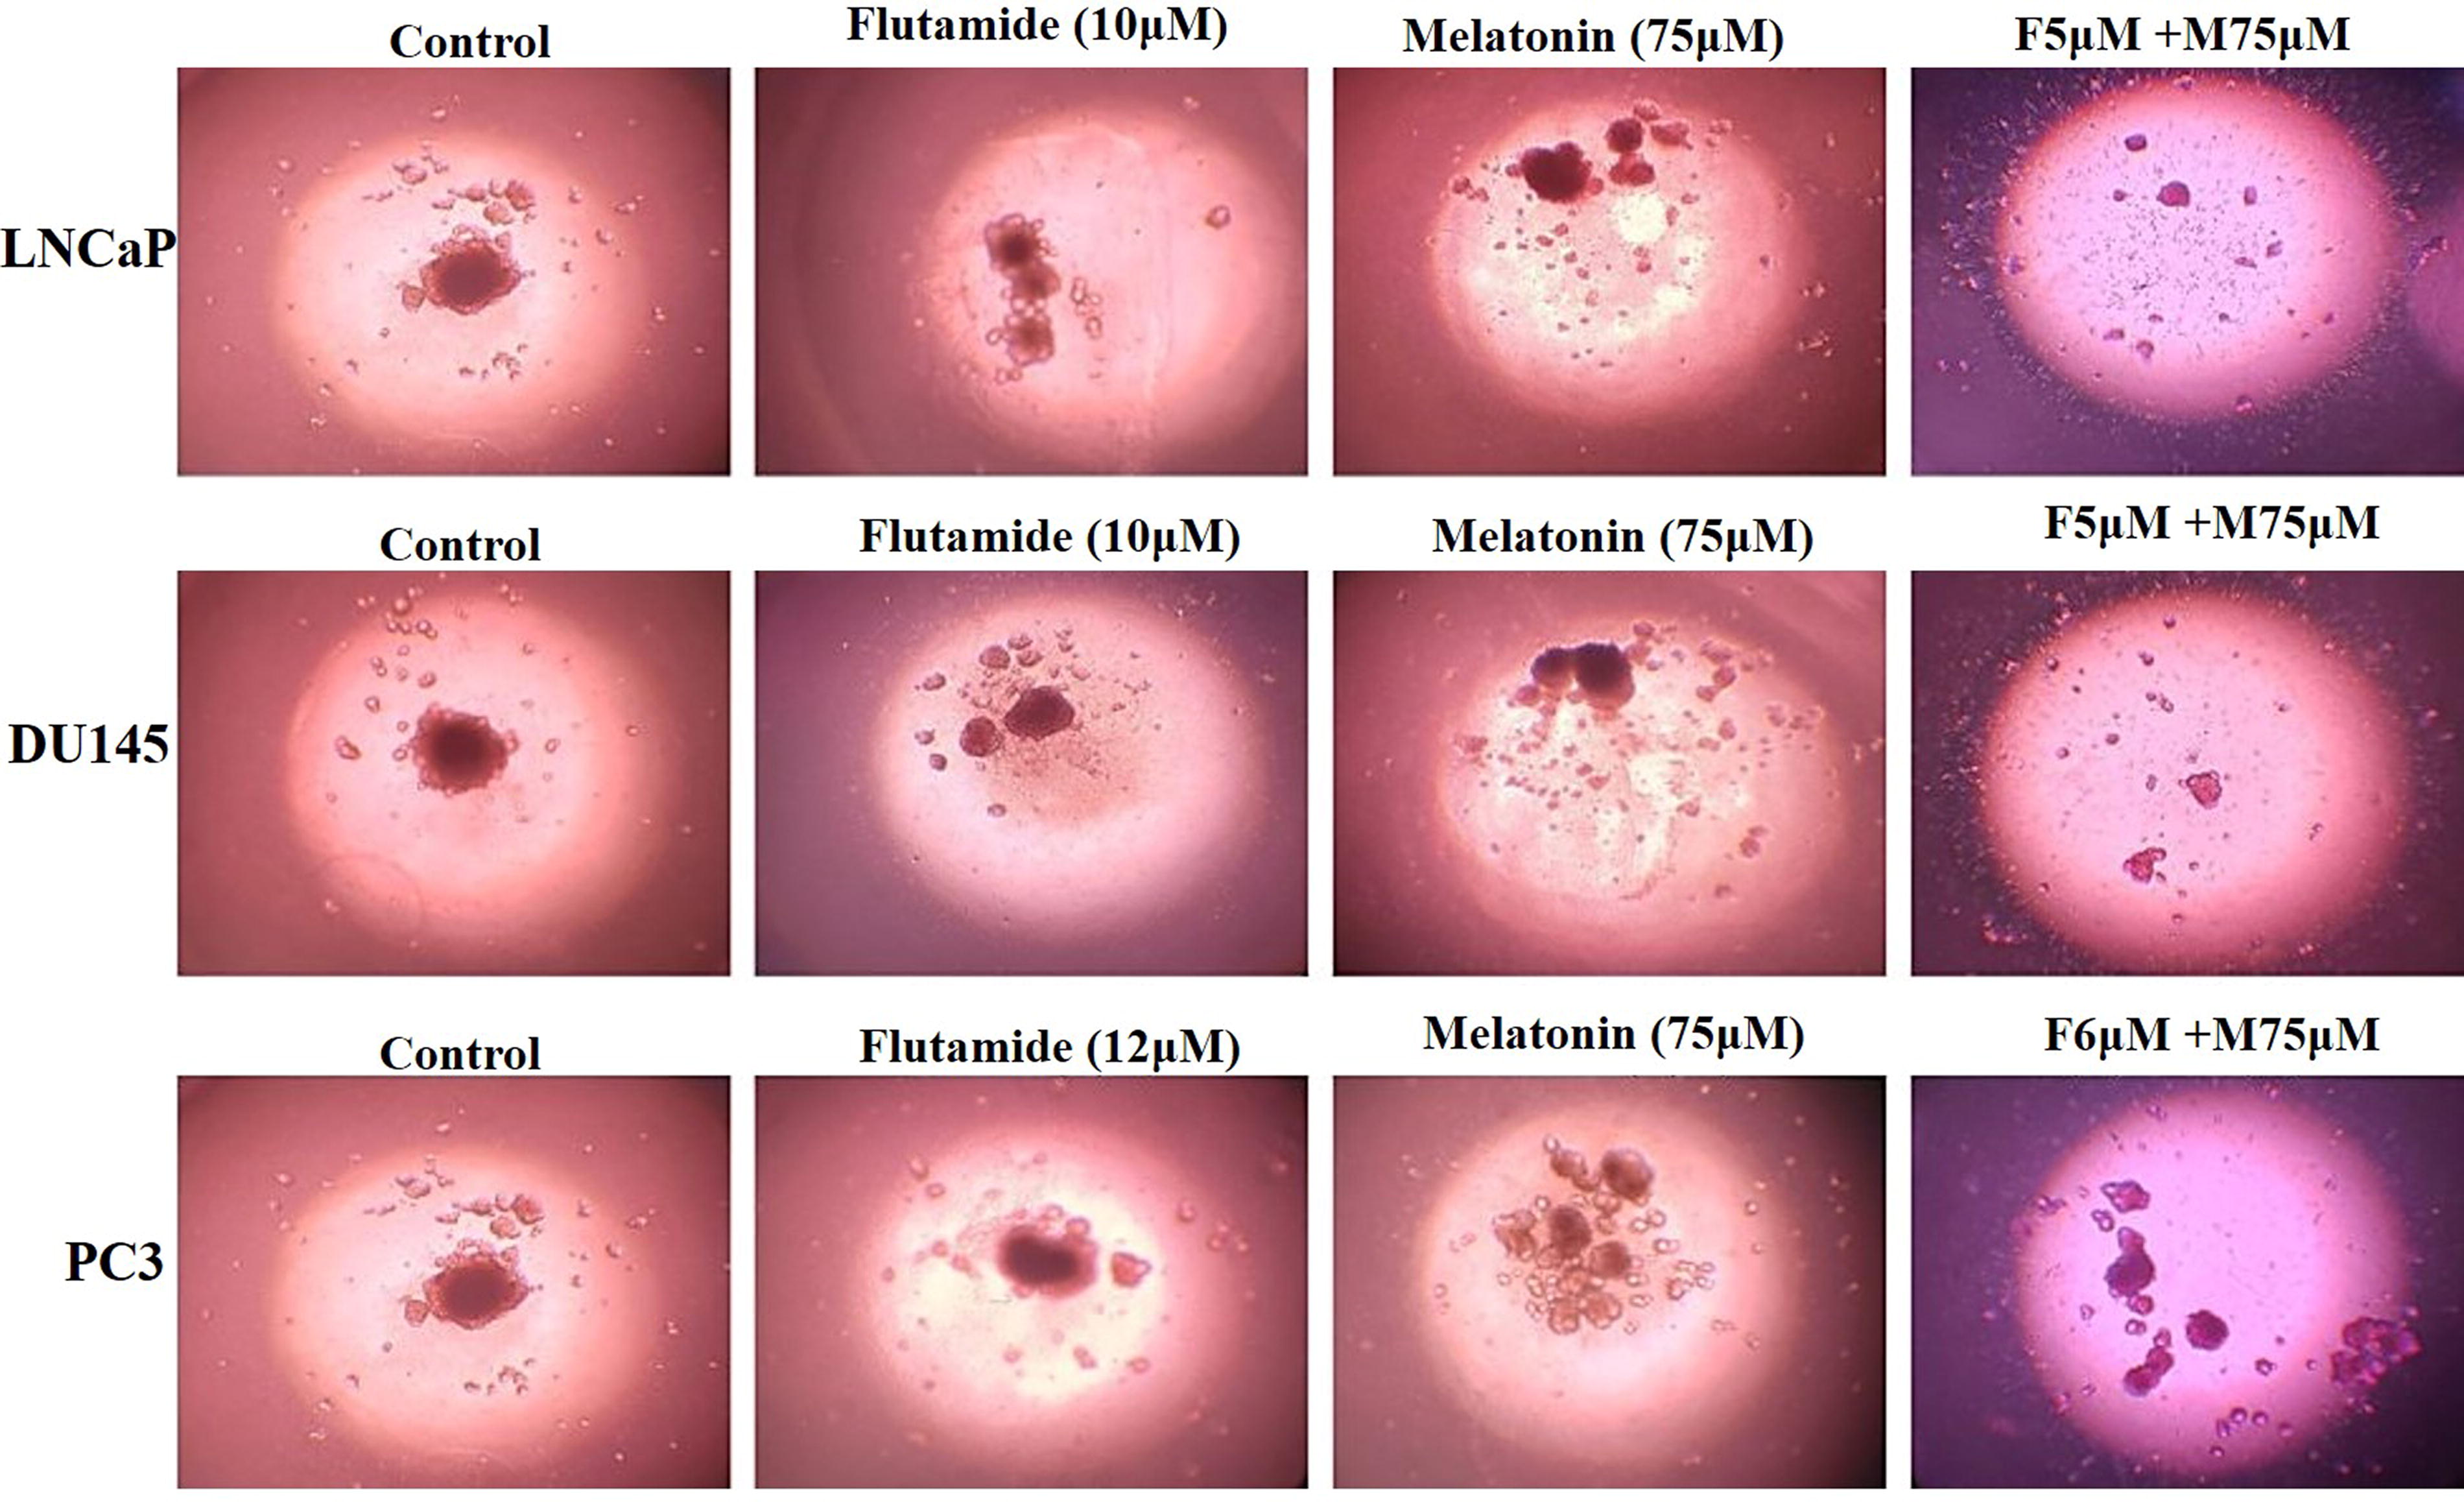
Three-dimensional assessment using spheroids. Spheroids were developed from LNCaP, DU145, and PC3 prostate cancer cell lines, which were cultured in a coated 96-well plate and treated with melatonin, flutamide, and a combination of melatonin and flutamide. On day 2, the spheroids were stained and examined using an inverted microscope, with images captured at a magnification of 100×.
Effects of flutamide, melatonin, and combination on nucleus and cellular migration
Fluorescent staining with Hoechst 33342 demonstrated significant variations in the nuclei morphology upon flutamide, melatonin, and combination treatment (Fig. 6). Dispersed nuclear contents observed under the fluorescent microscope represent apoptosis. In addition, flutamide, melatonin, and combination have intensely interdicted PC3 cell migration after flutamide, melatonin, and combination treatment (20 µM) (Fig. 7).

Melatonin and flutamide individually and in combination significantly inhibited invasion after 48 h.
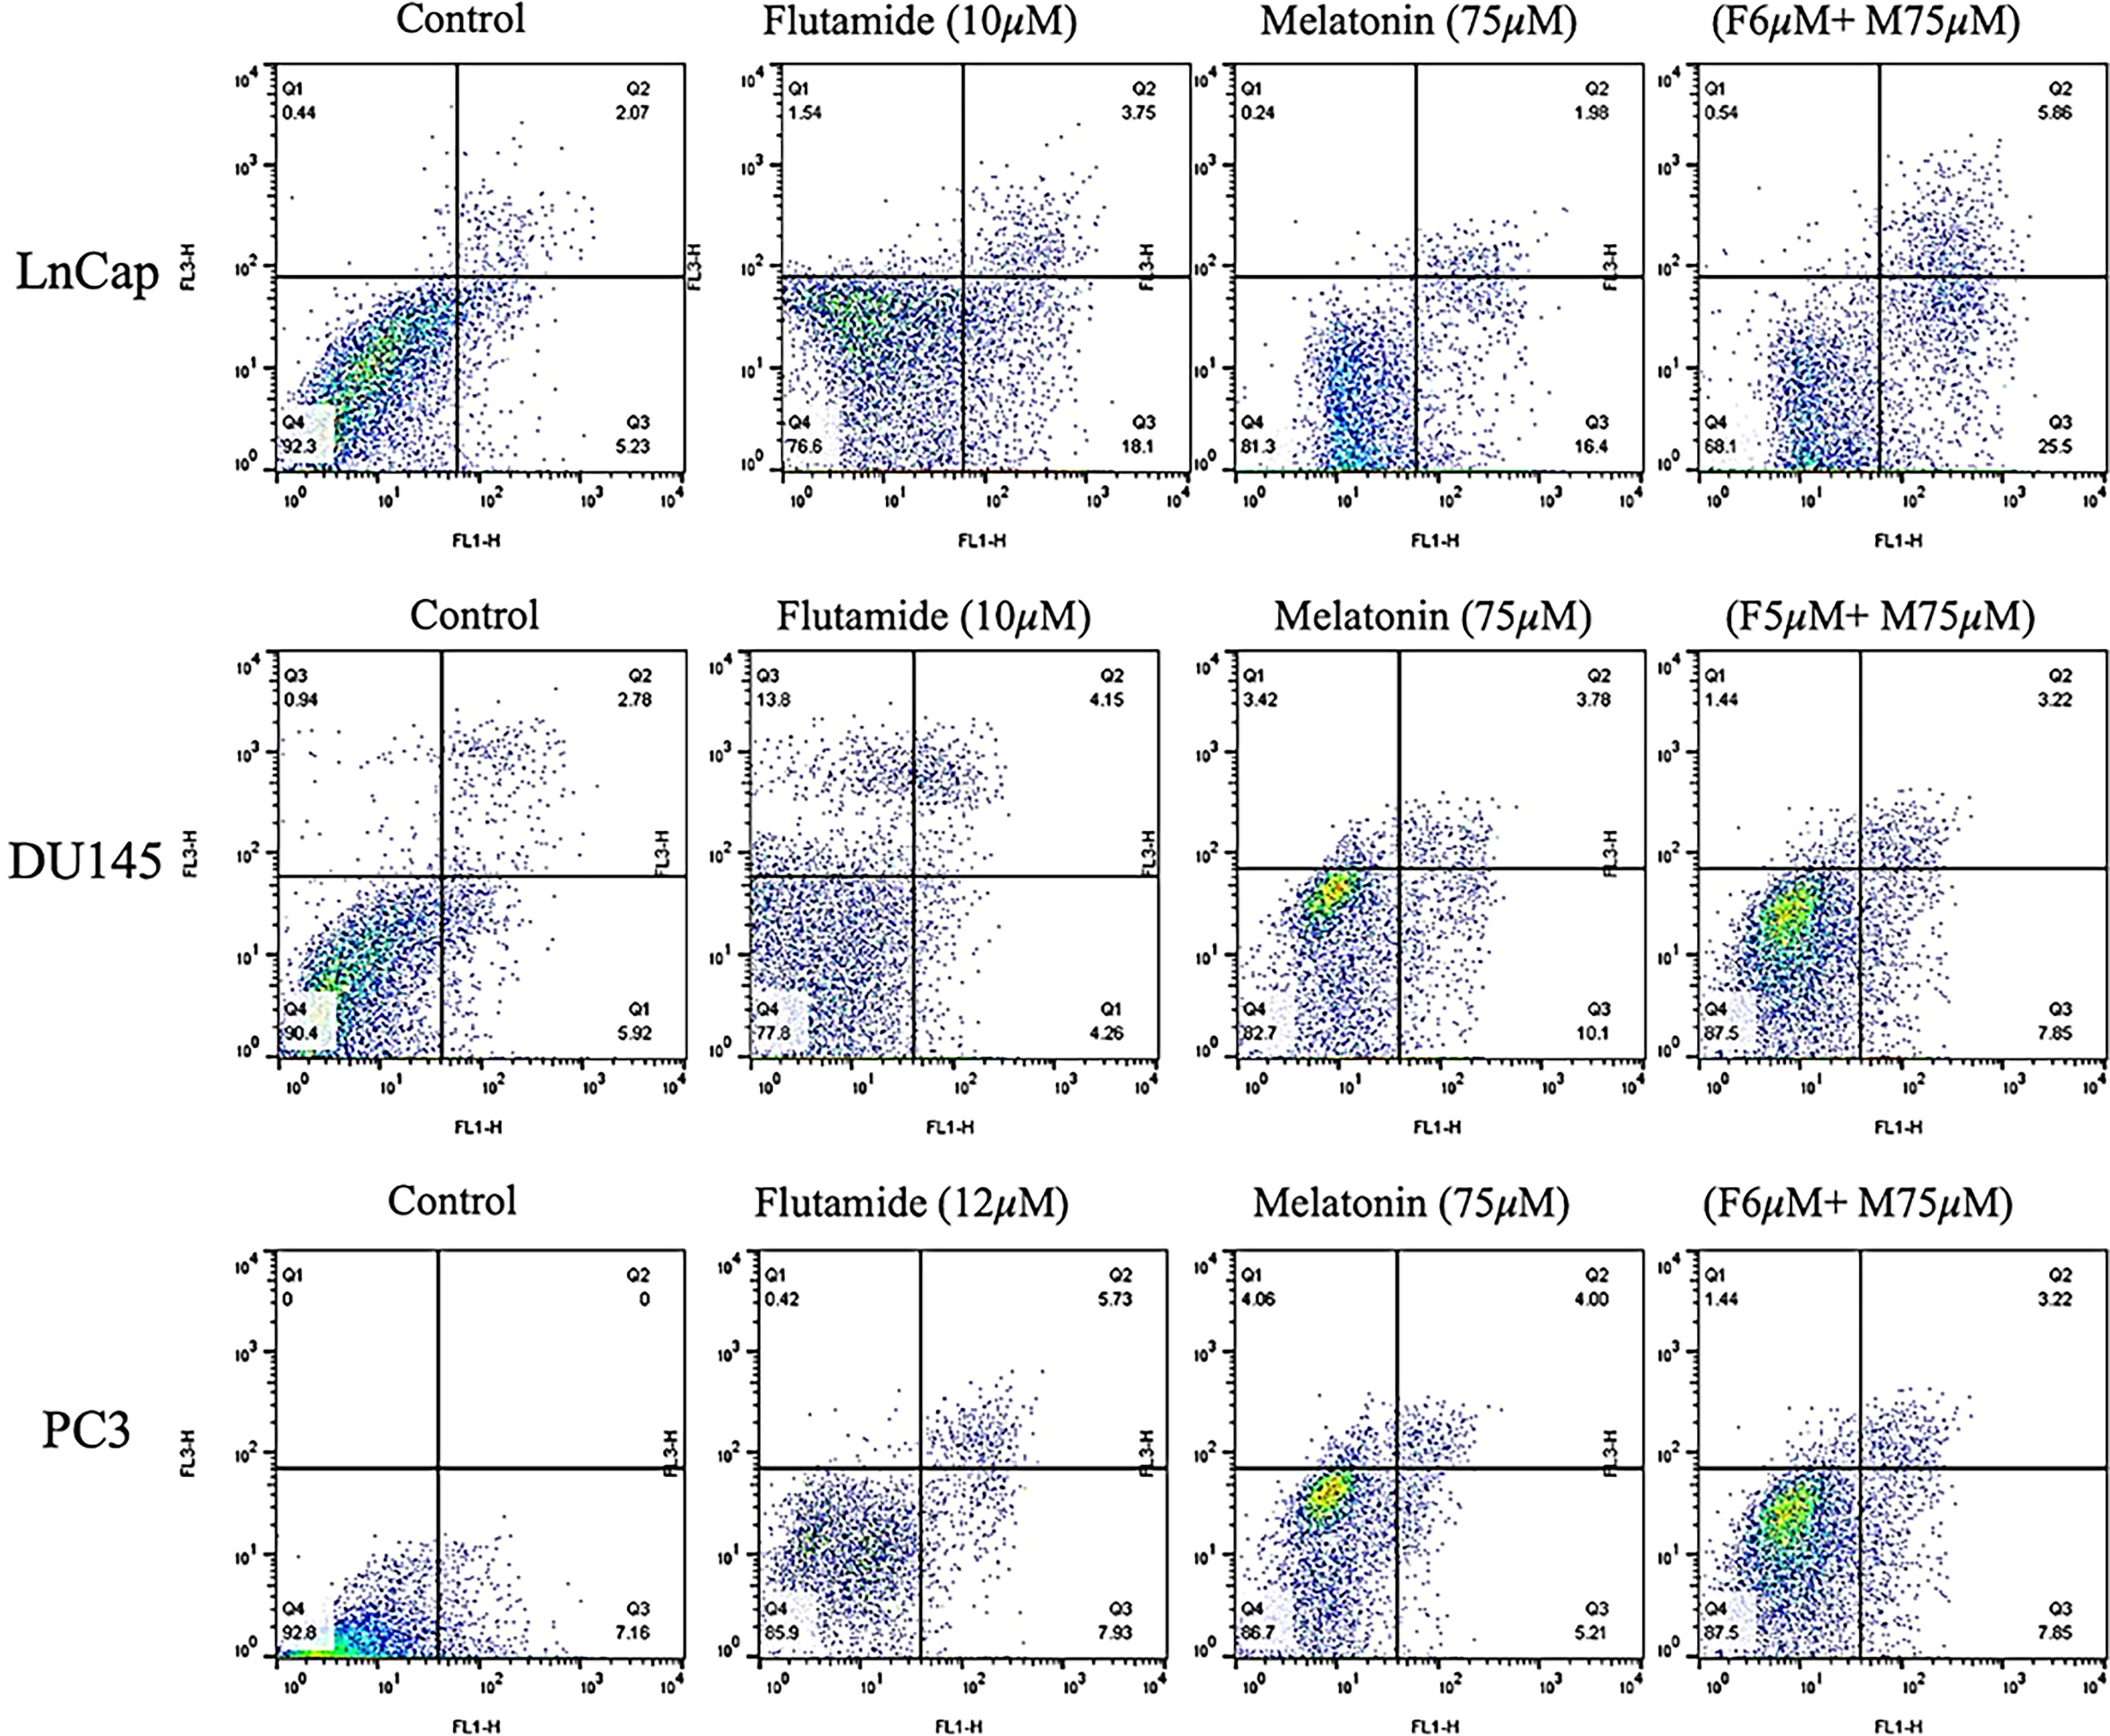
Flow cytometric analysis of LNCaP, DU145, and PC3 cells necrosis, apoptosis, and viability using Annexin-V-Flous.
Flutamide, melatonin, and combination treatment alters the gene expression profile of LNCaP and PC3 cells
Both flutamide and melatonin-treated cell lines (48 h) were studied using real-time PCR for evaluation of VEGFC as angiogenesis-related markers, kallikrein-related peptidase 3 as a prognostic marker for prostate cancer risk.
Results
MTT assay
The cell viability assays were performed on three different prostate cancer cell lines, LNCaP, DU145, and PC3, to evaluate the efficacy of melatonin and flutamide, both individually and in combination. The results demonstrated a dose-dependent decrease in cell viability across all three cell lines when treated with increasing concentrations of either melatonin or flutamide alone. Notably, the combination therapy of melatonin (75 µM) and flutamide (5 and 6 µM) exhibited a synergistic effect, leading to a more significant reduction in cell viability compared to either drug alone. The IC50 doses, indicated by stars (*) in the figure, represent the concentrations at which cell viability was reduced by 50% (Fig. 1). In all three cell lines, the IC50 dose for melatonin alone was approximately 75 µM, while for flutamide alone, it was around 10 µM for LNCaP and DU145 cell lines and 12 µM for the PC3 cell line. However, when combined with melatonin (75 µM), the IC50 dose for flutamide decreased to 6 µM for LNCaP and PC3 cell lines at 48 h. Similarly, for the DU145 cell line, the combination of melatonin (75 µM) and flutamide (5 µM) exhibited a remarkable synergistic effect, reducing cell viability by 50% at 48 h (Fig. 1).
Evaluation of cell morphology
The morphological examination of prostate cancer cell lines, LNCaP, DU145, and PC3, was performed to evaluate the effects of melatonin and flutamide, both individually and in combination, on cellular morphology. The control cells exhibited a typical morphology, with adherent and well-spread cells. In the LNCaP cell line, treatment with flutamide (10 µM) or melatonin (75 µM) alone resulted in a reduction in cell density and altered cell morphology, with cells appearing more rounded and detached from the surface. However, the combination of flutamide (6 µM) and melatonin (75 µM) induced more pronounced morphological changes, with a substantial decrease in cell density and the presence of numerous detached and shrunken cells, indicative of cell death. Similar observations were made in the DU145 cell line, where flutamide (10 µM) or melatonin (75 µM) alone led to a decrease in cell density and altered cell morphology. The combination of flutamide (5 µM) and melatonin (75 µM) resulted in a more significant reduction in cell density, with the majority of cells appearing detached and exhibiting a shrunken morphology, consistent with cell death. In the PC3 cell line, treatment with flutamide (12 µM) or melatonin (75 µM) alone caused a decrease in cell density and altered cell morphology. However, the combination of flutamide (6 µM) and melatonin (75 µM) had a more profound effect, with a substantial reduction in cell density and the presence of numerous detached and shrunken cells, indicative of cell death (Fig. 2).
Evaluation of colony formation
The colony formation assay was performed to assess the long-term effects of melatonin and flutamide, both individually and in combination, on the clonogenic potential of prostate cancer cells. The results revealed a significant reduction in colony formation across all three cell lines (LNCaP, DU145, and PC3) upon treatment with melatonin or flutamide alone, compared to the untreated control cells. In the LNCaP cell line, treatment flutamide (10 µM) alone resulted in a reduction of colony formation with a significant difference (p < 0.05), when compared to melatonin. Notably, the combination treatment of melatonin (75 µM) and flutamide (6 µM) exhibited a remarkable synergistic effect, leading to substantial suppression of colony formation, with less than 10% of colonies remaining compared to each group of flutamide (p < 0.001) or melatonin (p < 0.0001). Similar trends were observed in the DU145 cell line, where melatonin (75 µM) or flutamide (10 µM) alone reduced colony formation. The combination of melatonin (75 µM) and flutamide (5 µM) resulted in the inhibition of colony formation, with less than 5% of colonies remaining compared to flutamide (p < 0.0001) or melatonin (p < 0.001). In the PC3 cell line, treatment with melatonin (75 µM) or flutamide (12 µM) alone decreased colony formation to approximately 60% and 50%, respectively. Moreover, the combination of melatonin (75 µM) and flutamide (6 µM) also exhibited a synergistic effect, leading to a substantial reduction in colony formation, with less than 10% of colonies remaining compared to flutamide (p < 0.001) or melatonin (p < 0.0001) group (Fig. 3).
Effects of flutamide and melatonin on the migration of the prostate cancer cells
The migration assay was performed to evaluate the effects of melatonin and flutamide, both individually and in combination, on the migratory potential of prostate cancer cells. The results demonstrated a significant reduction in cell migration across all three cell lines (LNCaP, DU145, and PC3) upon treatment with melatonin or flutamide alone, compared to the untreated control group. However, the combination treatment exhibited a synergistic effect, leading to a more pronounced inhibition of cell migration. In the LNCaP cell line, treatment with flutamide (10 µM) or melatonin (75 µM) alone resulted in a significant reduction in cell migration by approximately 40% and 30%, respectively, compared to the control group. Notably, the combination of flutamide (5 µM) and melatonin (75 µM) led to a substantial suppression of cell migration, with a reduction of approximately 80% compared to the control. Similar trends were observed in the DU145 cell line, where flutamide (10 µM) or melatonin (75 µM) alone significantly reduced cell migration by approximately 30% and 25%, respectively. However, the combination of flutamide (5 µM) and melatonin (75 µM) exhibited a synergistic effect, resulting in a remarkable inhibition of cell migration by approximately 75% compared to the control group. In the PC3 cell line, treatment with flutamide (12 µM) or melatonin (75 µM) alone significantly decreased cell migration by approximately 35% and 25%, respectively. Notably, the combination of flutamide (6 µM) and melatonin (75 µM) led to a substantial reduction in cell migration, with an inhibition of approximately 70% compared to the untreated control (Fig. 4).
3D spheroid assay
The spheroid assay was conducted to evaluate the effects of various treatments on cellular morphology and organization. The control images across all cell lines (LNCaP, DU145, and PC3) display well-formed spheroids with a compact and spherical structure, indicating the typical morphology of untreated cells in this assay. Upon treatment with flutamide (10 µM), the spheroids exhibited distinct alterations in their structure and organization. In the LNCaP and DU145 cell lines, the spheroids appeared less compact, with increased cell dispersion and a more disorganized structure compared to the control. The PC3 cell line also showed disruption of the spheroid structure, though to a lesser extent than the other two cell lines. These observations suggest that Erlotinib treatment has a significant impact on cellular organization and spheroid integrity.
The effects of melatonin (75 µM) and the combination treatment (flutamide + melatonin) were also evaluated. In the presence of melatonin, the spheroids maintained a relatively compact structure across all cell lines, although some cell dispersion was observed compared to the control. The combination treatment resulted in marked disruption of the spheroid structure, with significant cell dispersion and loss of organization, particularly evident in the LNCaP and DU145 cell lines. These findings indicate that the combination treatment may have a synergistic effect on disrupting cellular organization and spheroid integrity (Fig. 5).
Invasion test results
According to the graphical representation of the invasion assay results, control conditions for all three cell lines (PC3, LNCaP, and DU145) likely show a high level of invasion, as indicated by the dense staining or intensity in the respective regions. Treatment with melatonin seems to reduce the invasive or migratory potential of the prostate cancer cell lines compared to the control, as evidenced by the decreased staining or intensity in the corresponding regions. Similar to melatonin, flutamide treatment appears to inhibit the invasion or migration of the prostate cancer cell lines, with a reduction in staining or intensity observed. The combination of melatonin and flutamide shows the most substantial reduction in invasion or migration for all three cell lines, as indicated by the lowest staining or intensity levels in the respective regions (Fig. 6).
Findings of cell apoptosis changes by flow cytometry
Flow cytometric assay was conducted to evaluate the impact of melatonin’s and flutamide’s IC50s on LNCaP, DU145, and PC3 cells. Figure 8 represents the analyzed result of apoptosis evaluations in control, melatonin alone, flutamide alone, and their combination, following 48-h. Introducing prostate cancer cells to drugs, melatonin or flutamide, led to significant apoptosis augmentation. Although, in all three cell lines, the combination therapy of melatonin and flutamide was the most effective treatment, interestingly, melatonin alone showed promising effects on LNCaP cells. Necrosis, apoptosis (early and late), and viability rate of each group are illustrated in Figure 7.
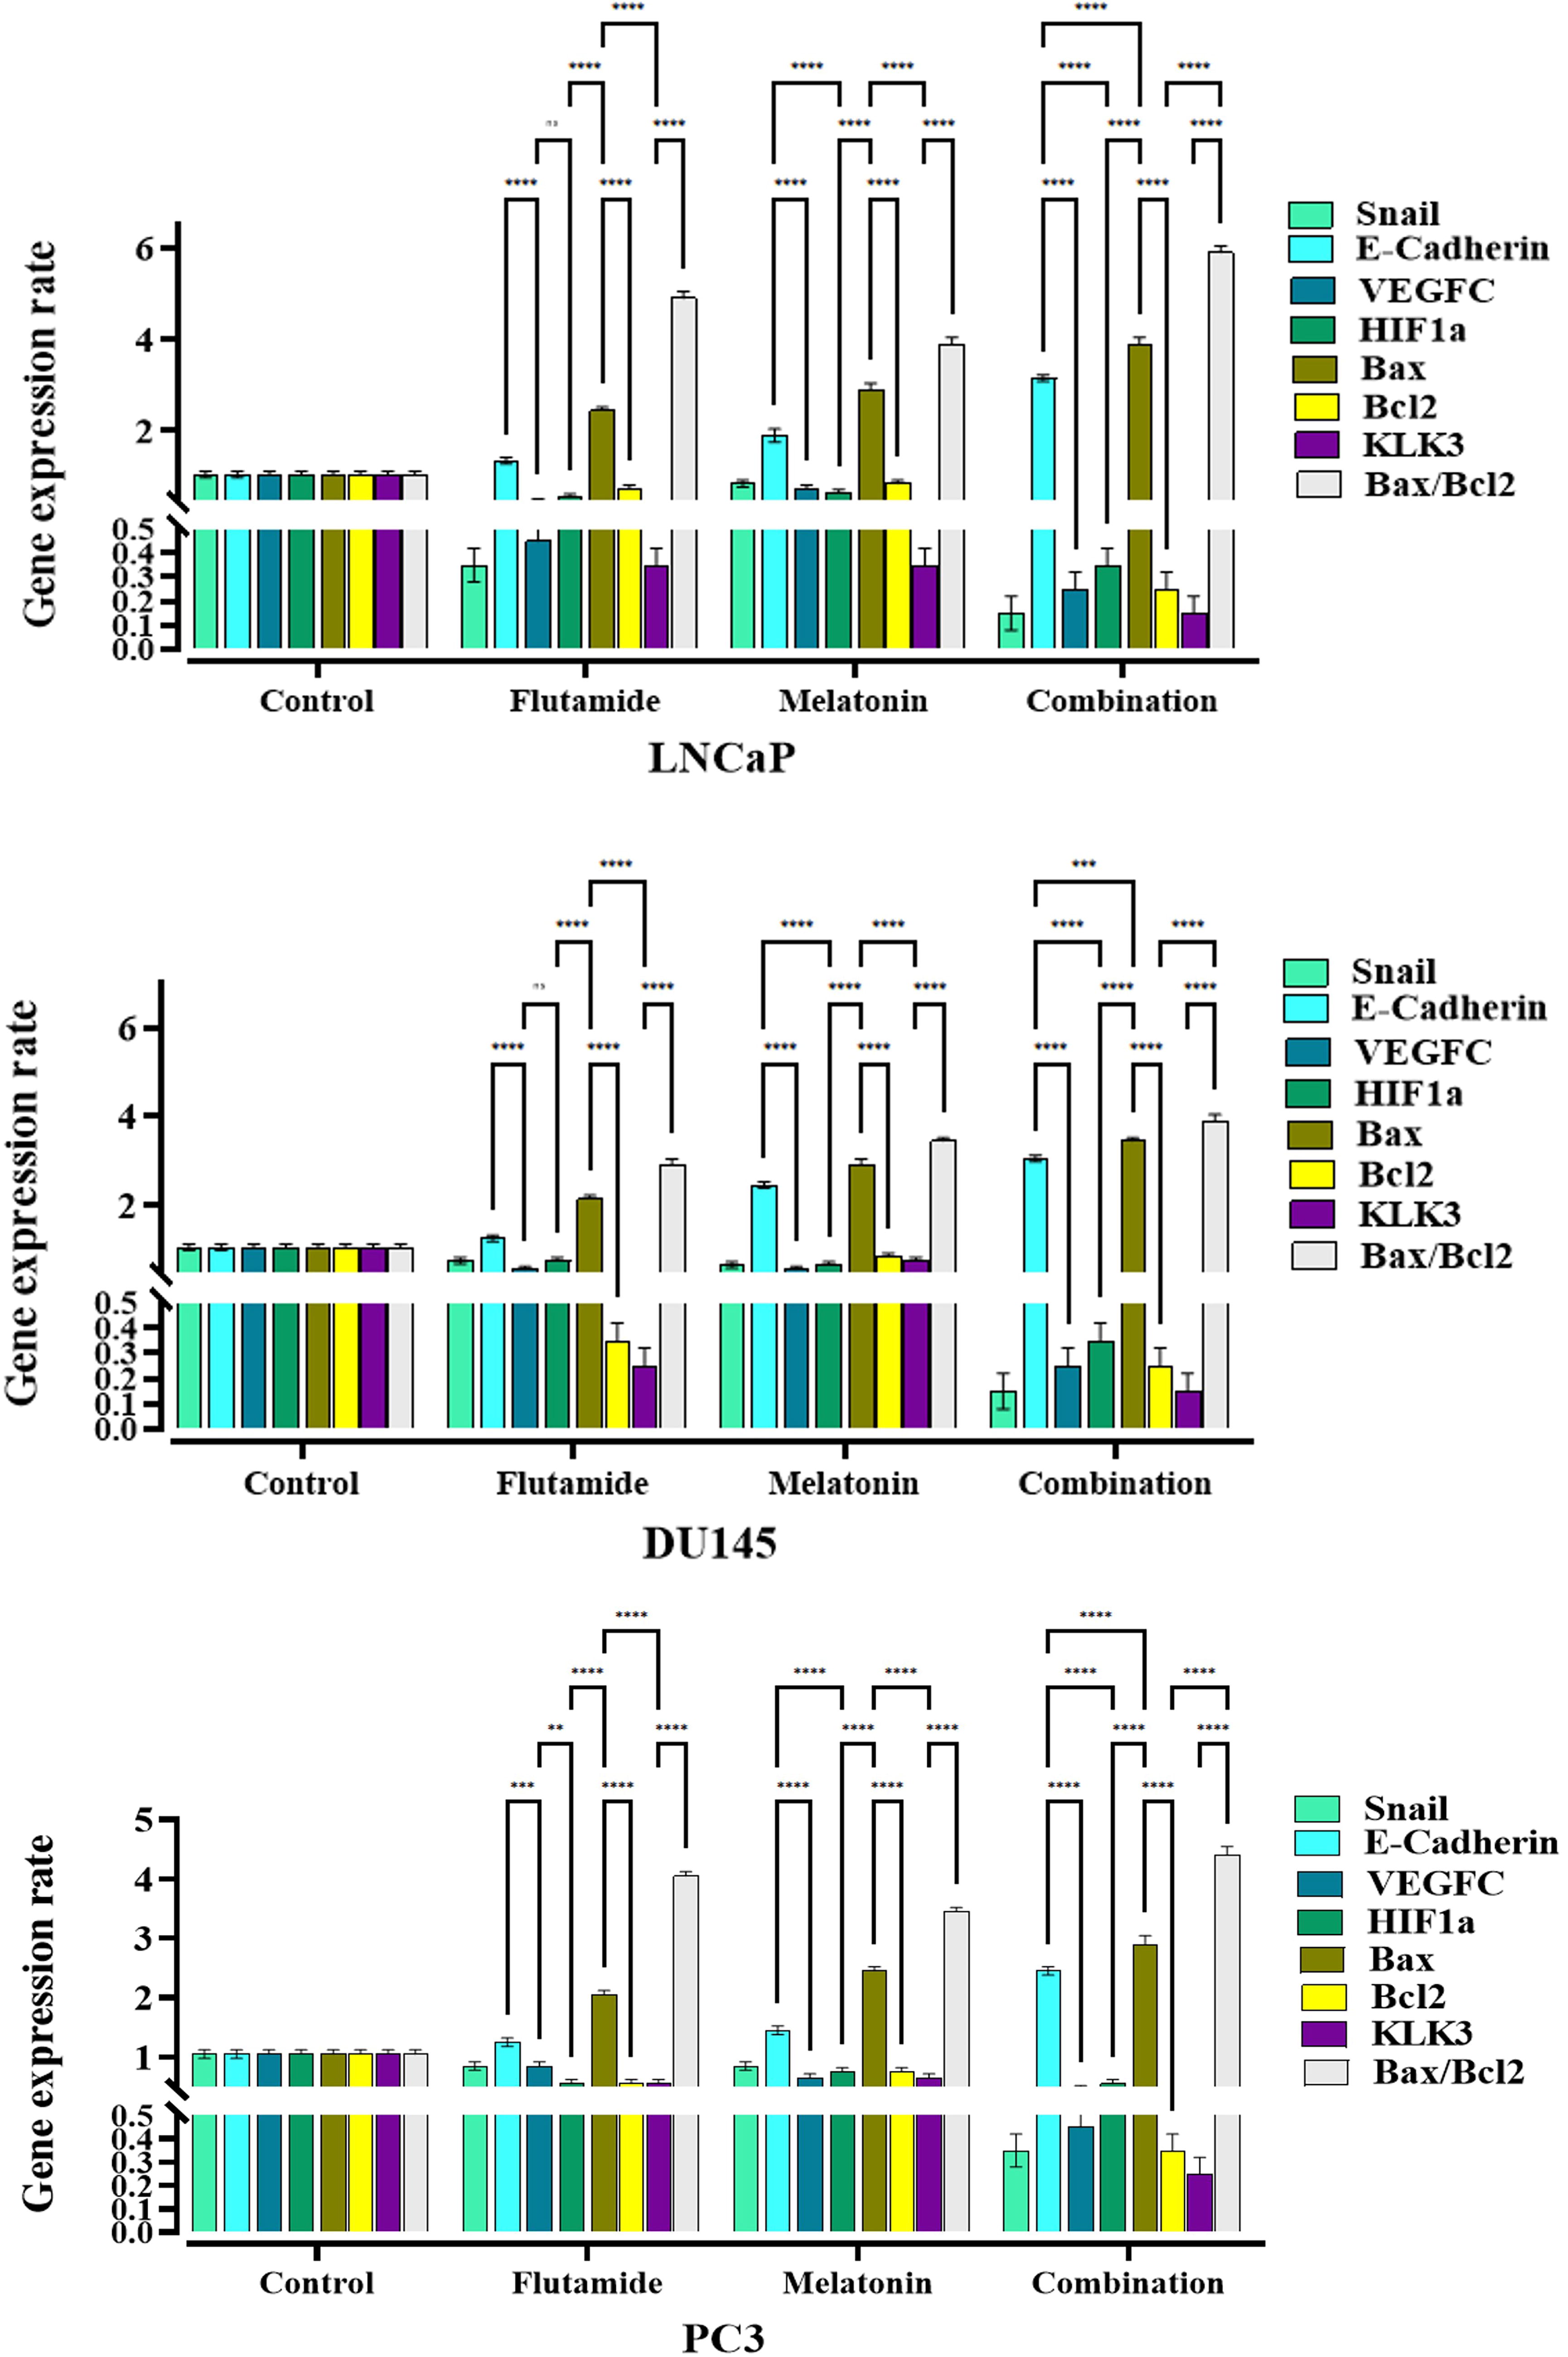
The fold change results of mRNA level of genes in LNCaP, DU145, and PC3 prostate cancer cells following 48-h treatment with melatonin, flutamide, and melatonin plus flutamide. Comparing the combination groups with drugs alone treatments was performed using GraphPad Prism software version 9, and the statistically significant changes are indicated by star signs.
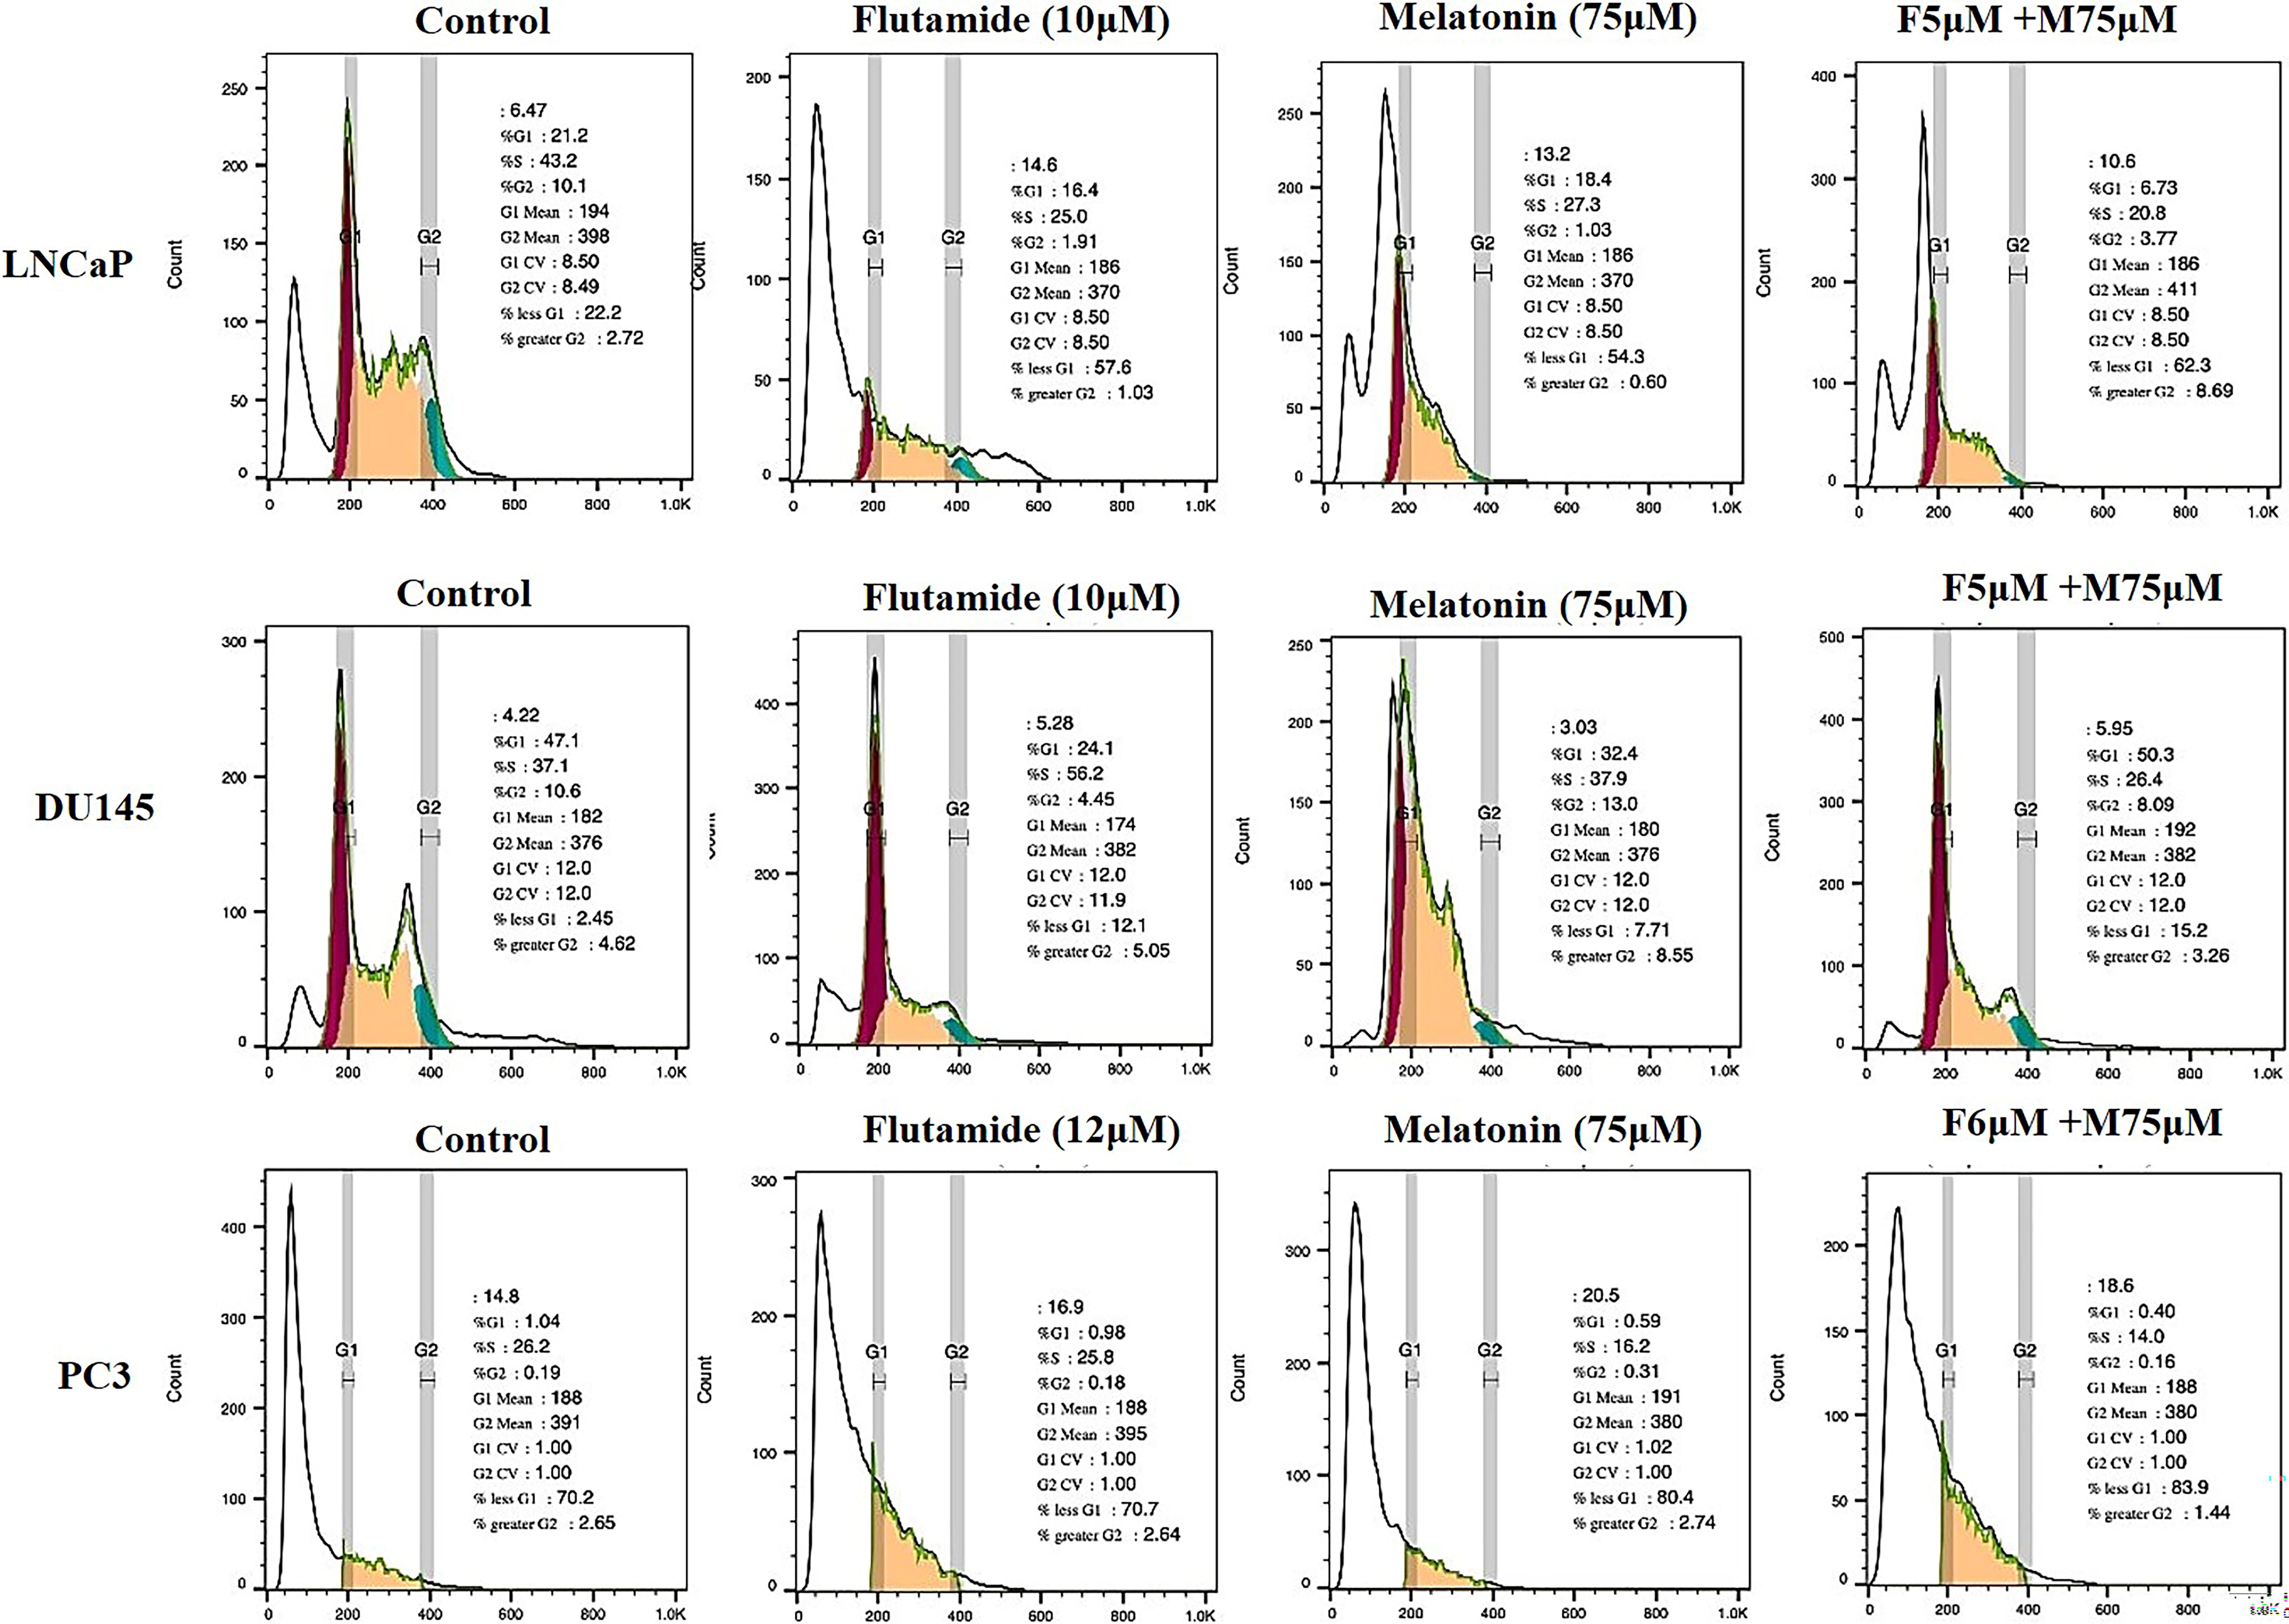
Findings of cell cycle changes by flow cytometry
Cell cycle flow cytometry assessment was undertaken to analyze the effect of the drugs’ IC50s on cell cycle arrests of LNCaP, DU145, and PC3 cells. Our findings showed that in all three cell lines, cell arrest was observed in the G1/S phase in LNCaP and DU145 and the G1/S phase in PC3 (Fig. 9).
Cell cycle analysis of LNCaP, DU145, and PC3. Cell accumulation in the sub-G1 phase indicates the increased rate of apoptosis.
Gene expression profiles across experimental groups
The gene expression analysis revealed distinct patterns across the three experimental groups evaluated. Significant differences in expression levels were observed for multiple genes, as indicated by the starred symbols denoting statistical significance levels (Fig. 8).
LNCaP cell lines exhibited significantly higher expression levels for a subset of genes compared to the other groups. Notably, the genes represented by the yellow bars showed substantially elevated expression in this group (p < 0.001 for most genes, indicated by ***). This unique expression profile suggests a potential regulatory mechanism or functional pathway specific to Group 1 that may be driving the upregulation of these particular genes. In the DU145 cell line, a different set of genes (represented by the green bars) displayed significantly higher expression levels compared to groups LNCaP and PC3 (p < 0.01 for most genes, indicated by **). This distinct expression pattern implies that Group 2 may be characterized by the activation or involvement of alternative molecular pathways or biological processes associated with the upregulated genes. PC3 demonstrated a unique gene expression profile, with a distinct subset of genes (represented by the purple bars) showing significantly elevated expression levels compared to groups 1 and 2 (p < 0.001 for most genes, indicated by ***). This distinctive expression signature suggests that Group 3 may be influenced by specific regulatory mechanisms or functional pathways related to the upregulated genes, potentially distinct from the other groups.
Across the three groups, multiple genes exhibited statistically significant differences in expression levels, as denoted by the starred symbols (p < 0.05 [*], p < 0.01 [**], p < 0.001 [***], and p < 0.0001 [****] compared to other groups). These significant differences highlight the potential for distinct molecular profiles and biological processes associated with each group, driven by the differential expression of specific genes or gene sets.
Discussion
The primary objective of this study was to investigate the effects of melatonin and flutamide, both individually and in combination, on various cellular processes and properties of prostate cancer cells (LNCaP, DU145, and PC3). The results of our research demonstrated a dose-dependent decrease in cell viability across the cell lines when treated with increasing concentrations of melatonin or flutamide alone. Notably, the combination of melatonin (75 µM) and flutamide (5–6 µM) exhibited a synergistic effect, leading to a more significant reduction in cell viability compared to either drug alone. Also, we observed that treatment with melatonin or flutamide alone resulted in altered cell morphology, with cells appearing rounded and detached from the surface. However, the combination treatment induced more pronounced morphological changes, including a substantial decrease in cell density and the presence of numerous detached and shrunken cells, indicative of cell death. Melatonin or flutamide alone significantly reduced colony formation across all three cell lines compared to untreated control cells. Notably, the combination treatment exhibited a remarkable synergistic effect, leading to a substantial suppression of colony formation, with less than 10% of colonies remaining compared to each drug alone. Treatment with melatonin or flutamide alone significantly reduced cell migration across all three cell lines. However, the combination treatment exhibited a synergistic effect, resulting in a more pronounced inhibition of cell migration, with a reduction of approximately 70–80% compared to the control group. Melatonin or flutamide alone induced apoptosis, as evidenced by cells with condensed and fragmented nuclei. Our result showed that the combination treatment led to a substantial increase in the number of apoptotic cells displaying condensed and fragmented nuclei, indicating enhanced apoptosis. The flow cytometry analysis revealed significantly higher levels of total apoptosis in the combination treatment group compared to melatonin or flutamide alone across all three cell lines. The most significant and novel finding of this study is the synergistic effect observed when melatonin and flutamide were combined, resulting in enhanced anticancer effects, including reduced cell viability, inhibition of colony formation and migration, and increased apoptosis, compared to either drug alone.
The observed effects of melatonin and flutamide, both individually and in combination, align with previous literature demonstrating their anticancer properties in prostate cancer cells (Megerian et al., 2023; Hao et al., 2022). The observed synergistic effects of the combination treatment suggest that melatonin and flutamide may act through different or complementary mechanisms to potentiate their anticancer effects. Melatonin has been shown to modulate various signaling pathways involved in cell proliferation, survival, and apoptosis, such as the PI3K/AKT, MAPK, and NF-κB pathways (Mihanfar et al., 2022; Cecon et al., 2018; Chen et al., 2020; Hosseinpour et al., 2025). On the other hand, flutamide primarily targets AR signaling, which plays a critical role in prostate cancer progression(Saranyutanon et al., 2019). The combination of melatonin and flutamide may provide a multitargeted approach, simultaneously inhibiting multiple signaling pathways and cellular processes involved in prostate cancer growth and survival. The observed synergistic effects on cell viability, colony formation, migration, and apoptosis suggest that the combination treatment may be more effective in targeting both bulk tumor cells and potential cancer stem cells or tumor-initiating cells, which are often resistant to conventional therapies (Collins et al., 2005). Importantly, the observed reduction in cell viability and induction of apoptosis in the combination treatment group indicate that melatonin and flutamide may act synergistically to promote programmed cell death in prostate cancer cells. The increased sub-G1 population observed in the cell cycle analysis further supports the notion that the combination treatment enhances apoptotic cell death.
The biological relevance and implications of these findings suggest that combining melatonin and flutamide may represent a promising therapeutic strategy for prostate cancer treatment. The synergistic effects observed in vitro provide a strong rationale for further preclinical and clinical investigations to evaluate the potential of this combination approach in improving treatment outcomes and overcoming drug resistance mechanisms. In laboratory experiments using DU145 and PC3 cell lines, it was found that melatonin exhibited sensitivity in the millimolar range and its effects were dose and time-dependent (Nyamsambuu et al., 2022). Treatment with low doses of melatonin resulted in morphological changes and a widening of cell morphology (Nyamsambuu et al., 2022). Melatonin also influenced the cell cycle, increasing the number of cells in the G0/G1 phase, with the percentage of arrested cells varying depending on the concentration of LnCap cell lines (Nyamsambuu et al., 2022). In addition, a derivative of melatonin called UCM 1037 demonstrated inhibitory effects on androgen-sensitive prostate cancer cell growth, exerted cytotoxic effects on PC3 cells, and induced apoptosis in both cell lines (Calastretti et al., 2018). Furthermore, melatonin may induce apoptosis in cancer cells by inhibiting the autophagy pathway (Mehrzadi et al., 2021). It has also been found to effectively inhibit the growth of androgen-sensitive human prostate cancer cells, specifically LNCaP and 22Rv1 cells (Calastretti et al., 2018). It achieves this by suppressing the expression of SENP1, a protein associated with androgen-sensitive prostate cancer growth (Hao et al., 2022). The inhibitory effects of melatonin on cell proliferation are observed both in vitro under androgen-free conditions and in intact mice (Shen et al., 2021). These findings highlight the promising anticancer properties of melatonin in the context of androgen-sensitive prostate cancer. Previous studies have investigated the individual effects of melatonin and flutamide on prostate cancer cells, but the combination approach has been less explored. The observed antiproliferative and proapoptotic effects of melatonin alone on prostate cancer cells are consistent with findings from other studies (Calastretti et al., 2018; Jung and Ahmad, 2007). Similarly, the growth inhibitory and apoptosis-inducing effects of flutamide alone align with its known mechanisms of action as an antiandrogen therapy in prostate cancer. However, the synergistic effects observed when melatonin and flutamide were combined represent a novel and significant finding. While some studies have explored the combination of melatonin with other chemotherapeutic agents or radiation therapy in prostate cancer, the combination with flutamide has not been extensively investigated (Zharinov et al., 2020; Anim-Koranteng et al., 2021; Mafi et al., 2023). Melatonin has been found to have beneficial effects in reducing the risk of prostate cancer (Shen et al., 2021; Zharinov et al., 2020). It can improve overall survival in prostate cancer patients with poor prognosis who undergo combined hormone radiation treatment. In addition, melatonin has been observed to stabilize the disease and induce anticancer actions in prostate cancer patients (Geo Espinosa, 2018). It can also inhibit the migration and invasion of prostate cancer cells by blocking epithelial–mesenchymal transition (Wang et al., 2022; Mirzaei et al., 2022b; Mirzaei et al., 2022a). These positive effects of melatonin on prostate cancer have been reported with minimal to no side effects (Wang et al., 2022). Melatonin shows potential as a therapeutic agent in the prevention, diagnosis, and treatment of prostate cancer. However, more research is needed to fully understand the mechanisms of how melatonin inhibits prostate cancer and to translate these findings into clinical use (Wang et al., 2022; Shen et al., 2021).
While the current study provides strong evidence for the synergistic anticancer effects of the melatonin–flutamide combination in vitro, several limitations should be addressed in future investigations. First, the experiments were conducted using only three prostate cancer cell lines (LNCaP, DU145, and PC3), which may not fully represent the heterogeneity observed in clinical prostate tumors. Validation of the synergistic effects in additional cell line models, as well as in patient-derived xenograft or genetically engineered mouse models, would strengthen the translational relevance of these findings. In addition, the current study focused on analyzing the short-term effects of the drug combination on various cellular processes, such as viability, colony formation, migration, and apoptosis. Evaluating the long-term consequences of sustained melatonin and flutamide co-treatment, including their effects on tumor growth and metastasis in vivo, will be crucial for assessing the therapeutic potential of this combination approach. Furthermore, the precise molecular mechanisms underlying the observed synergistic effects remain to be fully elucidated. Future studies should investigate the interplay between melatonin and flutamide in modulating key signaling pathways and regulatory networks involved in prostate cancer progression and drug resistance. Identifying the critical molecular targets and pathways responsible for the enhanced anticancer activity of the combination will provide valuable insights for the rational design of more effective therapeutic strategies.
The findings of the current study hold significant clinical relevance and implications for the development of novel combination therapies for prostate cancer. Flutamide is an established antiandrogen therapy used in the management of advanced or metastatic prostate cancer. However, its long-term efficacy can be limited by the emergence of drug resistance and adverse effects, such as liver toxicity and gynecomastia. The observed synergistic effects of combining melatonin with flutamide suggest that this combination approach may offer several translational advantages. First, the enhanced antiproliferative, proapoptotic, and antimigratory effects of the melatonin–flutamide combination, as demonstrated in the in vitro experiments, indicate the potential for improved tumor regression and delayed disease progression compared to flutamide monotherapy. This synergistic activity may also help to overcome drug resistance, a common challenge faced with current prostate cancer treatments. Second, melatonin has been reported to have a favorable safety profile, with minimal to no side effects, in contrast to the adverse effects associated with flutamide. The addition of melatonin to flutamide-based regimens may improve the tolerability of the treatment, potentially enhancing patient compliance and quality of life. The current study provides a strong rationale for further preclinical and clinical investigations to evaluate the efficacy and safety of the melatonin–flutamide combination in more complex and clinically relevant prostate cancer models. Successful translation of these findings could lead to the development of a more effective and better-tolerated therapeutic strategy for prostate cancer patients, particularly those with advanced or metastatic disease, who have limited treatment options and face the challenges of drug resistance and adverse effects.
Our study provides compelling evidence for the synergistic anticancer effects of the melatonin–flutamide combination in prostate cancer cells, highlighting its potential as a promising therapeutic approach that warrants further investigation.
Footnotes
Acknowledgments
The authors would like to thank the statistics consultants of the Research Development Center of Sina Hospital for their technical assistance.
Authors’ Contributions
R.O.: Writing the original draft. F.K., R.R., D.T., R.M., S.F.H., A.M., S.N.H.D., and L.O.R.: Validation and methodology. A.M.: Edited, reviewed, and revised the article. S.M.K.A.: Conceptualization.
Confirmation Statement
All authors confirm that their research is supported by an institution that is just primarily involved in education and research.
Disclosure Statement
No competing financial interests exist.
Funding Information
No funding was received for this article.