
Abstract
Introduction:
The characterization of urinary calculi using noninvasive methods has the potential to affect clinical management. CT remains the gold standard for diagnosis of urinary calculi, but has not reliably differentiated varying stone compositions. Dual-energy CT (DECT) has emerged as a technology to improve CT characterization of anatomic structures. This study aims to assess the ability of DECT to accurately discriminate between different types of urinary calculi in an in vitro model using novel postimage acquisition data processing techniques.
Methods:
Fifty urinary calculi were assessed, of which 44 had ≥60% composition of one component. DECT was performed utilizing 64-slice multidetector CT. The attenuation profiles of the lower-energy (DECT-Low) and higher-energy (DECT-High) datasets were used to investigate whether differences could be seen between different stone compositions.
Results:
Postimage acquisition processing allowed for identification of the main different chemical compositions of urinary calculi: brushite, calcium oxalate–calcium phosphate, struvite, cystine, and uric acid. Statistical analysis demonstrated that this processing identified all stone compositions without obvious graphical overlap.
Conclusion:
Dual-energy multidetector CT with postprocessing techniques allows for accurate discrimination among the main different subtypes of urinary calculi in an in vitro model. The ability to better detect stone composition may have implications in determining the optimum clinical treatment modality for urinary calculi from noninvasive, preprocedure radiological assessment.
Introduction
Materials and Methods
Internal Review Board (IRB) permission was obtained to use previously acquired urinary calculi. Fifty calculi were obtained from patients who underwent percutaneous, ureteroscopic, or open stone extraction at our institution. The composition of all stones was assessed with Fourier infrared spectroscopy (StoneComp®; Mission Pharmacal, San Antonio, TX) to accurately determine the chemical composition of the urinary calculi.
Stones were defined as being a particular composition if one component comprised ≥60%. Stones were calcium oxalate (CaOx) (14), calcium phosphate (CaPhos) (apatite) (12), uric acid (7), brushite (5), struvite (3), and cystine (4). Six stones did not exhibit any one component at ≥60% composition and were removed from analysis. The calculi were weighed to determine mass using a scale with resolution of 0.01 mg. Stone volume was determined by immersing the stone in fixed volume of 0.9% sterile saline and by determining the volume displaced to a resolution of 1 mm3. The “maximum stone dimension” was determined with calipers and compared with that obtained on the 140 kilovolt peak (kVp) DECT. Stones were hydrated by immersion in 0.9% sterile saline within vials and held firmly in the center by two rubber stoppers. The air-free vials were placed in a custom-designed renal phantom. This renal phantom has been shown to possess HU attenuation values similar to that of nonenhanced renal tissue (attenuation of 50 HU at 80 kVp and 25 HU at 140 kVp; QRM, Moehrendorf, Germany). To account for the effect of the surrounding abdominal wall and retroperitoneal fat on X-rays, a standardized, circular Plexiglas layer (CIRS, Norfolk, VA) was used to surround the experimental setup. 21
Dual-energy CT data acquisition was performed using a 64-slice multidetector CT imager with a dual source/dual detector design (Fig. 1). In this device, two X-ray tubes and detector arrays are used, with the pairs arranged perpendicular for simultaneous dual-energy CT imaging (Somatom Definition; Siemens Medical Solutions, Forchheim, Germany). DECT was used with a 1.5 mm section thickness, 1 mm reconstruction increment, gantry rotation of 0.5 seconds, collimation of 1.2 mm, pitch of 0.55, and matrix size of 512 × 512 pixels within a 250 mm field of view. In this way, simultaneously acquired low-energy datasets (80 kVp and 499 mA s/rotation = DECT-Low) and high-energy datasets (140 kVp and 118 mA s/rotation = DECT-High) were obtained. The standard kVp for abdominal CT is 120 kV.
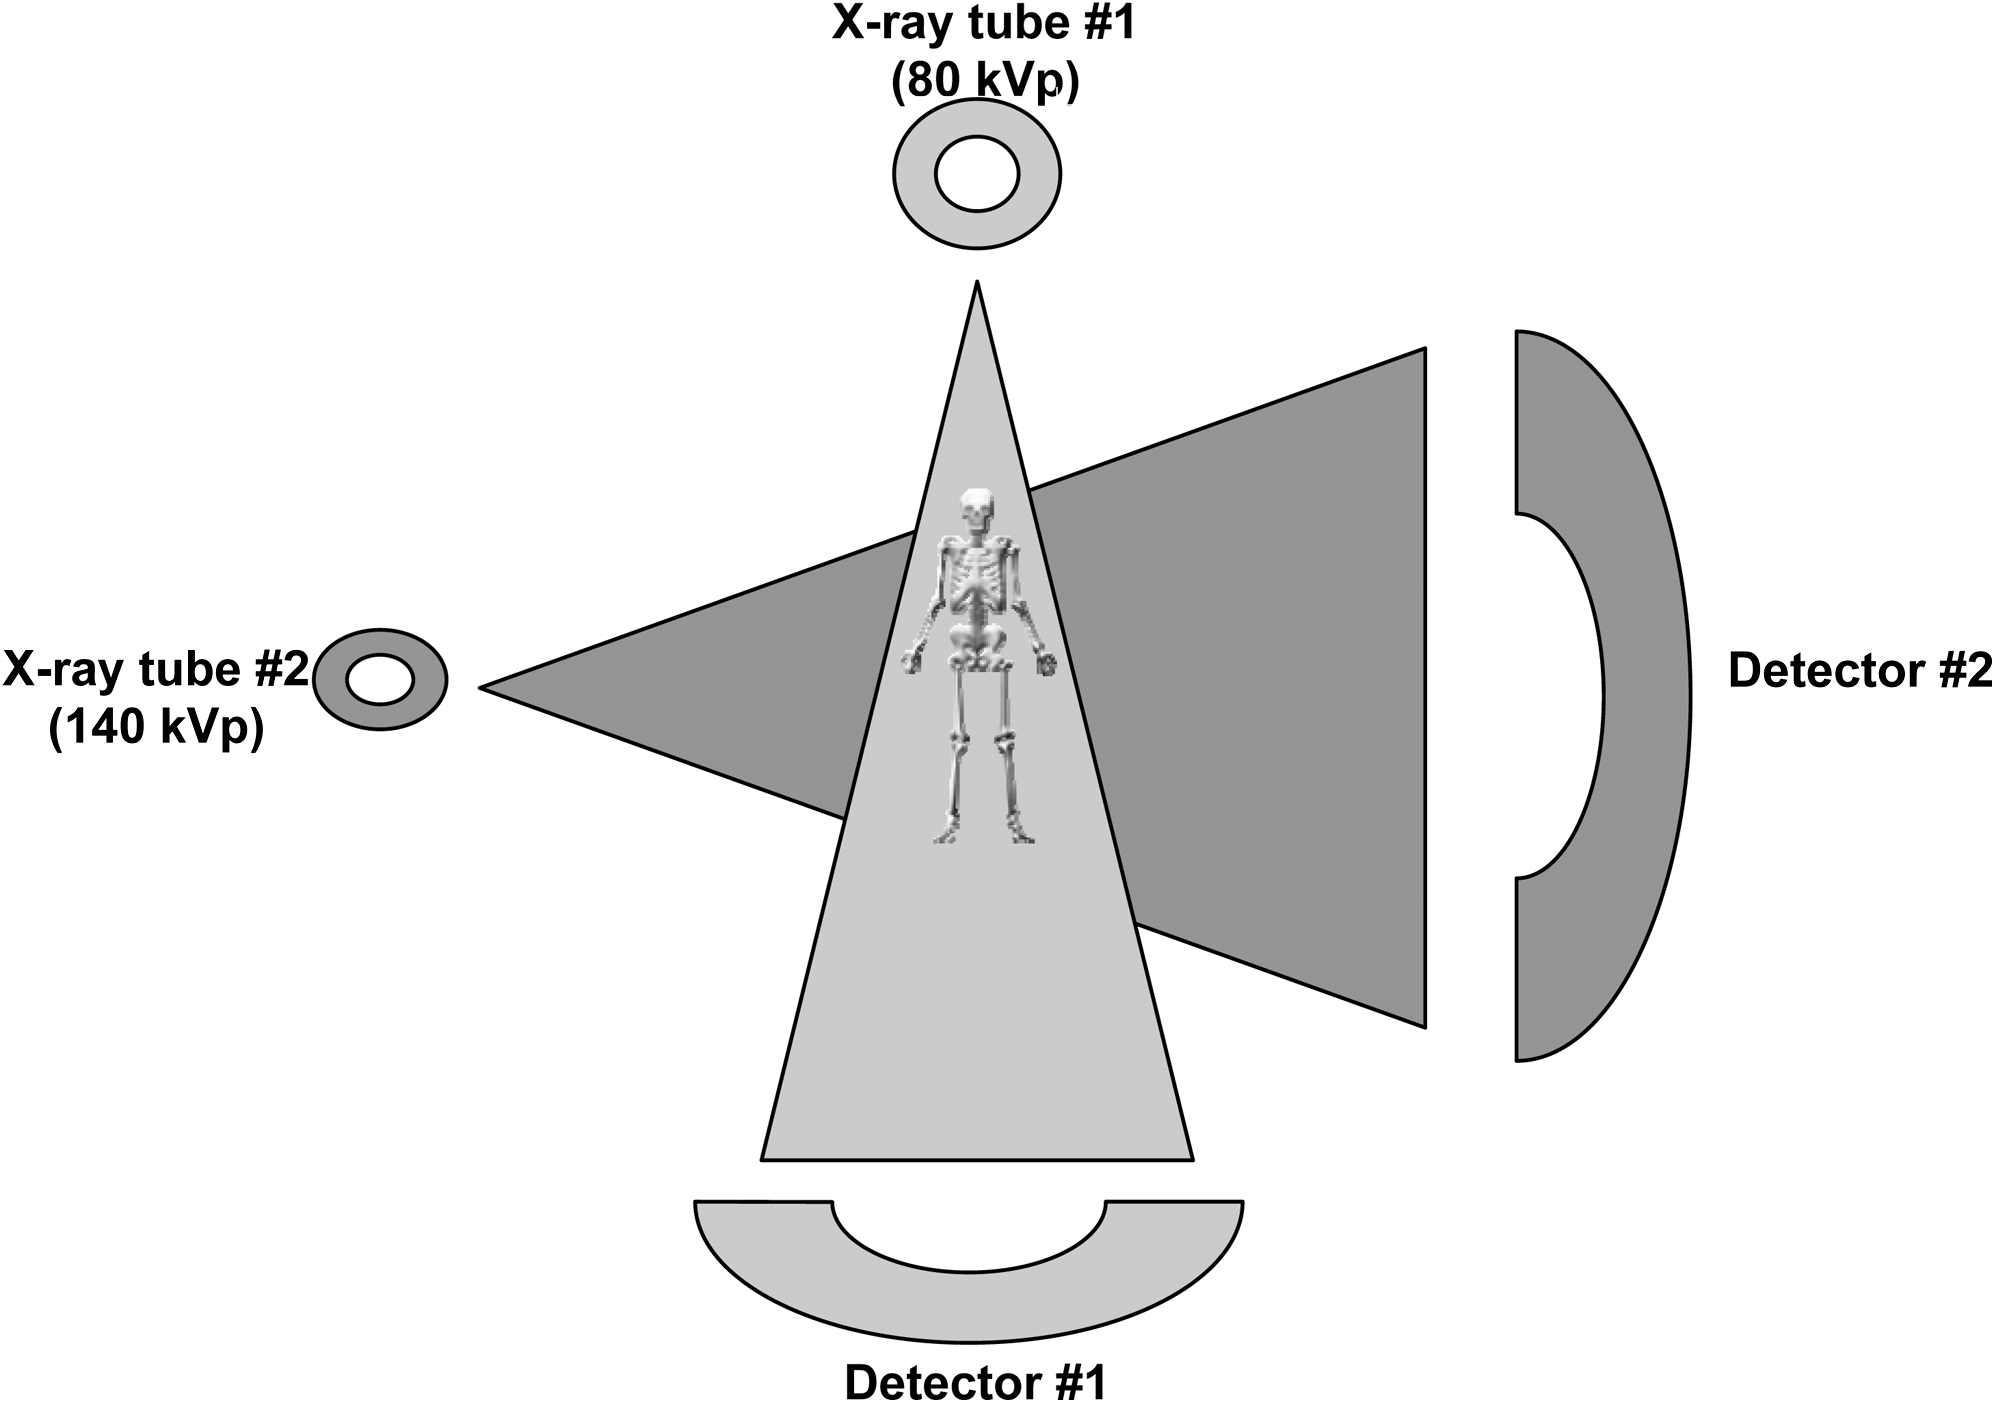
Diagrammatic representation of the dual-energy computed tomography setup.
The mean attenuation of the calculi at low-energy (DECT-Low) and high-energy (DECT-High) DECT datasets was determined. The largest cross-sectional dimension of the stones was identified using the DECT-High dataset. This is referred to as the maximum stone dimension. The attenuation values of the low- and high-energy datasets were examined and postprocessing was done using a computer algorithm to yield a DECT-Stone Window dataset. This analysis was performed as described by Boll et al. 22 Postimage acquisition processing involved pixels color encoded to represent the likelihood that particular attenuation values were representative of specific tissue types. A pixel-by-pixel analysis was then performed, wherein DECT Stone Window was calculated by division of DECT-High by DECT-Low. Dataset assessment was performed using software application (Syngo® Multi Modality Workplace, version VE25A; Siemens Medical Solutions).
Statistical analysis was performed by comparing the attenuation values of the calculi at both DECT-Low and -High. Multivariate analysis with a balanced, full-factorial statistical model was used, with Tukey correction for multiple comparisons used to assess the level of significance in the differentiation of calculus composition based on DECT-Low and -High. Analysis of variance was used to determine the effect of physical properties of the calculi (mass, volume, and maximum stone dimension) on DECT-Low and -High. Linear (Pearson coefficient) and nonlinear (canonical) correlations were calculated to determine any correlation between physical characteristics of the urinary calculi and the DECT values. Statistical analysis was performed using SPSS version 13.0 (SPSS, Chicago, IL). Significance was determined at the p ≤ 0.05 level.
Results
Stone analysis and % composition of stones are summarized in Table 1. Analysis of stone attenuation profiles based on DECT-Low and -High datasets revealed clustering of the calculi based on composition, though there was significant overlap between stone types (Table 2a–c and Fig. 2). From the multivariate analysis performed, the only reliable distinction between stone types that could be made at the 80 and 140 kVp levels was between uric acid and CaOx and between brushite and uric acid.
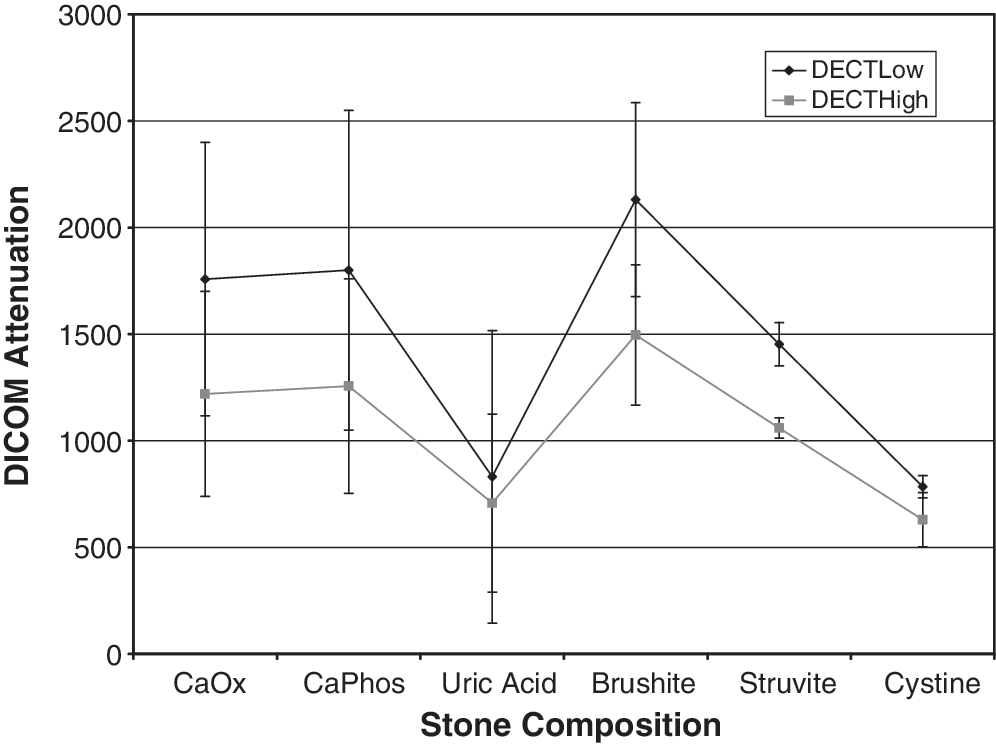
DICOM attenuation values at DECT-Low and DECT-High for different stone compositions.
CaOx = calcium oxalate; CaPhos = calcium phosphate.
p < 0.05 (Tukey and Bonferroni corrections for multiple comparisons used).
DECT = dual-energy CT.
y-Variable = dependent variable in the analysis (DECT-Low [80 kVp], DECT-High [140 kVp], DECT-Stone Window, mass [stone mass in mg], volume [stone volume in mm3]); group = stone composition (factor); mean = attenuation values; std. err. = standard error for post-hoc tests; n = number of stones of each stone composition.
Level of significance p < 0.05, Tukey's correction for multiple comparisons used.
y-Variable = dependent variable in the analysis (DECT-Low [80 kVp], DECT-High [140 kVp], DECT-Stone Window, mass [stone mass in mg], volume [stone volume in mm3]); mean difference = difference between group means for post-hoc analysis; group 1 = stone composition group; group 2 = other stone composition groups being compared with group 1; SE = standard error for post-hoc analysis; n = number of stones of each stone composition.
Examination of DECT-Stone Window values obtained from postimage acquisition processing of the DECT-Low and -High datasets showed distinct separation of calculi based on composition, with no overlap of values (Table 2a–c and Fig. 3). CaOx stones could not be distinguished from CaPhos stones, but these stones could be distinguished from all other stones. Despite the absence of overlap on the graph, multivariate analysis suggested that DECT-Stone Window could not reliably distinguish between uric acid and cystine, uric acid and struvite, and cystine and struvite.
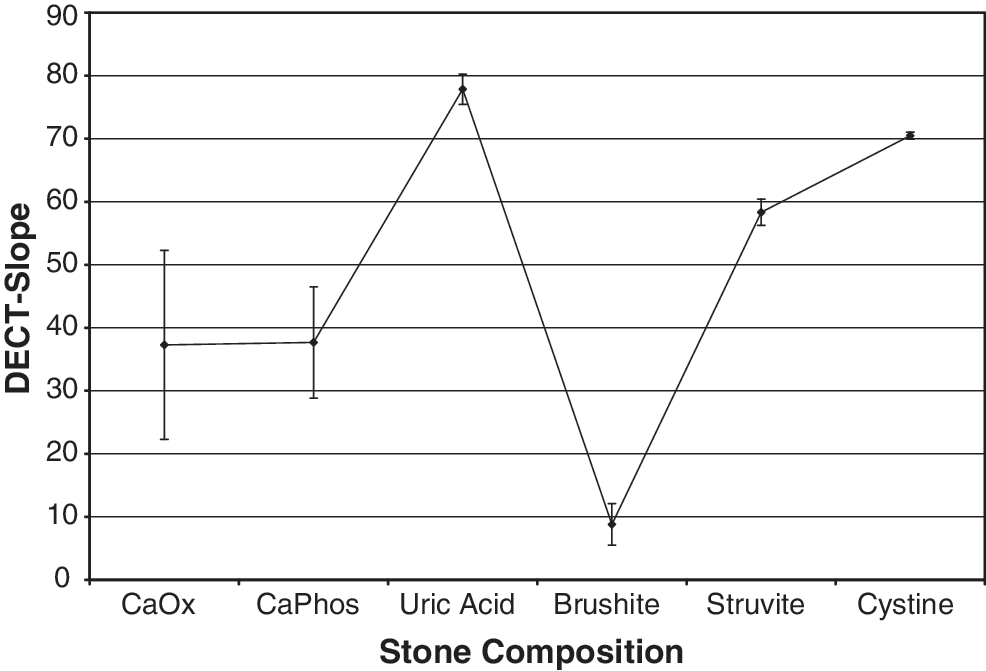
DECT-Stone Window values for different stone compositions.
No significant linear correlation was found between the DECT values and stone mass and volume, as determined by the Pearson correlation coefficient; however, a positive correlation was significant for attenuation values and largest dimension for DECT-Low (Table 3). The correlation coefficients for DECT-Stone Window were less than those of DECT-Low and -High (Table 3). There was a significant nonlinear correlation between the largest stone dimension and the attenuation values obtained from DECT-Low and -High stone analyses (Table 4). No significant nonlinear correlation was demonstrated between DECT-Low and -High and stone mass or volume (Table 4). There was no significant nonlinear correlation between DECT-Stone Window and any of the physical characteristics of the urinary calculi (Table 4).
Level of significance p < 0.05.
Level of significance p < 0.05.
Discussion
CT is the gold standard in the diagnosis of the presence of urinary calculi. 23,24 Studies have suggested that limited information on the chemical composition of urinary calculi can be gained from the HU value of the calculus. 7,8,10 –16,19,25,26 However, because of the variance obtained for different stone types, this information is of little clinical value. 7,11,15,27 Stone composition is a significant factor in predicting the effectiveness of SWL management of urinary calculi. To date, definitive stone analysis has required a sample of the stone for analysis, limiting the pretreatment determination of stone composition. Some studies have also demonstrated that the Hounsfield attenuation value of a calculus can give limited information on the effectiveness of SWL in treating calculi. 5,18,20
CT is limited in accurately determining the chemical composition of urinary calculi because of X-ray energy level, beam collimation width, volume artifact, beam hardening, and motion artifact. 9,15,27 –30 These factors limit the accuracy of delineating the borders of the calculus and thus the region of interest (ROI) selected may include areas not representative of the calculus. These factors lead to inaccuracies in stone size and HU determination.
The HU scale used almost ubiquitously in the evaluation of anatomic structures actually is a limitation itself for the characterization of calculi. This scale chooses a value of zero for the attenuation of water and then extends from −1000 (air) to approximately +2000. Although the HU is related to the density of the material being imaged, this relationship is not directly proportional. As a result, at the extremes of the HU scale, the true attenuation difference represented by 1 HU is different than in the center of the scale. Uric acid calculi tend to have lower HU values than nonuric acid calculi, well within the central region of the HU scale. Most studies preformed using standard CT are able to show differences between uric acid and nonuric acid calculi. However, struvite, CaOx, brushite, and hydroxyapatite calculi have HU values >1000, which then decreases the effectiveness of HU differences to reflect true attenuation differences between calculi. 11,18 This finding likely accounts for the inability of standard CT to distinguish between nonuric acid calculi.
There has been some evidence to suggest that HU can predict the success of SWL. 18,19 This finding was ascribed to the assumed fragility of varying chemical compositions of stones. There is no universal consensus with respect to this issue, as further examination of various studies have suggested that stone size and collimation width of the CT may be primarily responsible for the inability of standard CT imaging to accurately and reliably determine stone composition. 15
This study aims to demonstrate how DECT can be used to assess calculus composition. DECT allows for photons of two differing energies (80 and 140 kVp) to be used simultaneously to acquire CT images. High-energy photons decrease “noise” in the data, whereas low-energy photons allow for better discrimination between materials and thus decrease image noise. Because the attenuation generated by a material depends on the energy of the radiation applied, two distinct datasets are generated. By manipulating these datasets, more information on an object's internal structure is obtained.
Our study used the raw attenuation data from the DECT, rather than its converted value on the HU scale, to better assess the differences in attenuation between different stone types. Even with varying X-ray photon energies (80 and 140 kVp), the mean attenuation values for various calculi overlap. Despite the graphical separation of the DECT-Stone Window values for the varying compositions of the calculi, the values did not reach significance in distinguishing uric acid and cystine, uric acid and struvite, and cystine and struvite (Table 2a–c). This is likely due to the small number of cystine and struvite calculi utilized, thus affecting the tendency of the data to reach significance.
When the ratio of the attenuation values under each of the photon energies is examined (DECT-Stone Window), a clear distinction between the major compositions of calculi is established (uric acid, cystine, brushite, CaOx–CaPhos, struvite) (Fig. 3). This ratio is a mathematical pixel-by-pixel evaluation performed via computer algorithm, with no specific input required other than drawing ROIs. 22 Previously, only uric acid and nonuric acid categorizations could be made using standard CT, 9,14 and these distinctions were not always reliable. 10,12 A recent study suggested that DECT could more reliably distinguish between uric acid and nonuric acid calculi, but was not more specific in its ability to differentiate between various stone compositions. 31
Our study suggests that DECT-Stone Window can distinguish between mixed calculi in which one component makes up ≥60% of the composition. Previous studies focused on CT's ability to distinguish between stones comprised of ≥90% of one component. 11,14 We investigated the relation of DECT-Low, -High, and -Stone Window to the mass, volume, and largest cross-sectional diameter. There was a correlation between the maximum diameter and the attenuation values obtained from scans obtained at 80 kVp. No significant correlation was found between DECT-Stone Window, DECT-High, and the physical characteristics of the stones. This is of particular importance because the errors seen previously were noted to be greater with smaller stones. 15
This work corroborates the findings of Grosjean et al, 32 wherein identification of uric acid, cystine, struvite, CaOx monohydrate and dihydrate, and brushite were able to be isolated and identified with DECT. Although similar findings are acknowledged, a few differences should be noted. This study includes an evaluation of CaPhos stones and phantom model, which may more accurately replicate the abdominal wall and fat. Interestingly, Grosjean et al used a subtraction algorithm of mean attenuation values within a given region of interest, which permitted better delineation of CaOx stones into mono- and dihydrate categories. This study, however, performs a pixel-by-pixel comparison, thereby avoiding means, where a ratio is obtained. This pixel-by-pixel analysis may reduce interobserver variability and lend itself more readily to software incorporation for multi-detector CT (MDCTs).
Clinically, the composition of urinary calculi is known to be a significant determinant of the susceptibility of the stones to SWL. 17,33 Brushite, cystine, and CaOx monohydrate stones are less fragile. If these results can be replicated in the clinical context to better predict stone type, potential success can be obtained using SWL as the primary treatment modality. As an example, if noninvasive DECT can accurately and repeatedly identify stone composition, such as pure CaOx monohydrate, before surgical intervention extraction, then the urologist can choose to perform percutaneous or ureteroscopic stone fragmentation, in favor of likely less-successful SWL. Further, exact stone composition determination of a struvite stone, as opposed to general HU, would benefit the urologist with respect to risk assessment, perioperative planning, and antibiotics in case of infectious nature of these calculi.
A DECT scan is estimated to expose patients to 10% to 15% more radiation than a standard CT scan, although this has been estimated to be as high as a 40% increase. 32,34 Alternatively, DECT could be used with a decrease in the total radiation exposure. By obtaining a DECT with only the lower of the 2 kV settings to produce a standard CT scan and then having the higher energy setting used only in the area of interest to generate the DECT-Stone Window value, a reduction in the total dose could be achieved. This technique would decrease the radiation exposure to the patient while providing potentially clinically useful information.
Conclusions
Dual-energy CT with novel pixel-by-pixel image postimage acquisition data manipulation allows for the characterization of urinary stones based on their chemical composition. The ability to determine stone composition may allow for optimization of treatment options for patients with symptomatic renal and ureteral calculi.
Footnotes
Disclosure Statement
No competing financial interests exist.