
Abstract
Purpose:
To evaluate patient preferences, understanding, and satisfaction regarding visual review of radiographic images during counseling.
Patients and Methods:
101 urologic patients who presented for counseling where images impacted decision making were randomized into group A, shown their images, and group B, shown a diagram. Both completed a satisfaction survey blinded to the study's purpose. A second unblinded survey evaluated patient comprehension of and preferences regarding images. Comparison of intervention and control groups for differences in satisfaction and analysis of patient self-reported preferences and understanding regarding radiographic images was performed.
Results:
Group A had higher satisfaction scores but did not reach statistical significance. Both groups reported comprehension of images (100%, 97.9%), improvement in understanding of their condition and treatment because of viewing images (98%, 95.8%), and felt images should be shown to all patients (92%, 89.6%). Multivariate analysis identified female sex to independently predict greater understanding of images and belief that all patients should be shown their images.
Conclusions:
Almost all patients reported comprehension of images, improvement in understanding because of review of images, and preference for being shown images. Female patients expressed greater understanding and preference for all patients to be shown their images. Review of radiographic images represents a potentially useful additional modality for patient counseling whose usefulness for improving satisfaction will need to be confirmed in further studies.
Introduction
One important source of medical knowledge that can be used in medical decision-making is radiographic imaging, which represents an increasingly used diagnostic modality for the evaluation of medical conditions. In 2007, Medicare beneficiaries received an average of 4.1 radiographic studies per person, representing an increase of 29.3% from the 1998 level. 4 Because of the importance of imaging in the diagnosis and treatment planning of many disease processes, including urologic conditions, conveying the results of these studies will play an increasingly important role in the counseling of patients.
Advances in computer technology have made radiographic images more accessible and easier to use during the counseling encounter, making them a promising resource for increasing patient knowledge. Multiplanar images display anatomic features in a frontal view fashion and have been found to enhance the usefulness of cross-sectional imaging modalities, such as CT and MRI. 5 –8 Because of the more natural anatomic relationships depicted in these reformations, radiographic images may now be easier for laypersons to comprehend, making them more useful for counseling.
Urologists continue to value and maintain competency in personal interpretation of radiographic images 9 and are therefore capable of using these images during the counseling process. The frequency of this practice has not been reported, to our knowledge. In addition, patients now often have access to their images, because many radiology facilities routinely provide digital copies of radiographic study images to patients on a computer disc to allow them “to maintain an archive of their electronic imaging record.” 10 It is not known, however, whether patients are able to interpret the images themselves or gain enough meaningful knowledge from them to aid in the decision-making process. We have noted anecdotally that patients occasionally view their images before meeting with their physician but are usually not able to interpret these radiographs by themselves until their physician reviews the images with them. After such review, it appeared that many patients expressed increased satisfaction with their visit and understanding of their condition. This practice has not been previously described or studied in the literature.
We hypothesize that patients have improved satisfaction with their visit and physician and gain increased knowledge of their medical condition and treatment plan as a result of having their physician visually review radiographic images with them during counseling encounters. To evaluate this hypothesis, we performed a prospective single-blinded, randomized controlled study on the effect of visual review of radiographic images on patient satisfaction with their overall visit and with their physician. In addition, we assessed patient self-reported comprehension and preferences regarding visual review of their images in a nonrandomized fashion.
Patients and Methods
Study population
Consecutive subjects who presented as new patients to the University Medical Center urology clinic were prospectively enrolled into this pilot study. Because of a lack of existing research regarding review of radiographic images with patients on which to base power calculation, planned enrollment was set at 100 subjects. Inclusion criteria included availability of CT or plain film imaging that affected decision making for the subject's presenting complaint, ability to speak English, age 18 years or older, adequate eyesight to view images, and cognitive ability to provide consent. Candidates were excluded if they had seen their radiographs before their visit.
Methodology of study
Subjects who fit the inclusion criteria had consent to participate in the study obtained by a research assistant and were told only that the study was regarding “patient satisfaction with urology clinic visits.” Subjects agreeing to participate were randomized into two groups in alternating fashion. Group A subjects (intervention group) were shown their radiographic images during their clinic visit by their physician (MN) either using hard-copy films or computerized Picture Archive and Communication System (PACS) images with the purpose of demonstrating general anatomy, pathologic processes, and proposed treatments. Group B subjects (standard care) were not shown their radiographic images, but instead had their pathology described verbally and with the use of a standard line drawing diagram of the urinary system. Figure 1 is a flow diagram of the study design.

Flow diagram of the study design.
After counseling by the treating physician, both group subjects were provided an initial survey (Survey 1) by a research assistant after the physician had left the room. Survey 1 was an initial overall satisfaction survey with five-point Likert questionnaire items that were designed to assess subject satisfaction with their clinic visit, satisfaction with their physician, and understanding of their disease process. Distractor questions were included to mask the study's focus on the use of images for counseling. The distractor questions assessed waiting room time, visit time, clinic facilities, and staff friendliness. Demographic information included age range, sex, and education. After completion of this survey, Group A subjects were debriefed by the research assistant as to the actual intent of the research study and given an additional survey (Survey 2a), which assessed their satisfaction with the use of imaging during the visit, their ability to understand the images, improvement in the understanding of their disease process, and their opinion on whether visual review should be routinely used.
Group B subjects were debriefed and were then shown their radiographic images by their treating physician in the same manner as group A subjects. After review of their images, they were given Survey 2b, which assessed their preferences and understanding of their radiographic images, with questions regarding their preference between diagrams and radiographic images. Supplemental data were recorded on the subjects' primary diagnosis, the imaging type used to counsel the subject, total visit time, and whether surgery was scheduled.
Statistical analysis
Statistical analysis was performed to compare the two groups for baseline characteristics and for the primary outcome of subjects' overall visit satisfaction, perception of the quality of their counseling, and understanding of their disease (Survey 1). Patient self-reported comprehension of radiographic images and preferences regarding visual review of radiographs were determined within each group (Surveys 2a and 2b). Univariate and multivariate logistic regression analysis was performed to identify predictors of patient satisfaction, understanding, and preferences using the independent variables of age (18–39, 40–59, 60+), sex (M/F), education (high school or less, college or more), diagnosis (nephrolithiasis vs other) or (cancer vs other), visit time (min), whether surgery was scheduled (Y/N), and group designation (group A vs group B).
Five-point Likert questionnaire items were collapsed into dichotomous outcomes of strongly agree vs all other outcomes (agree/neutral/disagree/strongly disagree) for the logistic regression. A backward stepwise regression selection method was used with explanatory factors with a P ≤ 0.2 on univariate analysis initially included in each model and group designation included in all models. Additional statistics were performed with chi-square and Fisher exact tests for analysis of categorical variables, Wilcoxon rank sum tests for ordinal variables, and t tests for continuous variables.
Analysis was performed using the STATA 10 statistical software package (Stata Corporation, College Station, Texas). Statistical significance was set at 0.05, and all tests were two-tailed. No funding was used for this study. Institutional Review Board review was obtained, and approval was granted for this study.
Results
A total of 105 subjects were recruited for the study between March 2009 and November 2009. Four subjects declined to participate—two because of lack of time, one because of a previous bad experience involving research, and one for no specified reason. Two subjects in group B indicated that they had previously seen their radiographic images after being randomized and were retained for analysis on an intent-to-treat basis. There were 51 final subjects in group A and 50 final subjects in group B. Sex (54.9% and 50% male for groups A and B, respectively), age range (21.6% and 22% age 50–59), education (51% and 58% college educated or higher), diagnosis (68.6% and 68% urolithiasis), type of imaging (96.1% and 100% CT), whether surgery was scheduled (37.3% and 34% scheduled), and visit time (32.4 and 32 min) were similar between the two groups, indicating the groups were well matched (Table 1).
SD = standard deviation; GED = general educational development; CT = computed tomography.
Results of blinded patient survey on understanding, physician satisfaction, and overall satisfaction
Results of Survey 1 for both groups are shown in Table 2 (distractor questions) and Table 3 (study questions). There was no statistically significant difference between how the groups answered the nine initial distractor questions. There was also no statistically significant difference between the groups for the six remaining study questions, although there was a trend toward being more likely to answer “strongly agree” to the study questions: “ I felt that my physician was knowledgeable and competent” (80.4% vs 78% strongly agree, groups A and B); “I felt involved in the decision making for my treatment plan” (74.5% vs 70%); “I felt my overall visit experience was good” (76.5% vs 66%); “I would recommend this facility/staff to people I know” (80.4% vs 72%).
Results of unblinded patient survey on self-reported understanding and preferences regarding review of radiographic images
Results of the unblinded opinion Surveys 2a and 2b are shown in Figure 2. Subjects in group A almost universally indicated an ability to understand their images (100% agree or strongly agree), thought that their images improved their understanding of their condition and treatment plan (98%), thought that being shown their images improved their overall clinic visit (98%), thought that images should be shown to all patients (92%), and would prefer being shown their radiographs if given a choice (100%).
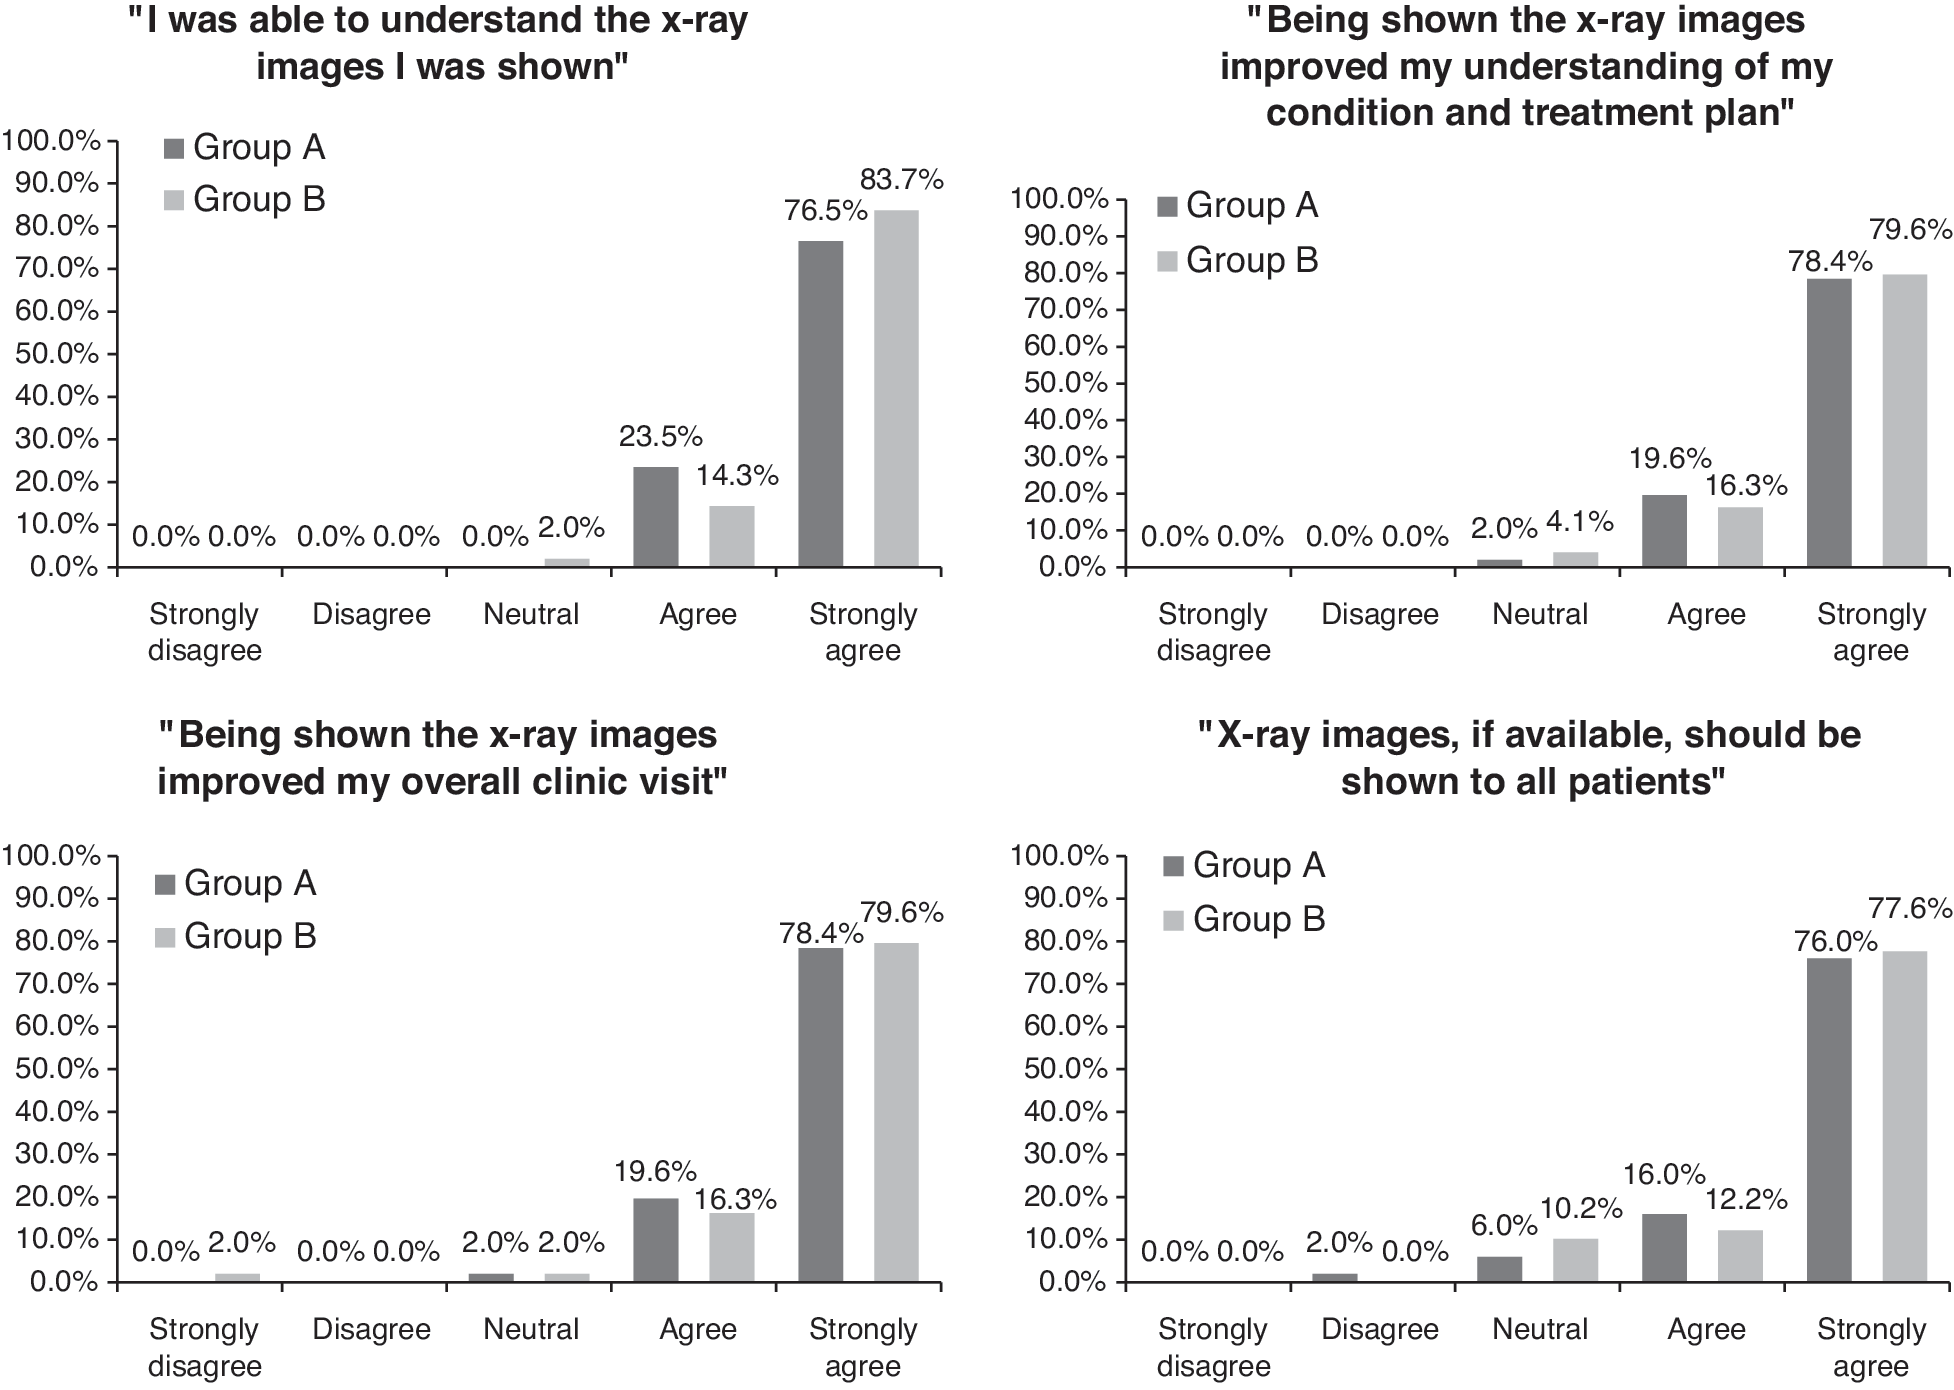
Subjects in group B were nearly universal as well in their ability to understand images (98%), thought that being shown their radiographs improved their understanding of their condition and treatment plan (96%), thought that their overall visit was improved by being shown their radiographs (96%), and thought that all patients should be shown their radiographs (90%); 35.4% thought that radiographs were more useful, 60.4% thought that radiographs and diagrams were equally useful, and only 4.2% thought that diagrams were more useful. If given a choice, 18.8% would prefer being shown their radiographs alone, 79.2% both their radiographs and diagram, and only 2.1% the diagram alone. None indicated a preference for being shown neither the radiographs nor diagrams.
Univariate and multivariate logistic regression of predictors influencing patient self-reported understanding and preferences regarding review of radiographic images
Univariate and multivariate logistic regression was performed for the last five questions of Survey 1 and first four questions of Survey 2a and 2b with answers dichotomized to either strongly agree or other. The statistically significant associations are listed as follows: Sex was significantly associated with the question “I was able to understand the x-ray images I was shown” on both univariate (odds ratio [OR] 3.32, confidence interval [CI] 1.10–9.99; P = 0.033) and multivariate analysis (OR 4.80, CI 1.42–16.2; P = 0.012) with women more likely to answer “strongly agree.” Diagnosis of a kidney stone was also associated with this question with stone patients being more likely to report being able to understand their images on multivariate analysis (OR 3.49, CI 1.11–10.94, P = 0.032). Age was associated with the question “Being shown my x-ray images improved my understanding of my condition and treatment plan” on univariate analysis (OR 0.28, CI 0.08–0.93; P = 0.038) but not on multivariate analysis.
Sex was significantly associated with the question “X-ray images, if available, should be shown to all patients” with women more likely to answer “strongly agree” on both univariate (OR 6.52, CI 2.03–20.90; P = 0.002) and multivariate analysis (OR 7.95, CI 2.30–27.43; P = 0.001). Visit time in minutes was also significantly associated with this question on both univariate (OR 0.96, CI 0.91–0.998; P = 0.039) and multivariate (OR 0.94, CI 0.90–0.99; P = 0.018) analysis with subjects experiencing longer visit times less likely to answer “strongly agree.”
Discussion
On self-report, the majority of patients indicated a high comprehension of their radiographic images, thought being shown their images improved their understanding of their condition and treatment plan, thought being shown their images improved their overall visit, and preferred being shown their radiographs during their visits. Female sex was significantly associated with higher patient preference for being shown radiographic images and comprehension of radiographic images. Diagnosis of a kidney stone was positively associated with comprehension of radiographic images, and visit time was negatively associated with thinking all patients should be shown their radiographic images.
Although patients who viewed their radiologic images reported higher overall visit satisfaction, physician satisfaction, and feeling more involved in the decision-making process compared with patients who were only shown a diagram, none of these reached statistical significance. This may have been related to issues with the survey instrument and skewing of both groups toward high satisfaction and understanding.
Imaging plays an increasingly important role for physicians in making management decisions regarding their patient. In a study of national Medicare beneficiaries, Parker and colleagues 4 found that the per capita use among Medicare persons was an average of 4.1 radiographic imaging studies per year, representing a 29.3% increase between 1998 and 2007.
Our study suggests that patient satisfaction, understanding, and involvement in the decision-making process may be improved by taking advantage of these multiple opportunities for providing enhanced counseling using visual review of radiographic images. By providing additional medical information to patients in a modality that is readily understandable to them, such visual review potentially represents an important tool in improving physician-patient communication, which in turn has been shown to lead to improved health outcomes in a number of clinical scenarios. 11 –13
To our knowledge, there have been no studies investigating if patients benefit from viewing their radiographic images. A dermatologic study, however, assessed patient satisfaction when patients were shown photographic images of their condition. Patients who saw their images showed a 10% improvement in immediate and 2-month satisfaction rates over patients who were not shown their photographs. 14 These findings support our hypothesis that visual review of radiographic images may improve patient satisfaction and understanding.
There may be several reasons that would suggest higher satisfaction and understanding among patients who are shown their radiographic images. Persons appear to respond variably to different learning stimuli, with researchers demonstrating that some tend to respond to auditory cues, while others respond to visual cues better. 15 A study that was trying to identify neural pathways for these differences found that visual learners will activate parts of the brain that are associated with visual stimuli when presented with verbal stimuli. It appeared that visual learners are converting verbal stimuli to visual mental representations to improve comprehension. 16 The reverse was also true, in that verbal learners will try and convert visual cues to verbal mental representations.
A combination of the multiple stimuli during the learning process also appears to be preferred. Wehrwein and coworkers 17 demonstrated that 45.8% of women and 87.5% of men preferred multiple modalities when learning new materials. Our study suggests that patients may similarly prefer multiple stimuli when undergoing medical counseling to better understand their disease process, with 78.7% of those shown both a diagram and radiographic images reporting a preference for being shown both during counseling.
Physicians may be concerned with not having time to show patients their imaging, given the increased pressures to see more patients during the course of a clinic day. Our study, however, showed almost no difference between the two groups regarding visit time (32.4 vs 32 min for those shown vs those not shown images). In part, this may have been because the group B patients were shown a representative diagram on which their disease process was illustrated instead of seeing their images. Regardless, the similar visit times in both groups suggests that clinicians are able to show patients their actual imaging without any appreciable change in the time spent counseling. With longer visit times, patient were less likely to respond “strongly agree” to the statement, “All patients should be shown their x-rays” on multivariate analysis (OR 0.94, CI 0.90–0.99; P = 0.018), suggesting that patients are also time conscious and may be concerned that routine review of radiographic images with all patients may extend their wait times.
Another concern that physicians may have is that the patients will not comprehend their radiographic images. We found that patients were able to quickly comprehend their images after being oriented on how to understand them. This was reflected in the positive response to the question regarding whether patients understood their images (100% and 97.9% agree or strongly agree in groups A and B, respectively).
In multivariate analysis, women were more likely to respond that they “strongly agree” that they understood their images (OR 4.80, CI 1.42–16.2; P = 0.012). Women were also much more likely to “strongly agree” that all patients should be shown their images (OR 7.95, CI 2.30–27.43; P = 0.001). The two results are consistent, because women were more likely to comprehend their images and thus were more likely to prefer being shown them. This gender variation may result from different learning styles between women and men. In the study by Wehrwein and associates 17 looking at learning differences between sexes, women showed a clear preference for visual cues vs verbal cues. While most preferred a multimodal approach, 4.2% of women preferred only visual cues. None of the women surveyed wanted only verbal cues. Men had the opposite result, with 4.2 % showing preference for verbal, writing, and kinesthetic learning styles, but 0% preferring visual only. Visual review of radiographic images may therefore be particularly useful for female patients.
Limitations
There were several limitations in this study. Our control group (group B) was shown both a diagram and given a verbal description, instead of just a verbal description. Because a large percentage of this group found radiographs and diagrams equally useful (59.6%), this may have contributed to the lack of significant difference between groups A and B. We chose to include both a diagram and verbal description in the control group to maintain similar visit times between the two groups. There may have been a significant difference if the control group was only given a verbal description.
Because this study was single blinded, it was not possible to entirely exclude unmeasured differences in quality of counseling between groups A and B because of bias by the counseling physician. To the extent possible, however, similar counseling interactions were used for both groups, which is supported by the nearly identical visit times observed for each group. We recognize that our mean visit time of 32 minutes is likely longer than typical and reflects the detailed explanations provided to both groups. These detailed explanations may have diluted any differences in understanding or satisfaction between them.
Although the survey instruments used in this study were pilot tested for comprehension with five initial subjects and staff, they were not validated and may have not been able to accurately measure our outcomes of interest. The study was also limited in that a single physician was involved in counseling of all patients and that the study only included urologic patients. The results may not necessarily translate to other specialties, physicians, or settings. External validity will therefore need to be established through additional studies with other providers and patient populations.
Despite the limitations of this pilot study, the strong self-reported patient comprehension of images, improved understanding of their condition and treatment plan as a result of reviewing images, and preferences for being shown their images suggests that review of radiographic images during the physician-patient interaction may represent an important and valuable counseling modality in improving communication.
Further studies using a validated instrument, involving other patient populations, and powered using the data from this initial pilot study may further define the role of visual review of radiographic images with patients during medical counseling. Non-English speaking patients, who were excluded from the study, may particularly benefit from visual review as it can bypass issues concerning language barriers. In addition, while this study had an emphasis on patient satisfaction, future studies might focus more on understanding and comprehension, which are not as prone to the uniformly high ratings typically seen with studies involved with physician satisfaction assessment by patients.
Conclusion
Almost all patients reported high comprehension of images, improvement in the understanding of their condition and treatment plan because of visual review of images, and preference for being shown images, suggesting that visual review of radiographic images is a useful modality for patient counseling. Women expressed higher comprehension of radiographic images and preferences for all patients to be shown radiographic images, suggesting that visual review may be particularly useful for female patients. Further studies will be needed to confirm the usefulness of visual review of radiographic images in improving patient satisfaction and understanding during counseling interactions.
Footnotes
Disclosure Statement
No competing financial interests exist.