
Abstract
Background and Purpose:
Radiation exposure during medical procedures continues to be an increasing concern for physicians and patients. We determined organ-specific dose rates and calculated effective dose rates during right and left percutaneous nephrolithotomy (PCNL) using a validated phantom model.
Materials and Methods:
A validated anthropomorphic adult male phantom was placed prone on an operating room table. Metal oxide semiconductor field effect transistor dosimeters were placed at 20 organ locations in the model and were used to measure the organ dosages. A portable C-arm was used to provide continuous fluoroscopy for three 10 minute runs each to simulate a left and right PCNL. Organ dose rate (mGy/s) was determined by dividing organ dose by fluoroscopy time. The organ dose rates were multiplied by their tissue weighting factor and summed to determine effective dose rate (EDR) (mSv/s). Two-dimensional radiation distribution in the abdomen during a left-sided PCNL was visually determined using radiochromic film.
Results:
The EDR for a left PCNL was 0.021 mSv/s±0.0008. The EDR for a right PCNL was 0.014 mSv/s±0.0004. The skin entrance was exposed to the greatest amount of radiation during left and right PCNL, 0.24 mGy/s and 0.26 mGy/s, respectively. Radiochromic film demonstrates visually the nonuniform dose distribution as the x-ray beam enters through the skin from the radiation source.
Conclusions:
The effective dose rate is higher for a left-sided PCNL compared with a right-sided PCNL. The distribution of radiation exposure during PCNL is not uniform. Further studies are needed to determine the long-term implications of these radiation doses during percutaneous stone removal.
Introduction
Radiation from intraoperative fluoroscopy is routinely reported based on fluoroscopy time or dose-area product (DAP). Yet, it is difficult to determine actual radiation dose delivered to patients based on fluoroscopy time or DAP alone. Effective dose (ED) is a value that relates the amount of radiation absorbed by a patient to the risk of developing a malignancy. We determined organ-specific dose rates and calculated effective dose rates (EDR) during right- and left-sided PCNL using a validated phantom model. We also determined the actual ED patients received during PCNL based on our model.
Materials and Methods
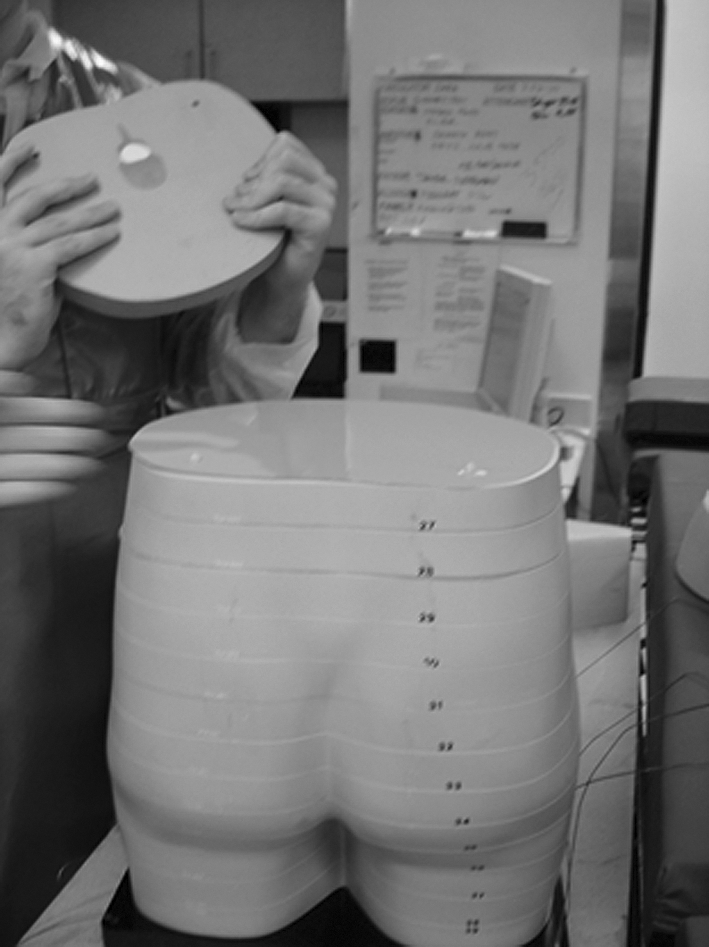
An anthropomorphic male phantom (model 701-D; CIRS, Norfolk, VA) (Fig. 1A) that has been validated for human organ dosimetry measurements was used to determine organ-specific radiation doses. 1 The phantom is 173 cm tall and weighs 73 kg. The phantom is composed of 39 contiguous axial slices, each 25-mm thick. The slices have numbered locations representing the anatomic location of 19 internal organs (Fig. 1B). The locations are optimized for organ dosimetry. Micrometal oxide semiconductor field effect transistors (μ-MOSFET) dosimeters (Best Medical, Ottawa, Canada) were used to measure organ dosages.

Anthorpomorphic male phantom.
Organ-specific dose and EDR measurement
The phantom was placed prone on an operating room table. The μ-MOSFET detectors were placed at 20 organ locations (including skin entrance surface) in the phantom (Fig. 1C) A General Electric OEC 9800 Elite C-arm (GE Healthcare, Waukesha, WI) was used to provide fluoroscopy simulating both a left- and right-sided PCNL. The x-ray emitter was located under the table as is standard for fluoroscopy during PCNL, and the C-arm was centered over the location of the corresponding kidney. The image was collimated as was appropriate.
Fluoroscopy was performed in the straight anterior-posterior (AP) orientation. Three 10-minute continuous runs of fluoroscopy were performed at a setting of 91 kVp and 3.0 mAs for the left PCNL and 90 kVp and 3.0 mAs for the right PCNL. The specific absorbed radiation dose (mGy) was determined for each organ location during each 10-minute run of fluoroscopy. Organ dose rates (mGy/s) were calculated by dividing the organ doses by the fluoroscopy time. The equivalent dose rates (mSv/s) were calculated by multiplying the organ dose rates by their tissue weighting factor (WT). The tissue weighting factors were based on the International Commission on Radiological Protection Publication 103. 2 The equivalent dose rates were summed for each side to calculate the EDR (mSv/s).
Two-dimensional radiation distribution
Two-dimensional radiation distribution in the abdomen during a left PCNL was visually determined using radiochromic film model XRQA (International Specialty Products, Wayne, NJ). The film was placed between slices of the phantom from the level of the diaphragm to the level of the iliac crests (Fig. 2). The phantom was placed prone on the operating room table. Continuous fluoroscopy was performed in the straight AP orientation for 3 minutes. The films were then processed to determine the two-dimensional radiation distribution.
Radiochromic film placed between axial slices of phantom to determine radiation distribution.
ED measurement during PCNL
After obtaining Institutional Review Board approval, we retrospectively reviewed all PCNL procedures performed by a single surgeon (GMP) at our institution from November 2007 to April 2009. Of the 260 PCNL procedures that were performed, a total of 96 patients with data on their radiation dosage during PCNL were identified. Of these 96 patients, a total of 20 nonobese males were identified and included in the analysis. These patients were chosen because they most closely matched the physical characteristics of our phantom model.
Radiation dosage was recorded in a dose report from the intraoperative C-arm, (GE OEC 9800 Elite). The radiation dose measured included all radiation exposure during percutaneous access, wire placement, tract dilation, stone removal, and drainage tube placement. Radiation exposure during the cystoscopic placement of the external ureteral catheter was not included. The dose report included fluoroscopy time and a DAP expressed in cGy*cm2. The effective dose was calculated using two different methods for right and left PCNL. The effective dose was calculated from the DAP using accepted conversion tables, converting cGy*cm2 to mSv (ED-DAP). 3 The ED was then calculated based on the EDR determined by our model by multiplying the mean EDR times the fluoroscopy time (ED-EDR). Wilcoxon Mann-Whitney test was performed to compare ED-DAP and ED-EDR for both left and right PCNL. Statistical analysis was performed using STATA (Version 11.0, College Station, TX).
Results
The skin entrance is exposed to the greatest amount of radiation on both left- and right sided PCNL (Figs. 3A, 3B). The exposure to the internal organs varied by side. On the left side, the stomach (0.0749±0.0061 mGy/s) was exposed to the greatest amount of radiation, followed by the pancreas/tranverse colon (0.0524±0.0021 mGy/s) and spleen (0.0430±0.0022 mGy/s) (Fig. 3A). The left kidney is exposed to 0.0322±0.0040 mGy/s. The gallbladder (0.1195±0.0100 mGy/s) is exposed to the greatest amount of radiation on the right, followed by the liver (0.0430±0.0016 mGy/s) and right kidney (0.0287±0.0038 mGy/s) (Fig. 3B). The EDR was greater for left PCNL vs right PCNL (Fig. 4). Radiochromic film visually demonstrates the nonuniform dose distribution as the x-ray beam enters the skin from the radiation source (Fig. 5). The greatest amount of absorbed radiation is in the area closest to the emitter of the C-arm.

Organ-specific dose rate (mGy/s) for
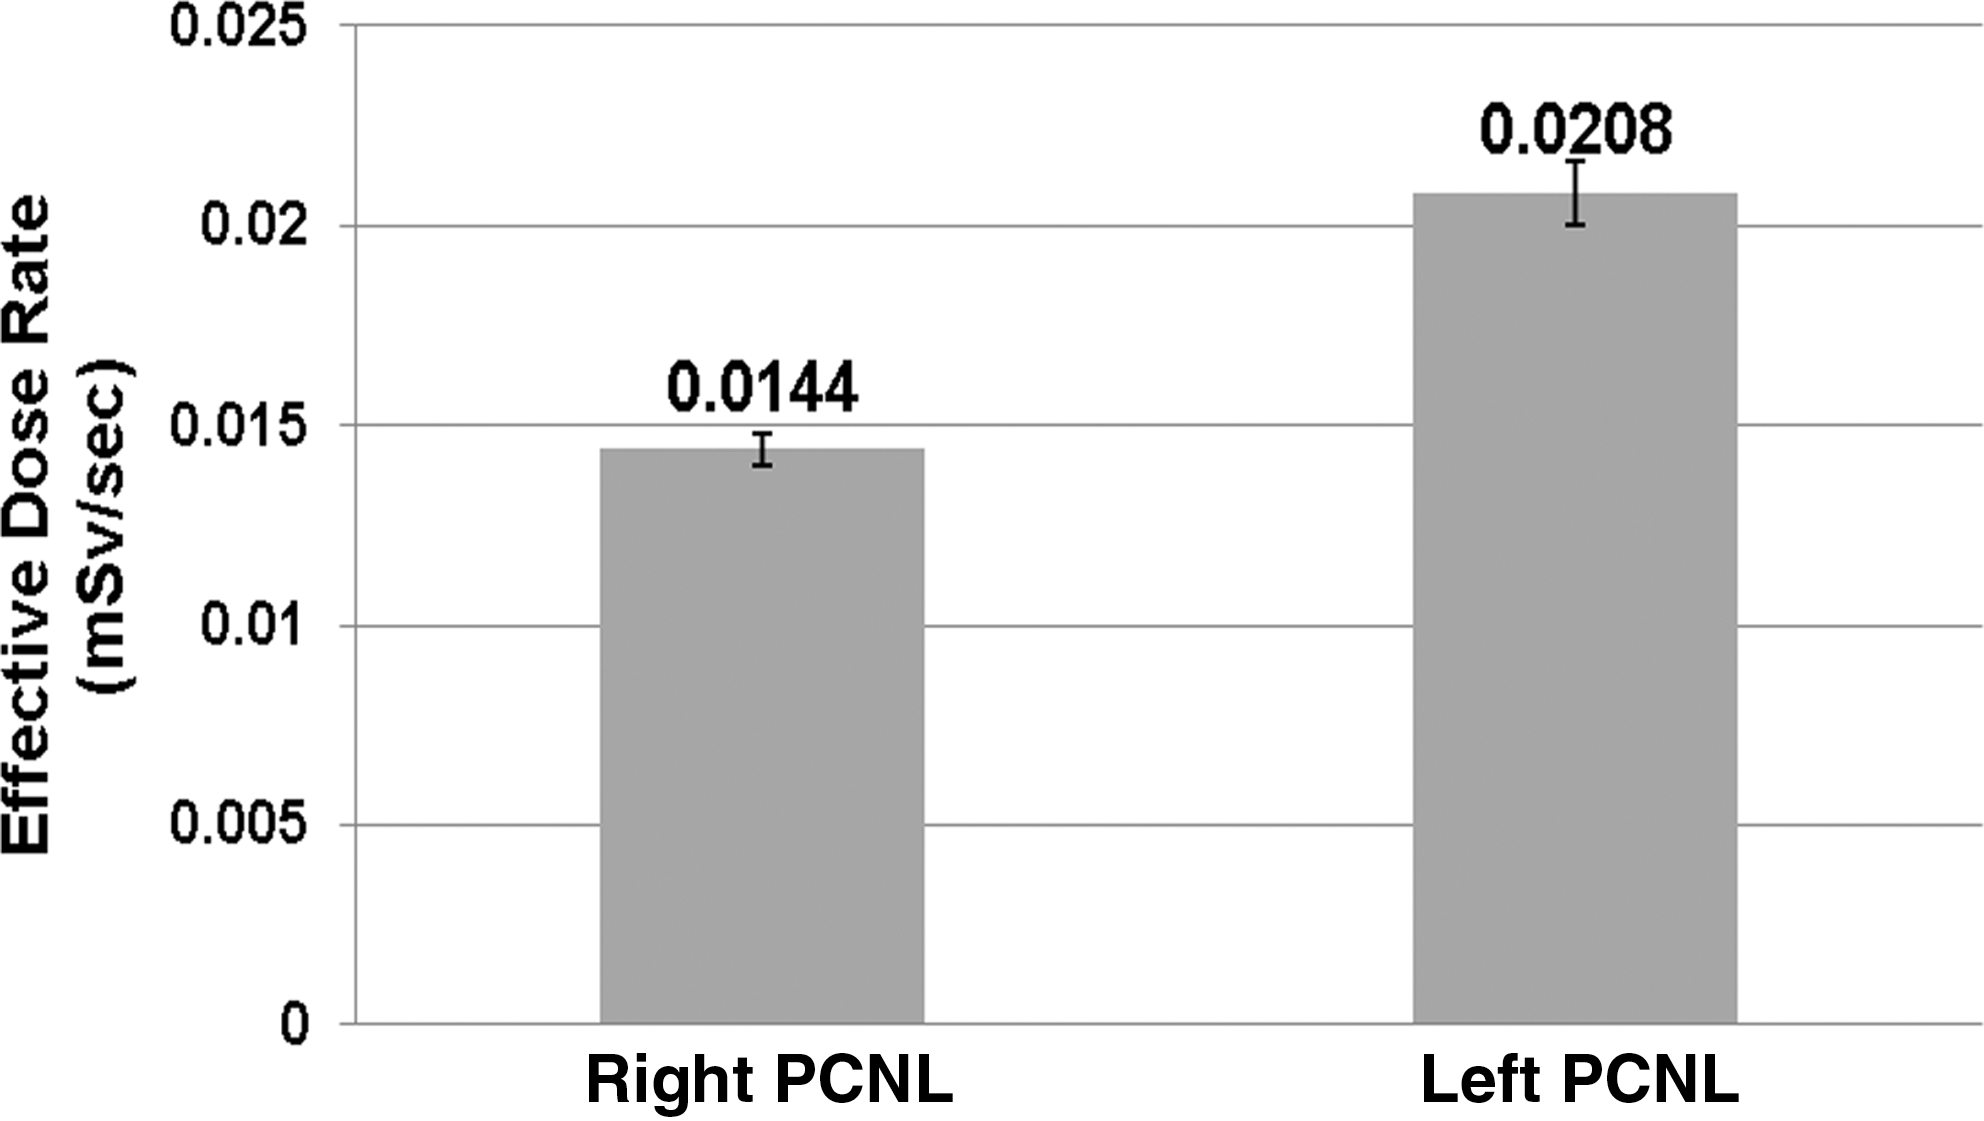
Effective dose rate for left and right percutaneous nephrolithotomy (PCNL).
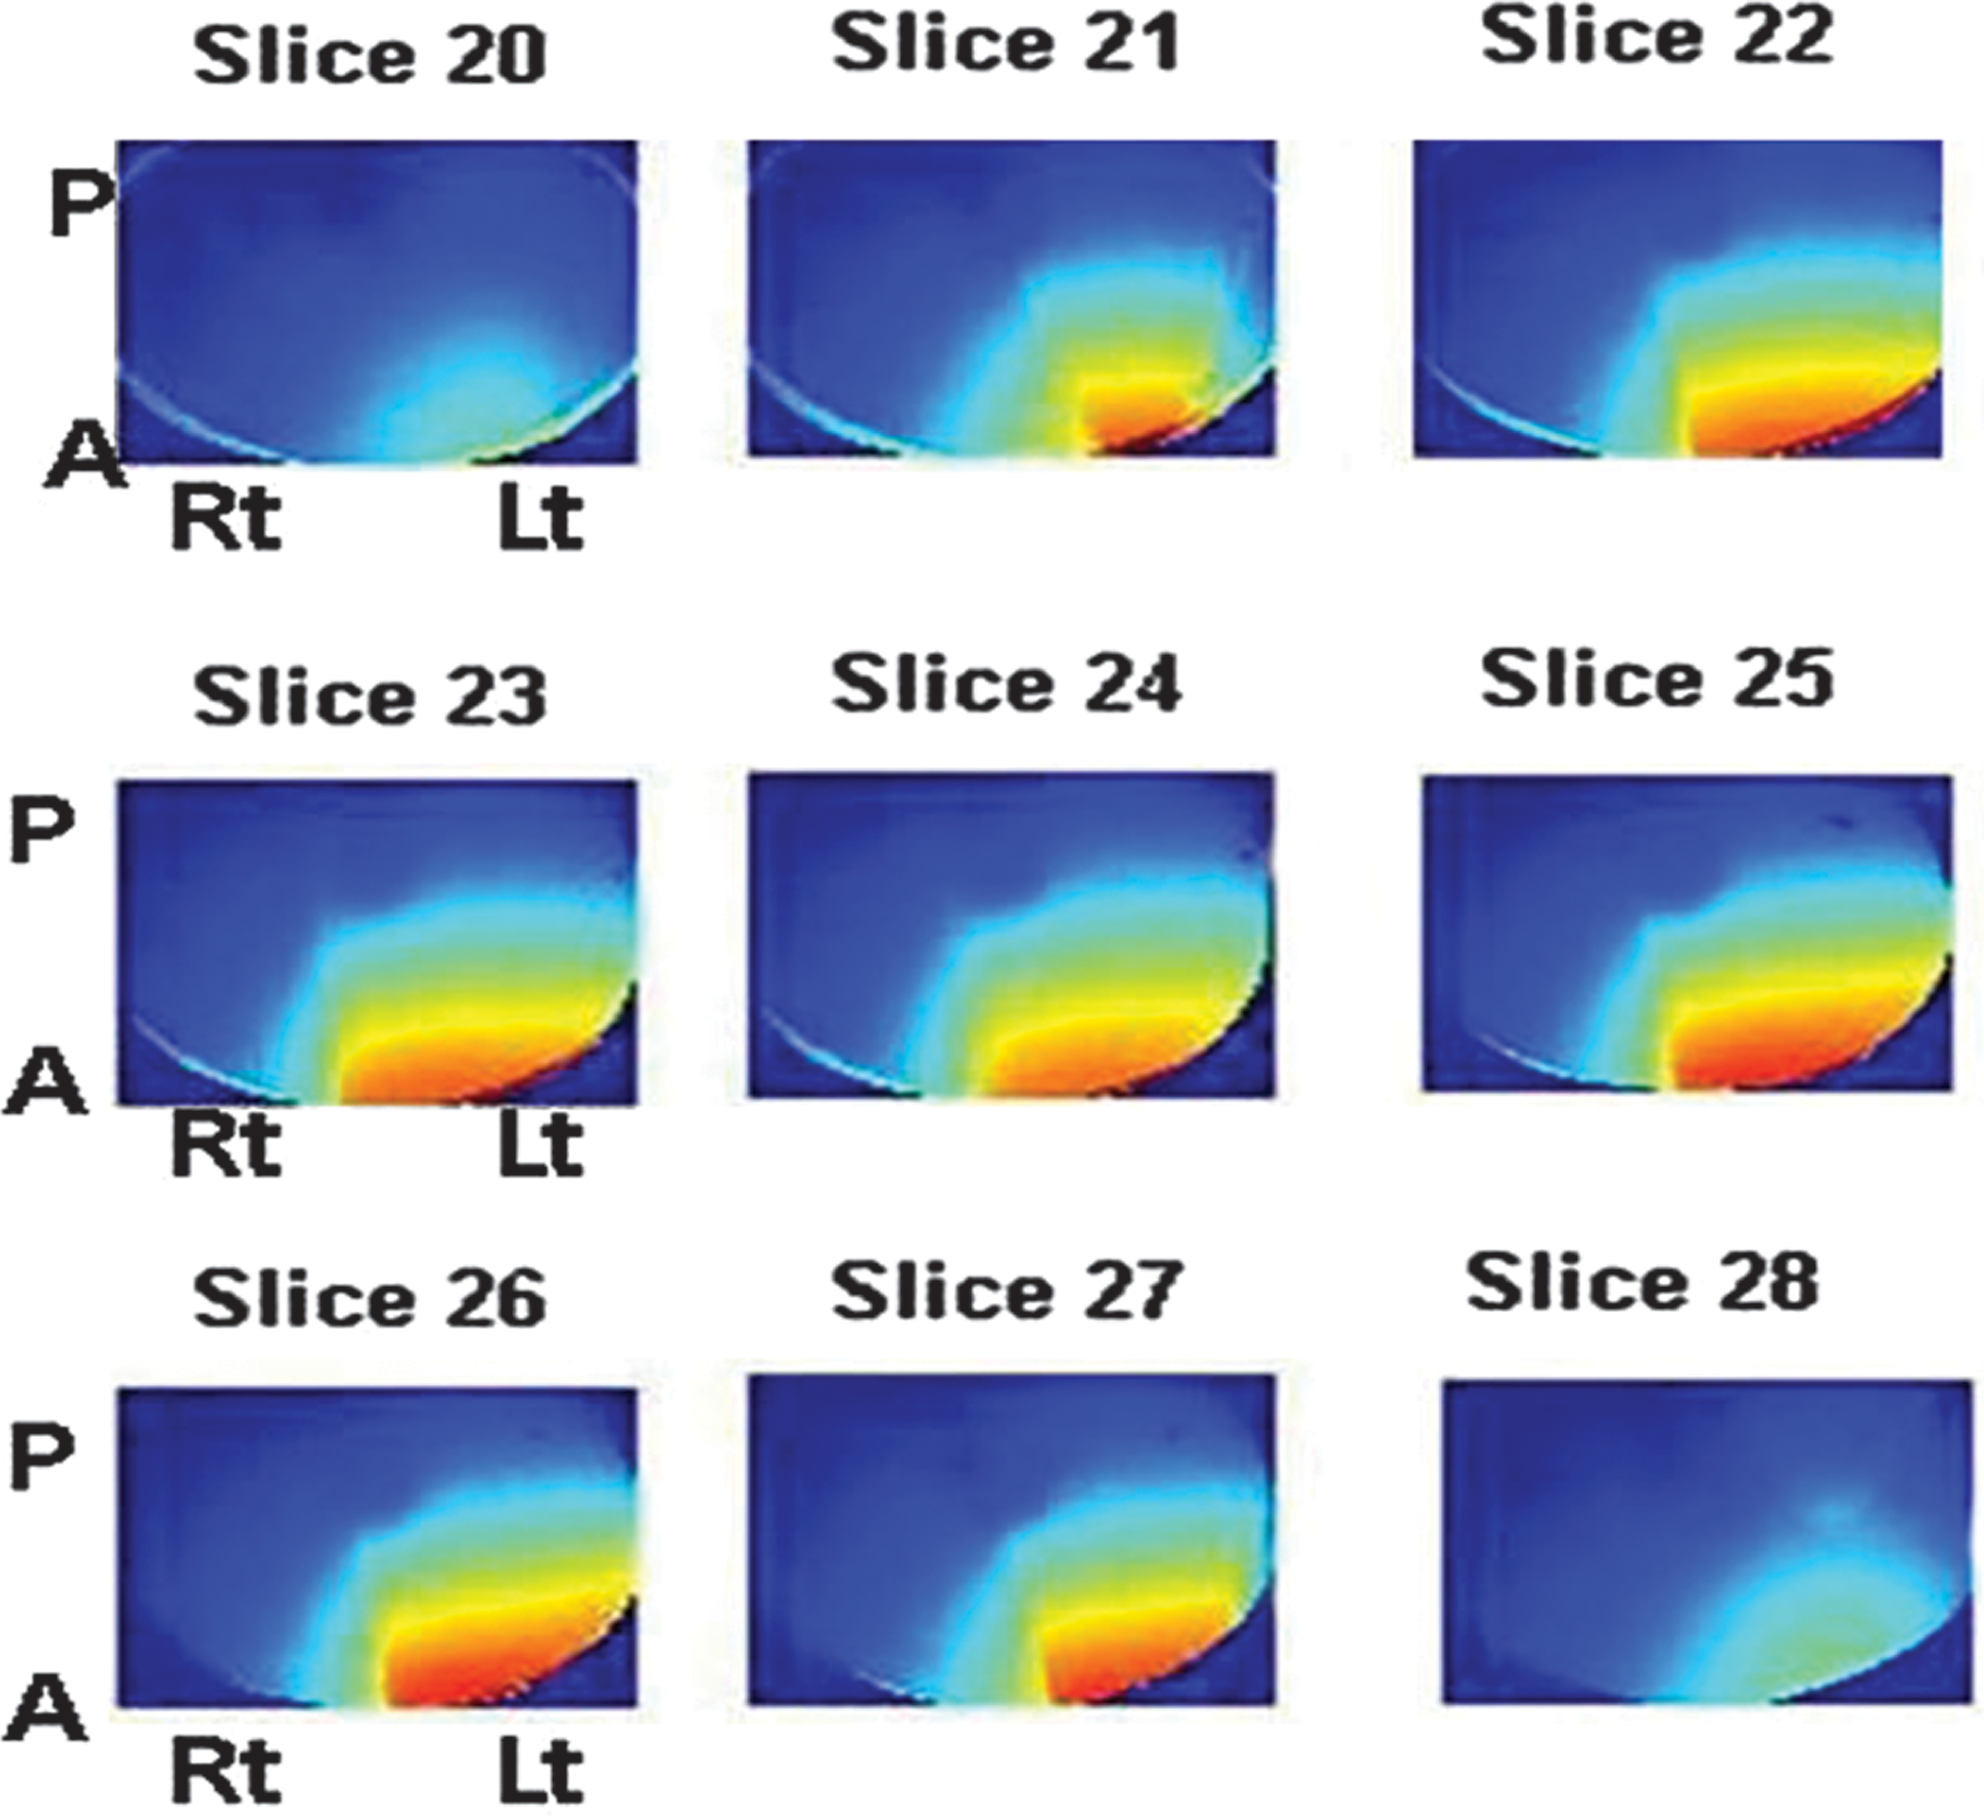
Radiation distribution during left-sided percutaneous nephrolithotomy. Red represents greatest amount of radiation. Radiation source is left (lt) and anterior (A). Slices are from diaphragm (20) to the iliac crest (28).
A total of 20 nonobese males with available data on fluoroscopy time and DAP were identified and included in this analysis. Of these 20 males, 8 had a right PCNL and 12 had a left PCNL. Table 1 summarizes the results. There was no difference between ED-DAP and ED-EDR on the right (P=0.67). ED-EDR was significantly greater than ED-DAP for left-sided PCNL (P=0.033).
BMI=body mass index; DAP=dose area product; EDR=effective dose rate; ED-DAP=effective dose-dose area product; ED-EDR=effective dose-effective dose rate; PCNL=percutaneous nephrolithotomy.
Discussion
Concern for patient radiation exposure is increasing. The annual per capita radiation exposure from medical sources in the United States increased from 0.54 mSv in 1980 to 3.0 mSv in 2006. 4 Use of CT imaging accounted for the majority of this increase. The number of CT scans performed in the United States increased from approximately 3 million in 1980 to 62 million in 2006. 5 It is estimated that 29,000 future cancers in the United States can be attributed to CT scans performed in 2007 alone. 6 Patients with nephrolithiasis are at risk for increased radiation exposure from CT scans. One study found that patients who presented with an acute stone event underwent 1.7 CT scans of the abdomen/pelvis (range 0 to 6) in a 1-year period. 7 They estimated a median effective dose of 29.7 mSv over the 1-year period. These findings did not include radiation from surgical interventions.
PCNL exposes patients to a significant amount of radiation. To our knowledge, the current study is the first to report organ-specific radiation dose and calculate the EDR for PCNL using a validated model. The EDR for a left and right PCNL were calculated to be 0.0208 mSv/s and 0.0144 mSv/s, respectively. Based on our model, nonobese males were exposed to 7.63 mSv on the right and 8.11 mSv on the left. Using a similar model, the ED for a renal stone protocol noncontrast CT of the abdomen and pelvis was determined to be 4.51 mSv. 1 A PCNL exposes patients to nearly twice as much radiation as a renal stone protocol CT (noncontrast renal CT). The radiation exposure from PCNL contributes to stone patients' overall exposure. This finding is particularly important because the number of PCNL procedures more than doubled in the United States between 1988 and 2002. 8
Radiation exposure during PCNL has previously been reported. 9,10 One study determined radiation exposure during PCNL by converting DAP to ED using conversion tables. 9 Fluoroscopy time has also been used as a surrogate for radiation exposure during PCNL. 10 Other investigators have demonstrated that ED determined by indirect methods, such as converting DAP to ED, underestimates radiation exposure. 1,11 In addition, fluoroscopy time is believed to be a poor measure of radiation exposure as it does not correlate with patient dose. 12
Another study determined ED for renal stone protocol abdomen/pelvic CT scans using both a phantom model similar to the one used in this study and by converting dose length product to ED. 1 The authors found that converting dose length product to ED underestimated the ED by 14% compared with the phantom model. Another group determined that CT dose was underestimated by 18% using an indirect measurement method compared with phantom measurements. 11
In the current study, the indirect method of measuring ED, by converting DAP, underestimated radiation exposure from fluoroscopy during PCNL. The ED calculated from EDR was significantly greater than the ED derived from DAP for left PCNL. The ED-EDR was greater than the ED-DAP for right PCNL; however. this finding was not statistically significant. Accurate assessment of radiation exposure during PCNL is important for patient risk stratification and patient counseling. Indirect methods of determining radiation exposure underestimate the ED and thereby underestimate the risk.
Organ-specific dose during PCNL is also important because radiation is not distributed evenly throughout the body during fluoroscopy and organs have different radiosensitivities. The absorbed radiation dose is concentrated near the x-ray emitter, as demonstrated by the radiochromic film images from our phantom (Fig. 5). It decreases farther away from the emitter. Organ radiosensitivity is estimated from data extrapolated from atomic bomb survivors in Japan. 13 The WT is based on the statistical analysis of the long-term increase in cancer incidence and mortality of this population. Organs with higher WT have increased radiosensitivity. The stomach, colon, lung, and red bone marrow have the highest WT.
This finding explains why left PCNL has a greater EDR than right PCNL. The stomach and colon are exposed to greater radiation on the left (0.0749 mGy/s and 0.0524 cGy/s, respectively) vs PCNL performed on the right (0.0232 cGy/s and 0.0239 cGy/s). The internal organ with the greatest radiation exposure on the right, the gallbladder, has a WT that is more than 10 times lower than the WT for the stomach and colon. Because different organs have different radiosensitivities, knowing organ specific dose allows for better risk assessment and counseling for patients who are undergoing PCNL.
The skin entrance site absorbs the greatest amount of radiation during both left and right PCNL. Radiation-induced skin injury has been reported at doses as low as 2 Gy. 14 These usually involve transient erythema in the involved area that resolves over time. Significant skin injury can occur at doses as low as 5 Gy. In our nonobese male phantom, the absorbed dose rate for the skin entrance was 0.25 mGy/s for both sides. Nonobese male patients are at risk for skin injury after 1000 seconds (16 min) of fluoroscopy time. This is not an unreasonable amount of fluoroscopy time for complex cases necessitating multiple access sites. Obese patients will be at risk for skin injury in less time because the C-arm will increase the tube potential (kVp) to increase penetration. This configuration increases the amount of radiation emitted per unit time. For patients with prolonged fluoroscopy times, their abdominal skin should be examined at follow-up. Skin injuries may not be evident for several weeks after the exposure. 14
There are several limitations to the present study. Radiation exposure was only measured with the C-arm in the straight AP orientation. Often during percutaneous access, the C-arm is rotated toward the surgeon while placing the needle. When the orientation of the C-arm changes, the amount of radiation to different organs may change. In our experience, the C-arm is maintained in the straight AP orientation for the majority of the fluoroscopic time during PCNL. In addition, in a previous study, we found the differences in organ doses among different C-arm orientations was small. 15 The small number of patients included in this previous retrospective dataset makes it difficult to interpret statistical analyses comparing the ED calculated directly and indirectly. Another limitation is that our phantom represents a nonobese male. Obesity is a risk factor for stone disease, 16 and obesity is a risk factor for increased radiation exposure during PCNL. 9 Future studies are needed to accurately determine the radiation exposure for obese patients during PCNL.
Conclusions
PCNL exposes patients to a significant amount of radiation. The distribution of radiation exposure during PCNL is not uniform. Determining organ-specific radiation doses and calculating the ED is a more accurate method of reporting on patient exposure during PCNL. ED is a manner of reporting radiation dose risks because this technique takes into account organ doses and relative radiosensitivities. Patients with prolonged fluoroscopy time during PCNL are at risk for radiation-induced skin injuries. Further investigations are needed to determine the long-term implications of these elevated radiation doses during percutaneous stone removal.
Footnotes
Disclosure Statement
No competing financial interests exist.