
Abstract
Background and Purpose:
Multiple renal volumetric assessment studies have correlated parenchymal volume with the glomerular filtration rate. The objective of this study was to compare renal volumes before and after treatment of renal masses with either partial nephrectomy or radiofrequency ablation (RFA).
Patients and Methods:
We reviewed our prospectively collected database of patients with renal masses who were treated between November 2001 and January 2011 with robot-assisted laparoscopic partial nephrectomy (RALPN), laparoscopic RFA (LRFA), or CT-guided percutaneous RFA (CTRFA). Digital Imaging and Communications in Medicine CT imaging data were analyzed in an open-source viewer. Volumetric calculations were used to measure the normal, enhancing bilateral renal parenchyma and tumor volumes. Normal parenchymal volume loss was compared among treatments.
Results:
There were 96 patients (68 men) with an average age of 68.0 (36–84) years who met our inclusion criteria. The average tumor diameter, tumor volume, and nephrometry score (NS) was 3.5 cm, 32.0 cm3, and 7.1 in RALPN (n=26), 2.6 cm, 9.8 cm3, and 7.1 in CTRFA (n=47), and 2.9 cm, 14.3 cm3, and 7.2 in LRFA (n=23) groups. The percent change in the operated kidney volume was similar in RALPN (−12%±15), CTRFA (−13%±16), and LRFA (−17%±18) groups. NS was the only variable in a multivariate linear regression model that correlated with the amount of volume lost in the ipsilateral kidney.
Conclusions:
Our retrospective volumetric analysis of renal parenchyma before and after partial nephrectomy or RFA of renal masses revealed that all treatments produce similar volume of collateral damage.
Introduction
Patients and Methods
Patient selection and surgical methods
We reviewed our prospectively collected database of patients with renal masses who were treated between November 2001 and January 2011 with robot-assisted laparoscopic partial nephrectomy (RALPN), laparoscopic RFA (LRFA), or CT-guided percutaneous RFA (CTRFA). Patients with multiple tumors and those without available contrasted CT imaging before and after treatment were excluded from analysis.
LRFA and CTRFA was performed using a technique published previously. 13 LRFA was performed through a transperitoneal approach, while CTRFA was performed percutaneously with the patient under general anesthesia lying prone in the CT scanner. We positioned fiberoptic thermal sensors at the tumor periphery with ultrasonographic guidance in LRFA or CT in CTRFA. A single probe or multiple 2 cm or 3 cm Cool-tip™ ablation probes (Covidien Inc, Boulder, CO) were advanced into the tumor, and RFA commenced with simultaneous peripheral fiberoptic thermometry (Lumasense, Santa Clara, CA) to measure treatment end points of >60°C. Ablation times varied with each patient.
RALPN cases were performed through a transperitoneal approach with warm ischemia induced with bulldog clamps. The “sliding clip” technique as described by Bhayani and Figenshau 14 was used in renorrhaphy. Surveillance in all patients was performed with contrasted CT scan at 1, 6, and 12 months, and annually thereafter.
Imaging methods
CT scanning was performed with the SOMATOM Sensation 64-slice scanner (Siemens, Forchheim, Germany). The same “renal mass” protocol was used in all patients with 150 mL of intravenous Isovue-370 (iopamidol) contrast agent given at a rate of 4 mL/s. Precontrast imaging is followed by an arterial phase when the aorta measures 40 Hounsfield units. Eighty seconds later, the venous phase is obtained. Finally, a delayed phase is obtained at 7 minutes and repeated if delay in excretion is seen.
Renal volume assessment
Digital Imaging and Communications in Medicine (DICOM) CT imaging data were exported and analyzed in the open-source, Food and Drug Administration (FDA) approved, OsiriX viewer version 3.9.4 (Pixmeo, Geneva, Switzerland). The 5-mm venous phase slices of the renal mass protocol CT scan revealed the best enhancement of the entire functioning parenchyma. The two-dimensional (2-D) segmentation of the “Grow Region” threshold algorithm of each consecutive CT scan slice was used to “highlight” the functioning renal parenchyma (“region of interest,” ROI). The editing function was used to remove any renal vessels, collecting system, sinus fat, or tumor if the software did not exclude it automatically. The software automatically “filled in” the volumes between each slice of CT data and constructed a three-dimensional (3-D) figure with total volume computation (Figs. 1 and 2). The editing “brush” function was used to separately highlight the tumor, and the software would automatically compute its 3-D volume. One junior resident and two research fellows performed the analysis. The renal ROIs were reciprocally inspected among the research personnel. Each renal unit took an average 10 minutes to assess.

Kidney preoperative imaging:
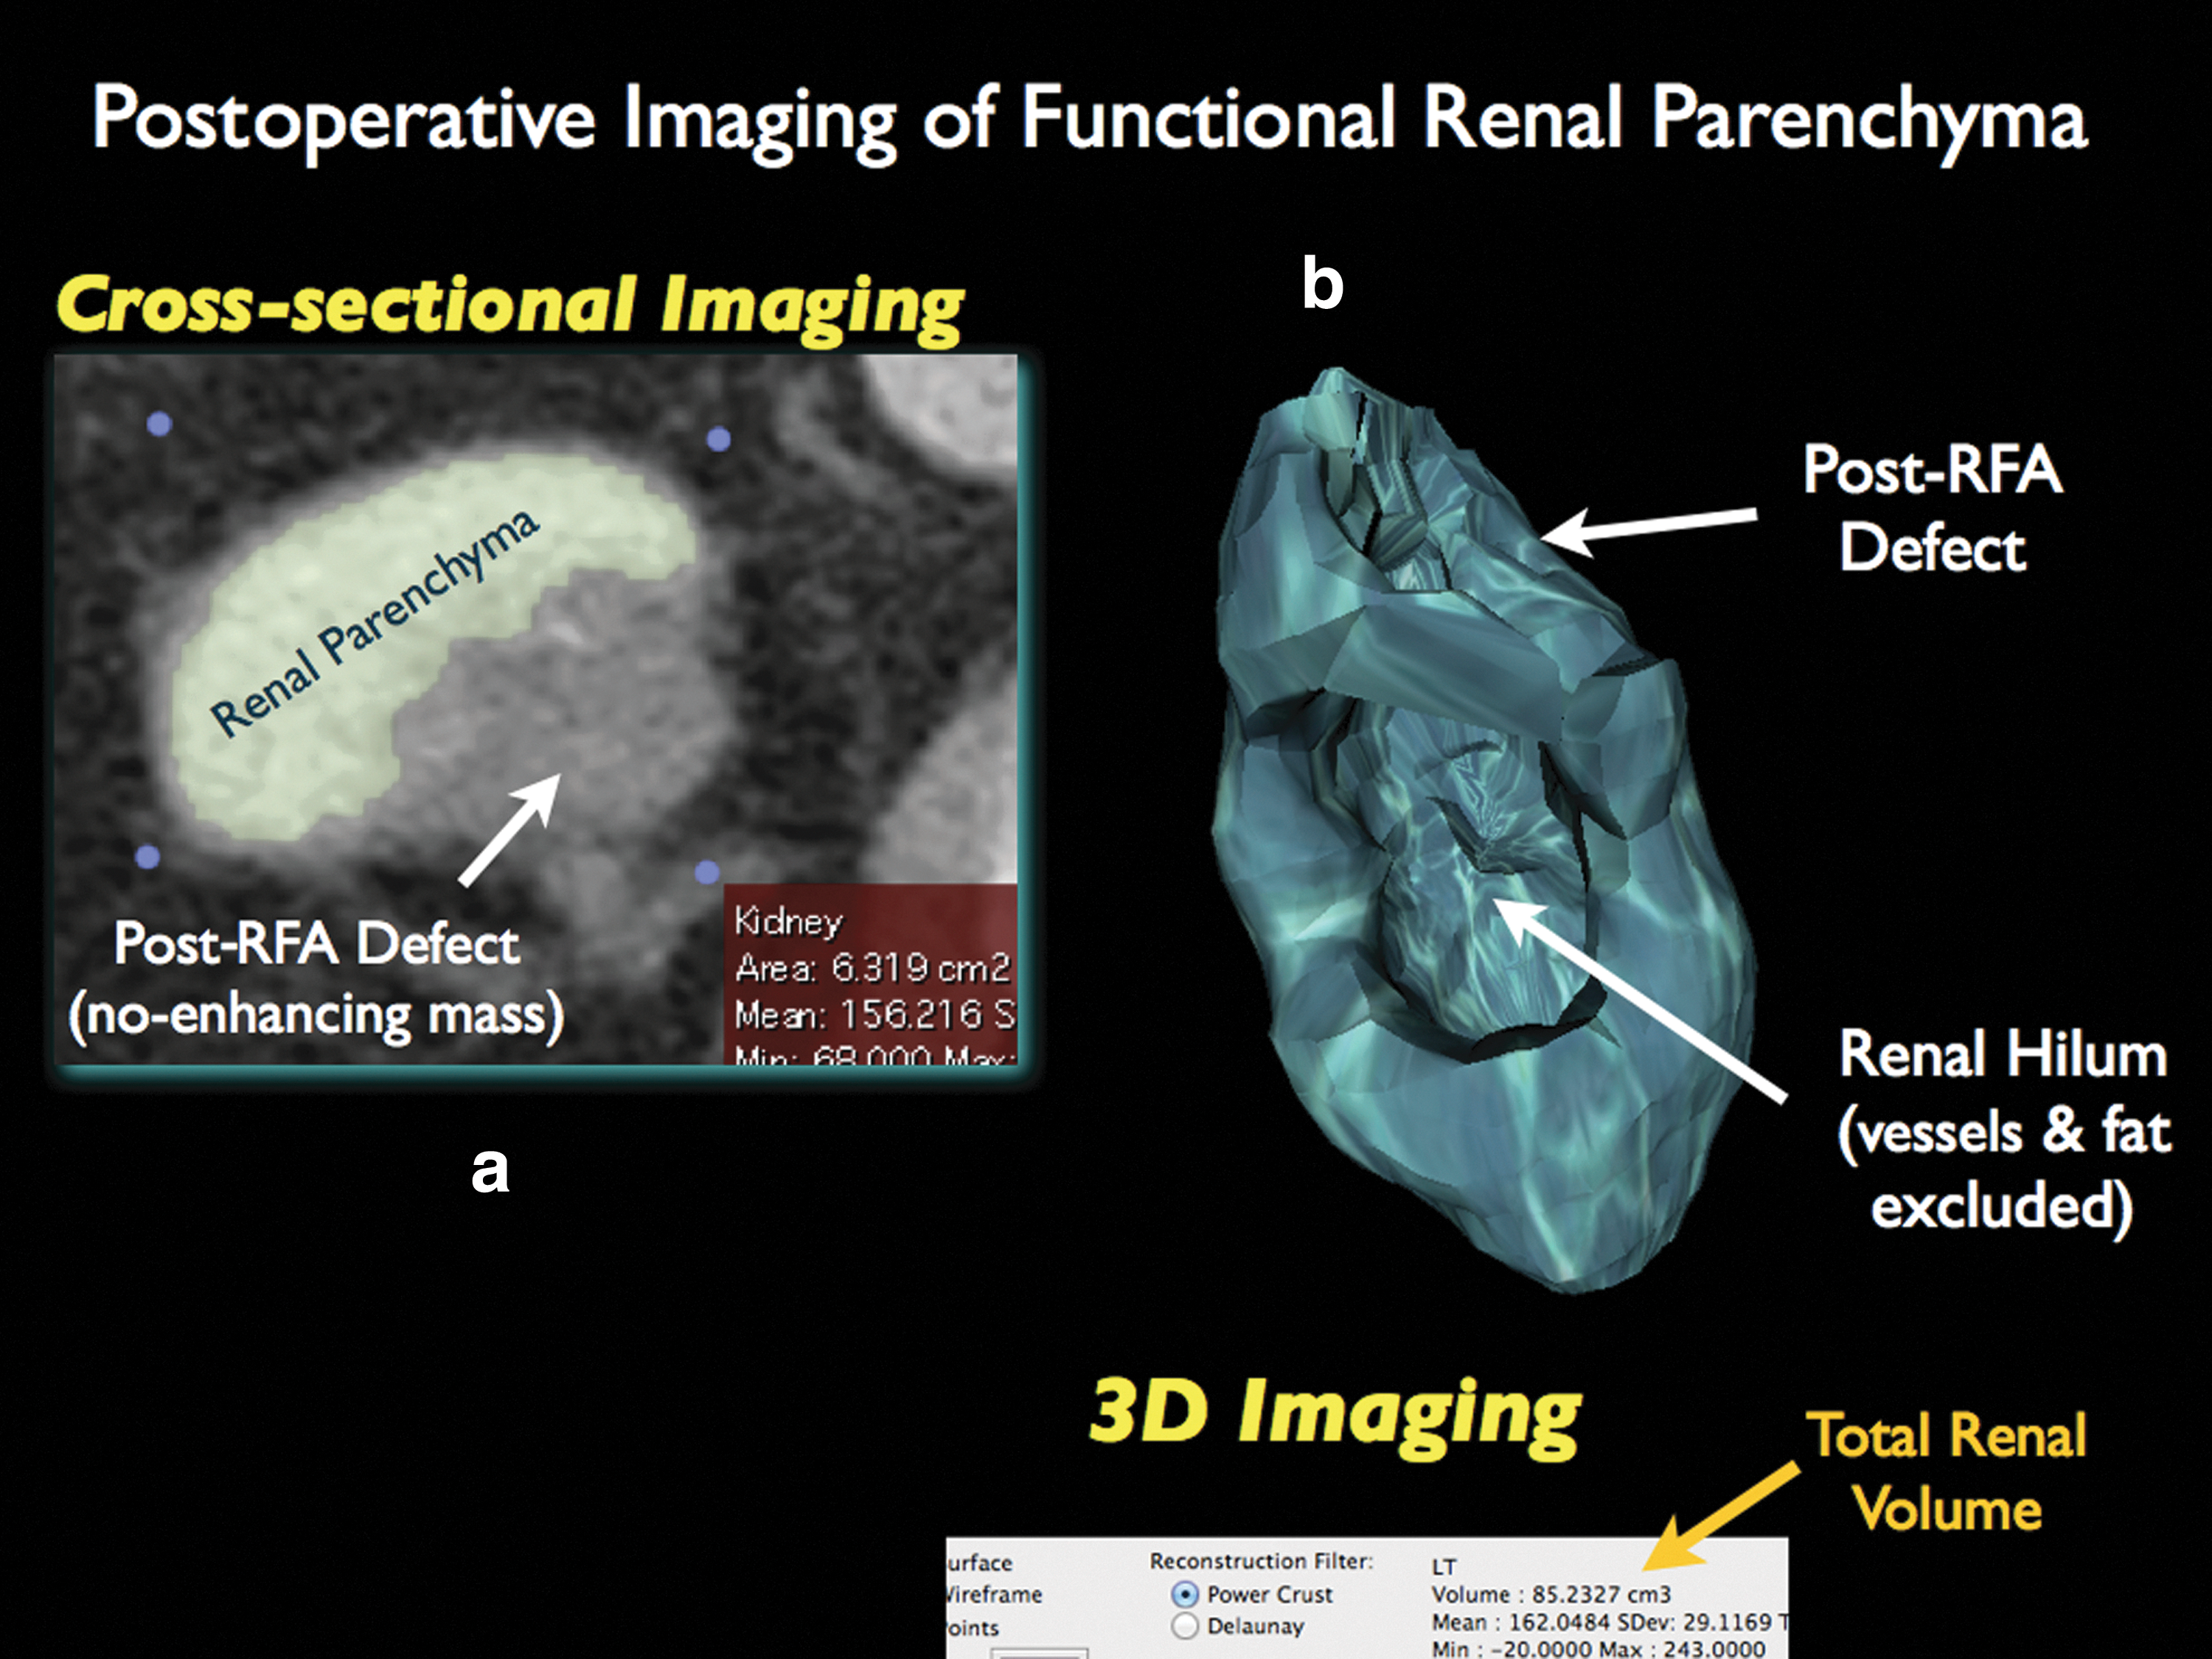
Post-radiofrequency ablation imaging:
Although the OsiriX is FDA approved for clinical use, 15 we decided to internally validate the volumetric function of the software by running measurements against a known volume phantom, a 450 mL bottle of contrast, and had three different researchers run 20 measurements of the same object. The mean calculated volume of the phantom was 449.57±3.27.
Statistical methods
Means were compared with the Mann-Whitney and Kruskal-Wallis tests. A multivariate linear regression analysis was also performed to determine the independent impact of the treatment modality on functioning parenchymal volume reduction. This test included the covariates of sex, age, tumor volume, nephrometry score (NS), time interval between pre- and postoperative CT imaging, and total preoperative parenchymal volume.
Results
A total of 96 patients (68 men) with an average age of 68.0 (36–84) years met our inclusion criteria. The average tumor diameter, tumor volume, and NS was 3.5 cm, 32.0 cm3, and 7.1 in RALPN (n=26), 2.6 cm, 9.8 cm3, and 7.1 in CTRFA (n=47), and 2.9 cm, 14.3 cm3, and 7.2 in LRFA (n=23) groups (Table 1).
RALPN=robot-assisted laparoscopic partial nephrectomy; CTRFA=CT-guided radiofrequency ablation; LRFA=laparoscopic radiofrequency ablation; BMI=body mass index; AACCI=Age Adjusted Charlson Comorbidity Index.
Median time of postoperative CT scan used in the analysis was 7 months (1–61 mos). When comparing all three groups, no statistical difference was found between change and percent change in the operated kidney renal volume or total renal volume. Minimal contralateral renal hypertrophy was noted in all groups (Table 2). Mean warm ischemia time in the RALPN group was 24±10.6 minutes. NS was the only variable in a multivariate linear regression model that correlated with the amount of volume lost in the operated kidney.
means±standard deviation
All RFA vs RALPNx.
RALPN=Robot-assisted laparoscopic partial nephrectomy; CTRFA=CT-guided radiofrequency ablation; LRFA=laparoscopic radiofrequency ablation; NS=not statistically significant.
Discussion
The 2009 American Urological Association guidelines for the treatment of small renal masses recommend nephron-sparing treatments for clinical T1a disease in patients with increased surgical risk, yet remains an option for healthy patients with clinical T1a tumors and all patients with clinical T1b disease. 1 Apart from rough estimates from cross-sectional imaging, nuclear renal scintigraphy, 16 and serum or urine based estimated glomerular filtration rate (GFR) calculations, however, there is no refined method of defining renal preservation after nephron-sparing surgery.
Methods in volumetric assessment
With the advent of cross-sectional imaging (CT and MRI), several groups have described its use in computation of renal volume and correlation with GFR. 5,8,10 –12 The methodology in obtaining the imaging, slice thickness, timing of contrast, selection of the ROI, and calculation of volume has varied. Earlier articles relied on estimation of the renal volume based on an ellipsoid method that is widely used in the renal ultrasound volume calculations. This method, however, has been shown to significantly underestimate renal volumes. 17,18 Currently, published studies on renal volume assessment in cross-sectional imaging (CT or MRI) are based on the disc-summation method. With this technique, the volume is calculated as the product of slice thickness and the ROI area. Most studies, however, relied on manual outlining of the ROI, which is tiresome, time-consuming, and operator dependent.
A cylindrical volume method was recently proposed as a process of measuring renal volumes before and after partial nephrectomy. 19 This method assumes that the kidney is in the shape of a cylinder and thus applies the formula of V=π*radius2*height. This methodology does not account for great variability in renal anatomy. The authors expressed that a formal volumetric analysis would be ideal, but thought that this “requires sophisticated software and technical expertise.”
Our goal, therefore, was to provide both accurate and precise volumetric assessments with software that was intuitive and thus had a short learning curve. The OsiriX software is one of many commercially available DICOM viewers with capabilities to highlight a 2-D and 3-D ROI based on threshold algorithm parameters. This feature eliminates the tedious task of outlining the ROI as done by previous software. The only limitation is that the software does not automatically recognize and exclude some portion of the kidney that enhances but does not contribute to renal function—i.e., renal vessels. Thus, a person familiar with renal anatomy can manually eliminate those portions of the enhanced region that do not belong to the renal parenchyma. This method has been previously described but was performed on software that is not open source. 20,21
Renal volume assessment in oncology
In the oncologic arena, the use of renal volume has been applied in the prediction of postoperative renal function. Tanaka and associates 6 were able to demonstrate statistically significant correlation between the postoperative calculated GFR and the actual serum GFR at 2 to 4 weeks after renal surgery in a cohort of patients undergoing a radical or a partial nephrectomy. 6 Sharma and colleagues 20 used volumetric software with automated segmentation algorithms, similar to OsiriX, and revealed that in their 42 patient cohort, the mean percent renal function loss after partial nephrectomy was 19.7% (0–45.4). The major weakness of this study is that the volumetric analysis was based on a total volume (as measured on noncontrasted imaging) minus tumor and renal cyst volumes on contrasted imaging. Noncontrasted imaging, however, overestimates the parenchymal volume because it includes the collecting system and renal vessels.
Jeon and coworkers 22 used automated segmentation algorithms in 83 radical and 50 partial nephrectomy patients and revealed a mean volume of the normal side kidney for the radical nephrectomy group increased by 17.2% at 6 months postoperatively. In the partial nephrectomy group, the volume of the normal side kidney increased by 9.1%, while the volume of the operated kidney decreased by 20.1% at 6 months postoperatively.
Finally, Simmons and associates 19,23 used their cylindrical volume ratio method and published two reports on partial nephrectomy and renal volume analyses. In 39 patients undergoing a partial nephrectomy, the median change in operated kidney volume was −12% and total bilateral renal volume was −6%. 19 In a second analysis of 301 patients undergoing a partial nephrectomy, the median %Δ total renal volume was −9%. Interestingly, they were able to demonstrate that in a partial nephrectomy, GFR changes correlated more with the drop in renal volume rather than ischemia time. 23 The major limitation the authors highlighted is the accuracy of their volume estimation method, as discussed above. In addition, the authors did not measure the contralateral renal volume but assumed it is equal preoperatively to the operated kidney. Also, it was not clear whether contralateral renal volume was measured postoperatively.
Our study adds to the literature by demonstrating that the treatment of small renal masses with either partial nephrectomy or RFA with peripheral temperature monitoring (CT-guided or laparoscopic) results in similar collateral damage to the renal parenchyma. The results on partial nephrectomy renal volumes are similar to the above-mentioned studies. We base these results on renal volumes measured in the most accurate and precise method of contrasted CT volume assessment with software that is open source and fairly simple to use and minimizes observer variations. Our method that focuses strictly on functional bilateral renal parenchyma decreases the inaccuracy of volume assessments that assume equality of bilateral renal volumes, or assign a cylindrical or elliptical shape to the kidney.
The limitations of our study include its retrospective design. In addition, we regret that the available CT scans did not have similar postoperative timing. Although previous studies do not show drastic renal volume or GFR changes over time, we noticed that a few patients might have anatomic changes (hydronephrosis or caliectasis postoperatively) that take months or years to develop and ultimately affect renal volume. We hope that future follow-up volumetric studies will better reflect parenchymal changes over a long period after surgical intervention.
Conclusion
Our retrospective volumetric analysis of functioning renal parenchyma before and after partial nephrectomy or RFA of renal masses revealed similar preservation of parenchymal volume. We believe that the technology to quickly and effortlessly assess renal volume is easily available and will play a larger role in prediction of renal mass preservation and renal function in the arena of nephron-sparing surgery.
Footnotes
Disclosure Statement
Dr. Leveillee participates in a scientific study for Angiodynamics Inc, is a consultant for a scientific study for Covidien, a lecturer for Cook, a proctor for Intuitive Surgical, and a lecturer for Applied Medical. Dr. Gorbatiy is a lecturer for Applied Medical. For the remaining authors, no competing financial interests exist.