
Abstract
Background:
The purpose of our study was to determine, in vivo, whether single-energy noncontrast computed tomography (NCCT) can accurately predict the presence/percentage of struvite stone composition.
Methods:
We retrospectively searched for all patients with struvite components on stone composition analysis between January 2008 and March 2012. Inclusion criteria were NCCT prior to stone analysis and stone size ≥4 mm. A single urologist, blinded to stone composition, reviewed all NCCT to acquire stone location, dimensions, and Hounsfield unit (HU). HU density (HUD) was calculated by dividing mean HU by the stone's largest transverse diameter. Stone analysis was performed via Fourier transform infrared spectrometry. Independent sample Student's t-test and analysis of variance (ANOVA) were used to compare HU/HUD among groups. Spearman's correlation test was used to determine the correlation between HU and stone size and also HU/HUD to % of each component within the stone. Significance was considered if p<0.05.
Results:
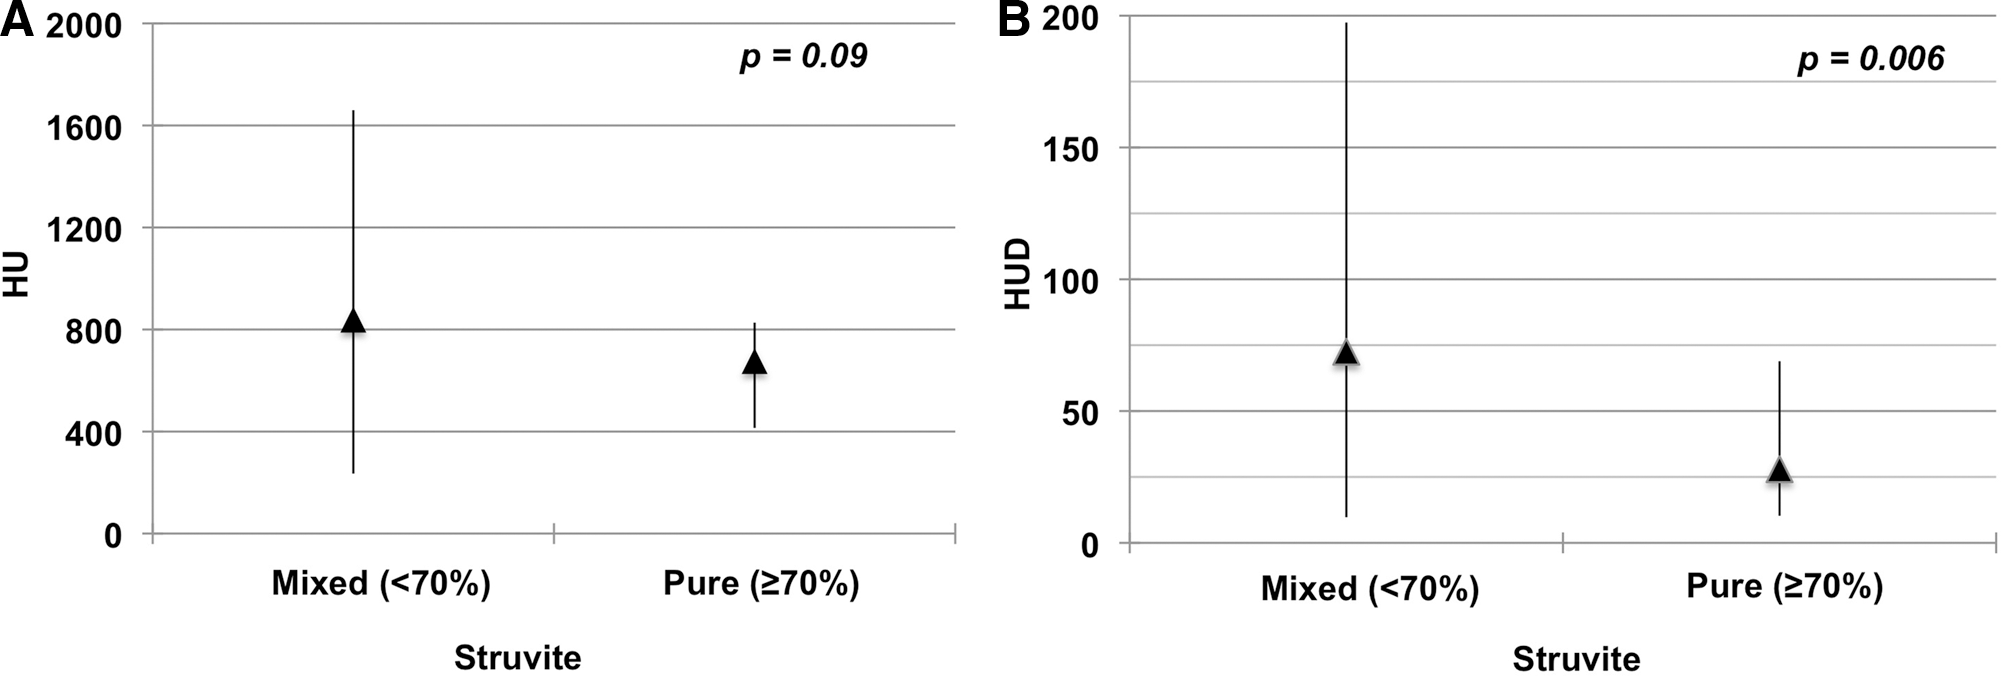
Fourty-four patients met the inclusion criteria. Struvite was the most prevalent component with mean percentage of 50.1%±17.7%. Mean HU and HUD were 820.2±357.9 and 67.5±54.9, respectively. Struvite component analysis revealed a nonsignificant positive correlation with HU (R=0.017; p=0.912) and negative with HUD (R=−0.20; p=0.898). Overall, 3 (6.8%) had <20% of struvite component; 11 (25%), 25 (56.8%), and 5 (11.4%) had 21% to 40%, 41% to 60%, and 61% to 80% of struvite, respectively. ANOVA revealed no difference among groups regarding HU (p=0.68) and HUD (p=0.37), with important overlaps. When comparing pure struvite stones (n=5) with other miscellaneous stones (n=39), no difference was found for HU (p=0.09) but HUD was significantly lower for pure stones (27.9±23.6 v 72.5±55.9, respectively; p=0.006). Again, significant overlaps were seen.
Conclusions:
Pure struvite stones have significantly lower HUD than mixed struvite stones, but overlap exists. A low HUD may increase the suspicion for a pure struvite calculus.
Introduction
Stone composition plays an important role in managing patients with stone disease. Efforts have been made to predict stone composition prior to initial treatment. The primary rationale is to avoid unnecessary surgical interventions in patients in whom medical dissolution could be accomplished, specifically in those with uric acid (UA) stones. Second, shockwave lithotripsy (SWL) is known to have less favorable outcomes with some stone compositions, namely, cystine and calcium oxalate monohydrate (CaOMH). Lastly, identifying patients with struvite stones prior to surgery may tailor the surgical approach utilized, the selection and duration of perioperative antibiotics, and the intensity and duration of postoperative monitoring. While clinical and urinary parameters may increase the suspicion of a struvite stone (alkaline pH and recurrent infections with urease-producing organisms), so far a definitive diagnosis can only be made after stone analysis.
The ability of NCCT to determine stone composition has been tested for three decades. Initial studies were conducted with technology that is not considered out-dated. 3 –5 Most in-vitro studies have shown that measurement of Hounsfield unit (HU) on NCCT can only be used to distinguish stone composition among pure stones. 6 –11 More recently, in-vivo studies have shown that absolute attenuation value (HU) and attenuation-to-size ratio [HU density (HUD)] help distinguish calcium from UA calculus 12 –15 and also may identify calcium stone subtypes. 16 To date, however, there have been no investigations to evaluate the capability of NCCT to identify the presence of a struvite stone component. The purpose of our study was to determine, in vivo, whether single-energy NCCT can be used to identify the presence and percentage of struvite stone composition.
Patients and Methods
After Institutional Review Board approval, we retrospectively searched for all patients with struvite components on stone composition analysis between January 2008 and March 2012. Patients were selected if they had an NCCT prior to stone analysis, with a minimum stone size of 4 mm. This size was selected as our stone protocol NCCT is performed with a slice width of 3 mm and partial-volume inaccuracies could occur if we analyzed smaller stones. Further, the clinical relevance of smaller stones is debatable as they have a higher chance of spontaneous passage.
All stones were retrieved after ureteroscopy (URS), percutaneous nephrolithotomy (PCNL), cystolitholapaxy, or nephrectomy or by the patient after spontaneous passage or SWL. Stone analysis was performed via Fourier transform infrared spectrometry. Our analysis took in consideration the percentage of struvite component within the stone. We categorized stones as pure struvite if they were composed of >70% magnesium ammonium phosphate, according to previous publications. 6 Also, we compared stones by separating those with <20% struvite, 20% to 40%, 41% to 60%, 61% to 80%, and >80% struvite.
Stone protocol NCCT was performed using a 64-detector row helical CT scanner at 120 kV, 240 mA, with 3 mm collimation. A single urologist, blinded to stone composition, reviewed all NCCT to avoid discrepancies in measurement technique. Stone location, dimensions, and HU were measured on NCCT. Magnification of the stone and its surroundings was used to allow precise measurement of stone parameters. The transverse diameter of the stone on each slice was measured in millimeters. The image slice containing the two largest transverse diameters of the stone was used to characterize stone size and to measure absolute HU value. The absolute HU attenuation value for each stone was calculated by measuring a central region of interest for each stone (25 pixels per region of interest) in the previous chosen slice. HUD was also calculated for each stone by dividing the mean HU for each stone by its largest transverse diameter.
Statistical analysis was performed with SPSS Version 19 (SPSS, Inc., Chicago, IL). Descriptive statistics including the mean and standard deviation for HU attenuation value and HUD were calculated for each stone composition group as previously described. Independent sample Student's t-test and one-way analysis of variance (ANOVA) were used to compare HU and HUD among groups. Spearman's correlation test was used to determine the correlation between HU value and stone size and also to correlate different HU/HUD to the percentage of each component within the stone. The level of significance was set at p<0.05.
Results
A total of 44 patients met the inclusion criteria. Overall stone composition characteristics, tomographic findings, and treatment modalities are presented in Table 1. Struvite was the most prevalent component with mean percentage of 50.1%±17.7% (5%–80%; median of 60%). The least common component was UA (mean 3.6%±8.9%). Mean HU and HUD were 820.2±357.9 (235–1660) and 67.5±54.9 (9.7–197.4), respectively. Stone size ranged from 4 to 114 mm (mean 22.9±22.6 mm) and median stone size was 15 mm. The wide range can be explained by the fact that while 12 (27.3%) patients had staghorn calculi, most patients (16; 36.4%) had single calyceal stones. The most common treatment modality was PCNL in 22 (50%) patients, followed by URS in 14 (31.8%) patients.
CaOx=calcium oxalate; CaPh=calcium phosphate; HU=Hounsfield unit; HUD=HU density; PCNL=percutaneous nephrolithotomy; URS=ureteroscopy; SWL=shockwave lithotripsy.
The first correlation studied was between size and HU. When plotting mean HU against stone size in millimeters, a positive but nonstatistically significant correlation was found (R=0.233; p=0.28). A similar correlation was tested between the percentage of each stone composition against the corresponding HU and HUD. Struvite component analysis revealed a nonsignificant positive correlation against HU (R=0.017; p=0.912; Fig. 1A) and negative against HUD (R=−0.20; p=0.898; Fig. 1B). Calcium oxalate (CaOx) percentage showed no significant correlation against HU (R=0.061; p=0.694) but showed a positive significant correlation with HUD (R=0.329; p=0.029). Calcium phosphate (CaPh) percentage was found not to significantly correlate to HU (R=−0.029; p=0.851) and HUD (R=−0.25; p=0.872). The same was seen for UA stones (R=−0.162; p=0.293 for HU and R=−0.225; p=0.142 for HUD).
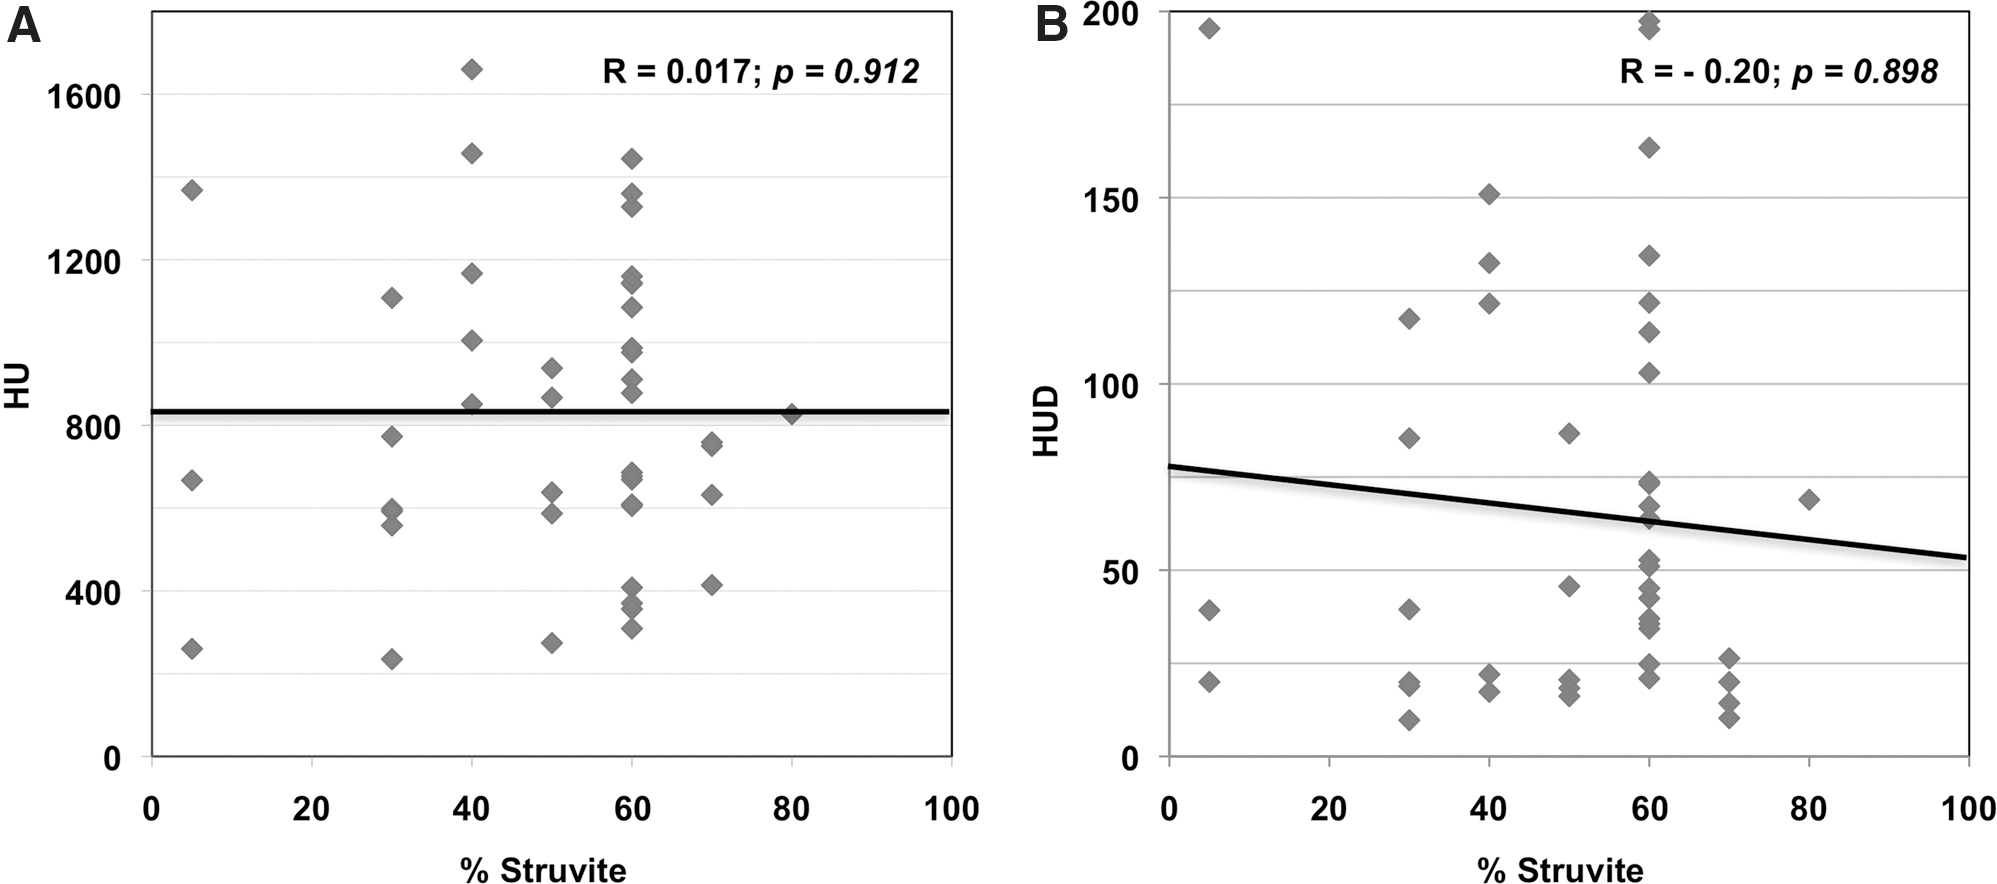
Struvite component analysis revealed a non-significant positive correlation against HU
Of the 44 patients, 3 (6.8%) had <20% of struvite component; 11 (25%), 25 (56.8%), and 5 (11.4%) had 21% to 40%, 41% to 60%, and 61% to 80% of magnesium ammonium phosphate, respectively. No patient had a stone constituted of >80% struvite (Table 2). ANOVA revealed no difference among groups regarding HU (p=0.68) and HUD (p=0.37). Both for HU and HUD we found important overlaps between groups (Fig. 2). When comparing pure struvite stones (n=5) with other miscellaneous stones (n=39), no difference was found for HU (p=0.09; Fig. 3A). On the other hand, HUD was significantly lower for pure stones (mean HUD was 27.9±23.6 v 72.5±55.9, respectively; p=0.006; Fig. 3B). Although statistically significant differences in HUD were identified, significant overlap for HUD among groups prevented the ability to establish a “strict cutoff” for the presence of struvite stones.

Distribution of Hounsfield Unit
Distribution of Hounsfield Unit
Analysis of variance.
Student's t-test.
Discussion
NCCT is the gold-standard modality for evaluation of patients with stone disease, with sensibility of 96% and specificity of 99%. 17 It is a safe and fast procedure, which provides precise information regarding stone location, size, hardness, and depth. The ability of NCCT to predict stone composition has been investigated for decades and some controversy persists. There are known factors that may alter HU measurement on NCCT. First, the relationship between collimation and stone size must be adequate. If stone dimension is smaller than collimation size, the measured calculus attenuation will be susceptible to partial-volume inaccuracy. 8 In our analysis, only stones 4 mm or larger were included because the standard collimation size used in our stone protocol NCCT is 3 mm. Second, the window used to visualize the stone is important. The bone window allows precise measurement of stone dimensions. However, different NCCT windows do not alter HU. 18 In our research, we magnified the stone area to allow exact measurement. Third, there is some debate whether patient body habitus can alter HU measurement or not because of radiation penetration. In-vitro studies do not address that issue and this may explain the discrepancies in findings between in-vitro and in-vivo investigations. Finally, stone size correlates with radiodensity and this phenomenon was demonstrated for the first time by Saw et al 8 when performing in-vitro stone analysis. They also found that the smaller the collimation size, the better the accuracy in predicting stone composition. Similar results were obtained in vivo by Motley et al. 13
In-vitro studies were optimistic for the ability of NCCT to predict stone composition. Older studies used tomographic technology and technique that are no longer utilized. 3 –5 More recently, Mostafavi et al 9 studied 102 pure stones on NCCT at both 80 and 120 kV with 1 mm collimation (Table 3). They were able to distinguish struvite, cystine, and CaOx stones at 120 kV, but only with dual-energy CT could they successfully differentiate other stone components with analogous densities. Though dual-energy NCCT was able to predict stone composition, there were significant overlaps in HU values among groups.
NCCT=noncontrast computed tomography; UA=uric acid; CaOMH=calcium oxalate monohydrate; CaODH=calcium oxalate dihydrate.
Several other authors have reported similar results when performing in-vitro investigations. 6 –10 Deveci et al 6 studied 107 stones with dual-energy NCCT using an air-filled environment instead of water and fat used by previous authors. Dual-energy technique was inaccurate to predict stone composition. However, they found that the NCCT HU absolute value at 120 kV was able to distinguish all kinds of pure stones. For mixed stones, they measured three different regions in each one and the HU obtained for those areas was accurate in determining the stone composition, distinguishing UA from struvite and calcium calculus. No overlaps were reported for mean NCCT density values for five of the six groups of pure stones. Nevertheless, overlaps were frequent in NCCT densities between the three regional measurements in different groups of renal stones. In contrast, El-Assmy et al 11 reported that high-resolution dual-energy NCCT was unreliable in determining stone composition not only for mixed but also for pure stones.
Most previous in-vivo studies correlating HU and HUD to stone composition proved that calcium stones can be distinguished from UA stones (Table 3). 12 –16 Recently, Patel and his colleagues 16 showed that NCCT HU can also be used to predict calcium stone subtype composition. CaPh stones (brushite and apatite) consistently had higher HU values than calcium oxalate dihydrate calculus. Conversely, they could not distinguish these stone compositions from CaOMH stones. Our attempt to find a correlation between the percentage of struvite component and stone density was unsuccessful. The only significant positive correlation we found was for CaOx composition and HUD (R=0.329; p=0.029). CaOx stones are known to have higher density than struvite stones. 12 –16 Therefore, our results are in concordance to others and we may also deduce that the higher the percentage of CaOx within a struvite stone, the higher HUD it will have on NCCT.
To our knowledge this is the largest in-vivo analysis of stone density in the setting of struvite stones, and the first to evaluate a spectrum of pure and mixed stones in an attempt to correlate the percentage of struvite component within a stone to HU and HUD. Our overall HU absolute value was 820±357 and is in agreement with previously reported figures. 6,9,11,15 Mostavi et al 9 analyzed 10 struvite stones in vitro and found a mean HU of 666±87. In another in-vitro series, Deveci et al 6 found mean density of 613 (510–681) HU for 9 pure struvite stones and 697 (547–888) HU for 11 mixed struvite stones. El-Assmy et al 11 found a mean density of 873 (727–980) HU for 6 pure struvite stones and 802 (205–1426) HU for 23 mixed struvite stones in vitro. Demirel and Suma 15 analyzed 19 pure struvite stones in vivo and had mean HU of 614±121. Motley et al 13 considered all their struvite stones as “pure” irrespective of its percentage and found a mean HU of 401±198. They were the first to use attenuation-to-size ratio and found HUD for struvite stones to be 53±25. Our overall HUD was similar: 67.5±54.9. We found no difference regarding HU but a statistically significantly lower HUD for pure stones. A low HUD may increase the suspicion for a pure struvite calculus. Nevertheless, the overlap seen for both parameters among groups prevents the ability to establish strict cutoffs for the identification of a pure struvite stone based only on NCCT parameters.
In this study our primary objective was to determine the HU characteristics of struvite stones. As such, we specifically selected patients with known struvite stones to determine these thresholds. This selection bias, however, prevents us from an accurate evaluation of the accuracy (sensitivity and specificity) of the HU values in clinical practice; this would be best studied in an unselected larger patient sample where struvite stones compose a small percentage of evaluated calculi.
Conclusions
NCCT HU and HUD cannot be used to predict the amount of struvite stone within a calculus. Pure struvite stones have significantly lower HUD than mixed struvite stones, but overlap exists. A low HUD may increase the suspicion for a pure struvite calculus. HUD positively correlates with and may help predicting the amount of CaOx component within a struvite stone.
Footnotes
Disclosure Statement
No competing financial interests exist.