
Abstract
Introduction:
Endoscopic treatment of renal calculi relies on surgeon assessment of residual stone fragment size for either basket removal or for the passage of fragments postoperatively. We therefore sought to determine the accuracy of endoscopic assessment of renal calculi size.
Materials and Methods:
Between January and May 2013, five board-certified endourologists participated in an ex vivo artificial endoscopic simulation. A total of 10 stones (pebbles) were measured (mm) by nonparticipating urologist (N.D.P.) with electronic calibers and placed into separate labeled opaque test tubes to prevent visualization of the stones through the side of the tube. Endourologists were blinded to the actual size of the stones. A flexible digital ureteroscope with a 200-μm core sized laser fiber in the working channel as a size reference was placed through the ureteroscope into the test tube to estimate the stone size (mm). Accuracy was determined by obtaining the correlation coefficient (r) and constructing an Altman–Bland plot.
Results:
Endourologists tended to overestimate actual stone size by a margin of 0.05 mm. The Pearson correlation coefficient was r=0.924, with a p-value<0.01. The estimation of small stones (<4 mm) had a greater accuracy than large stones (≥4 mm), r=0.911 vs r=0.666. Altman–bland plot analysis suggests that surgeons are able to accurately estimate stone size within a range of −1.8 to +1.9 mm.
Conclusions:
This ex vivo simulation study demonstrates that endoscopic assessment is reliable when assessing stone size. On average, there was a slight tendency to overestimate stone size by 0.05 mm. Most endourologists could visually estimate stone size within 2 mm of the actual size. These findings could be generalized to state that endourologists are accurately able to intraoperatively assess residual stone fragment size to guide decision making.
Introduction
W
Materials and Methods
The study was organized as an artificial ex vivo experiment. Ten nonbiologic stones (pebbles) of various sizes <10 mm, from the ground, were collected to prevent degradation upon transport. Stones were selected on the basis of uniformity in shape and resemblance to biologic calculi by the urologist NP. Each stone was individually measured for largest diameter in mm with microscopic electronic calipers (Neiko®) with an accuracy of ≤100 μm by a single urologist NP who did not participate in the accuracy portion of the study. The range of stone size was 1 mm to 8 mm, with a 2 mm and a 3 mm stone represented twice each. To mimic a calculus within a renal calyx, each stone was placed into separate labeled nontransparent test tubes to prevent gross visualization of the stones through the side of the tube. Between January and May 2013, Five board-certified endourologists (B.C., R.S., B.K., M.L., and R.P.) who had dedicated their practice to a large volume of kidney stone surgery at tertiary centers, were recruited to independently assess the stone size in each tube (Fig. 1). The participants were not made aware of the range of stone size nor the number of stones with different sizes. The Olympus (Olympus Surgical®, Shinjuku) flexible digital ureteroscope (URF-V) with a 200-μm core sized laser fiber in the working channel as a size reference was placed within the test tube and each stone's size was estimated in mm and recorded. A time allotment of 10 seconds was given to each endourologist for each stone assessment. Urologists were explicitly instructed not to remove the stones from the test tube or to view them grossly and to use only the endoscope for visualization.
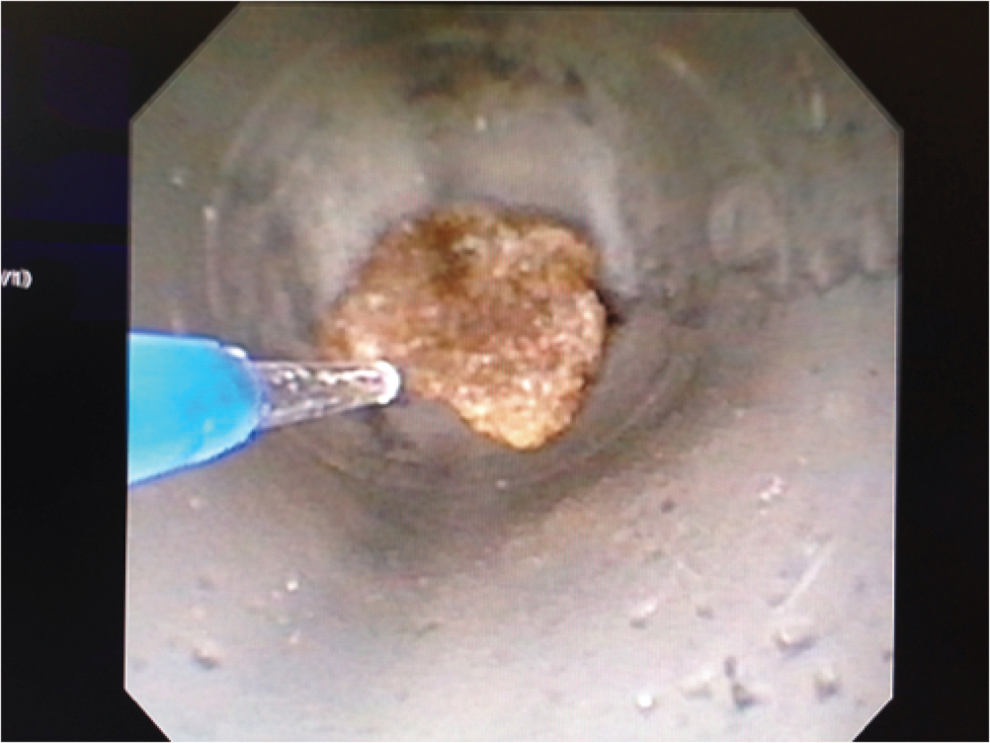
Endourologist assessment of stone size within test tube using a 200-μm core sized laser fiber as reference.
Statistical analysis for the accuracy of the stone estimations was performed using the correlation test for a correlation coefficient (r) and constructing an Altman–Bland plot. A scatter diagram was constructed by plotting the actual stone size against the mean of estimated stone sizes. This Altman–Bland plot assesses the agreement between two methods of clinical measurement by plotting the difference of visual assessment and actual size relative to the mean of both measured sizes. 8 For example, in reference to the 3 mm stone, the x-axis plots the [estimated mean size (2.8 mm)+actual size (3 mm)]/2=2.9 mm and the y-axis plots the estimated mean size (2.8 mm) − actual size (3 mm)=−0.2 mm. The standard deviation of the difference measures the agreement between the actual stone size and visually assessed size. Precision with 95% confidence limits of agreement were calculated and give a range of measurements that cover the agreement between visually assessed size and actual stone size for 95% of the samples.
Results
A total of 10 stones were collected and measured with microscopic calipers. The five endourologists' visual estimates are presented in Table 1 along with the mean assessed stone size. The 1 mm stone was not recorded in one instance by endourologist #4 due to loss in transport. Figure 2 demonstrates a scatter diagram with a trend line for actual measured stone size vs mean of estimated size. The Pearson correlation coefficient (r) was 0.923, with a p-value <0.01.
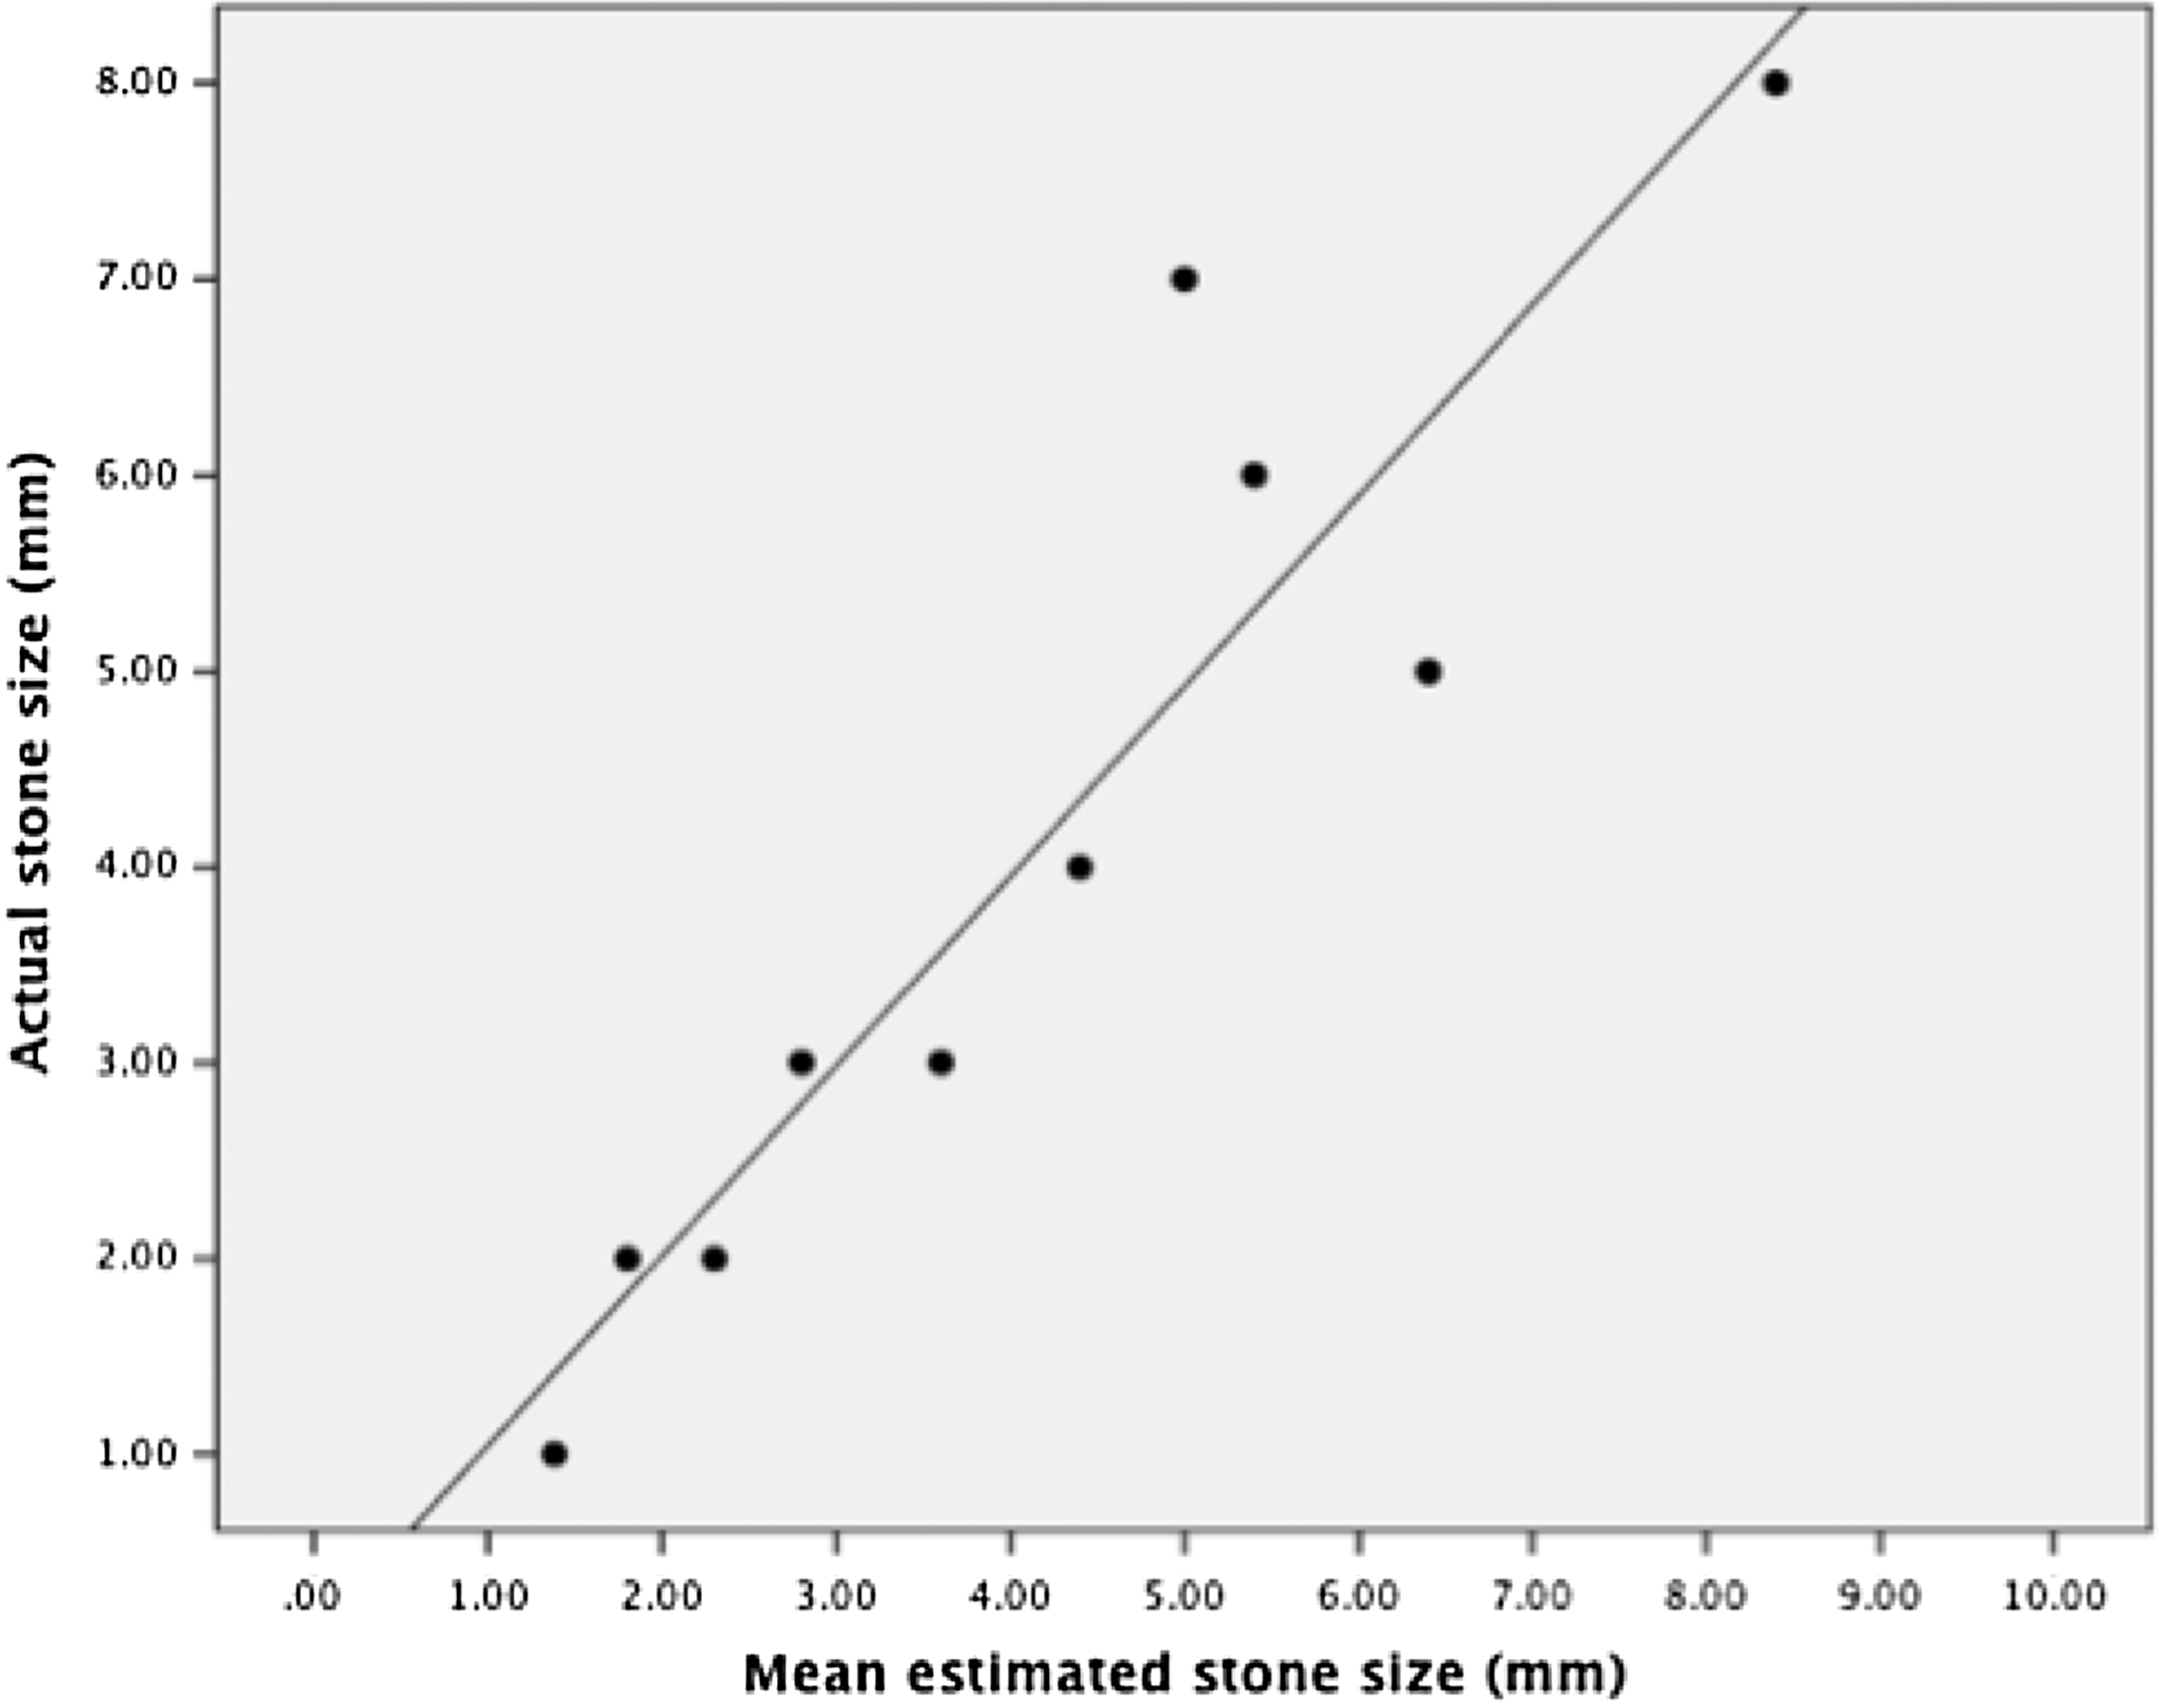
Scatter diagram with trend line plotting actual stone size vs mean estimated stone size, Pearson correlation coefficient, r=0.923, p<0.01.
NR=Not recorded due to loss in transport.
The Altman–Bland plot (Fig. 3) shows that the mean difference between estimated and actual stone size was +0.05 mm. The standard deviation of the difference was 0.9 mm, which measures the agreement between actual size and visually assessed size. The 95% limits of agreement reveal that visually assessed stone sizes are within a range of −1.8 to 1.9 mm of the actual size.
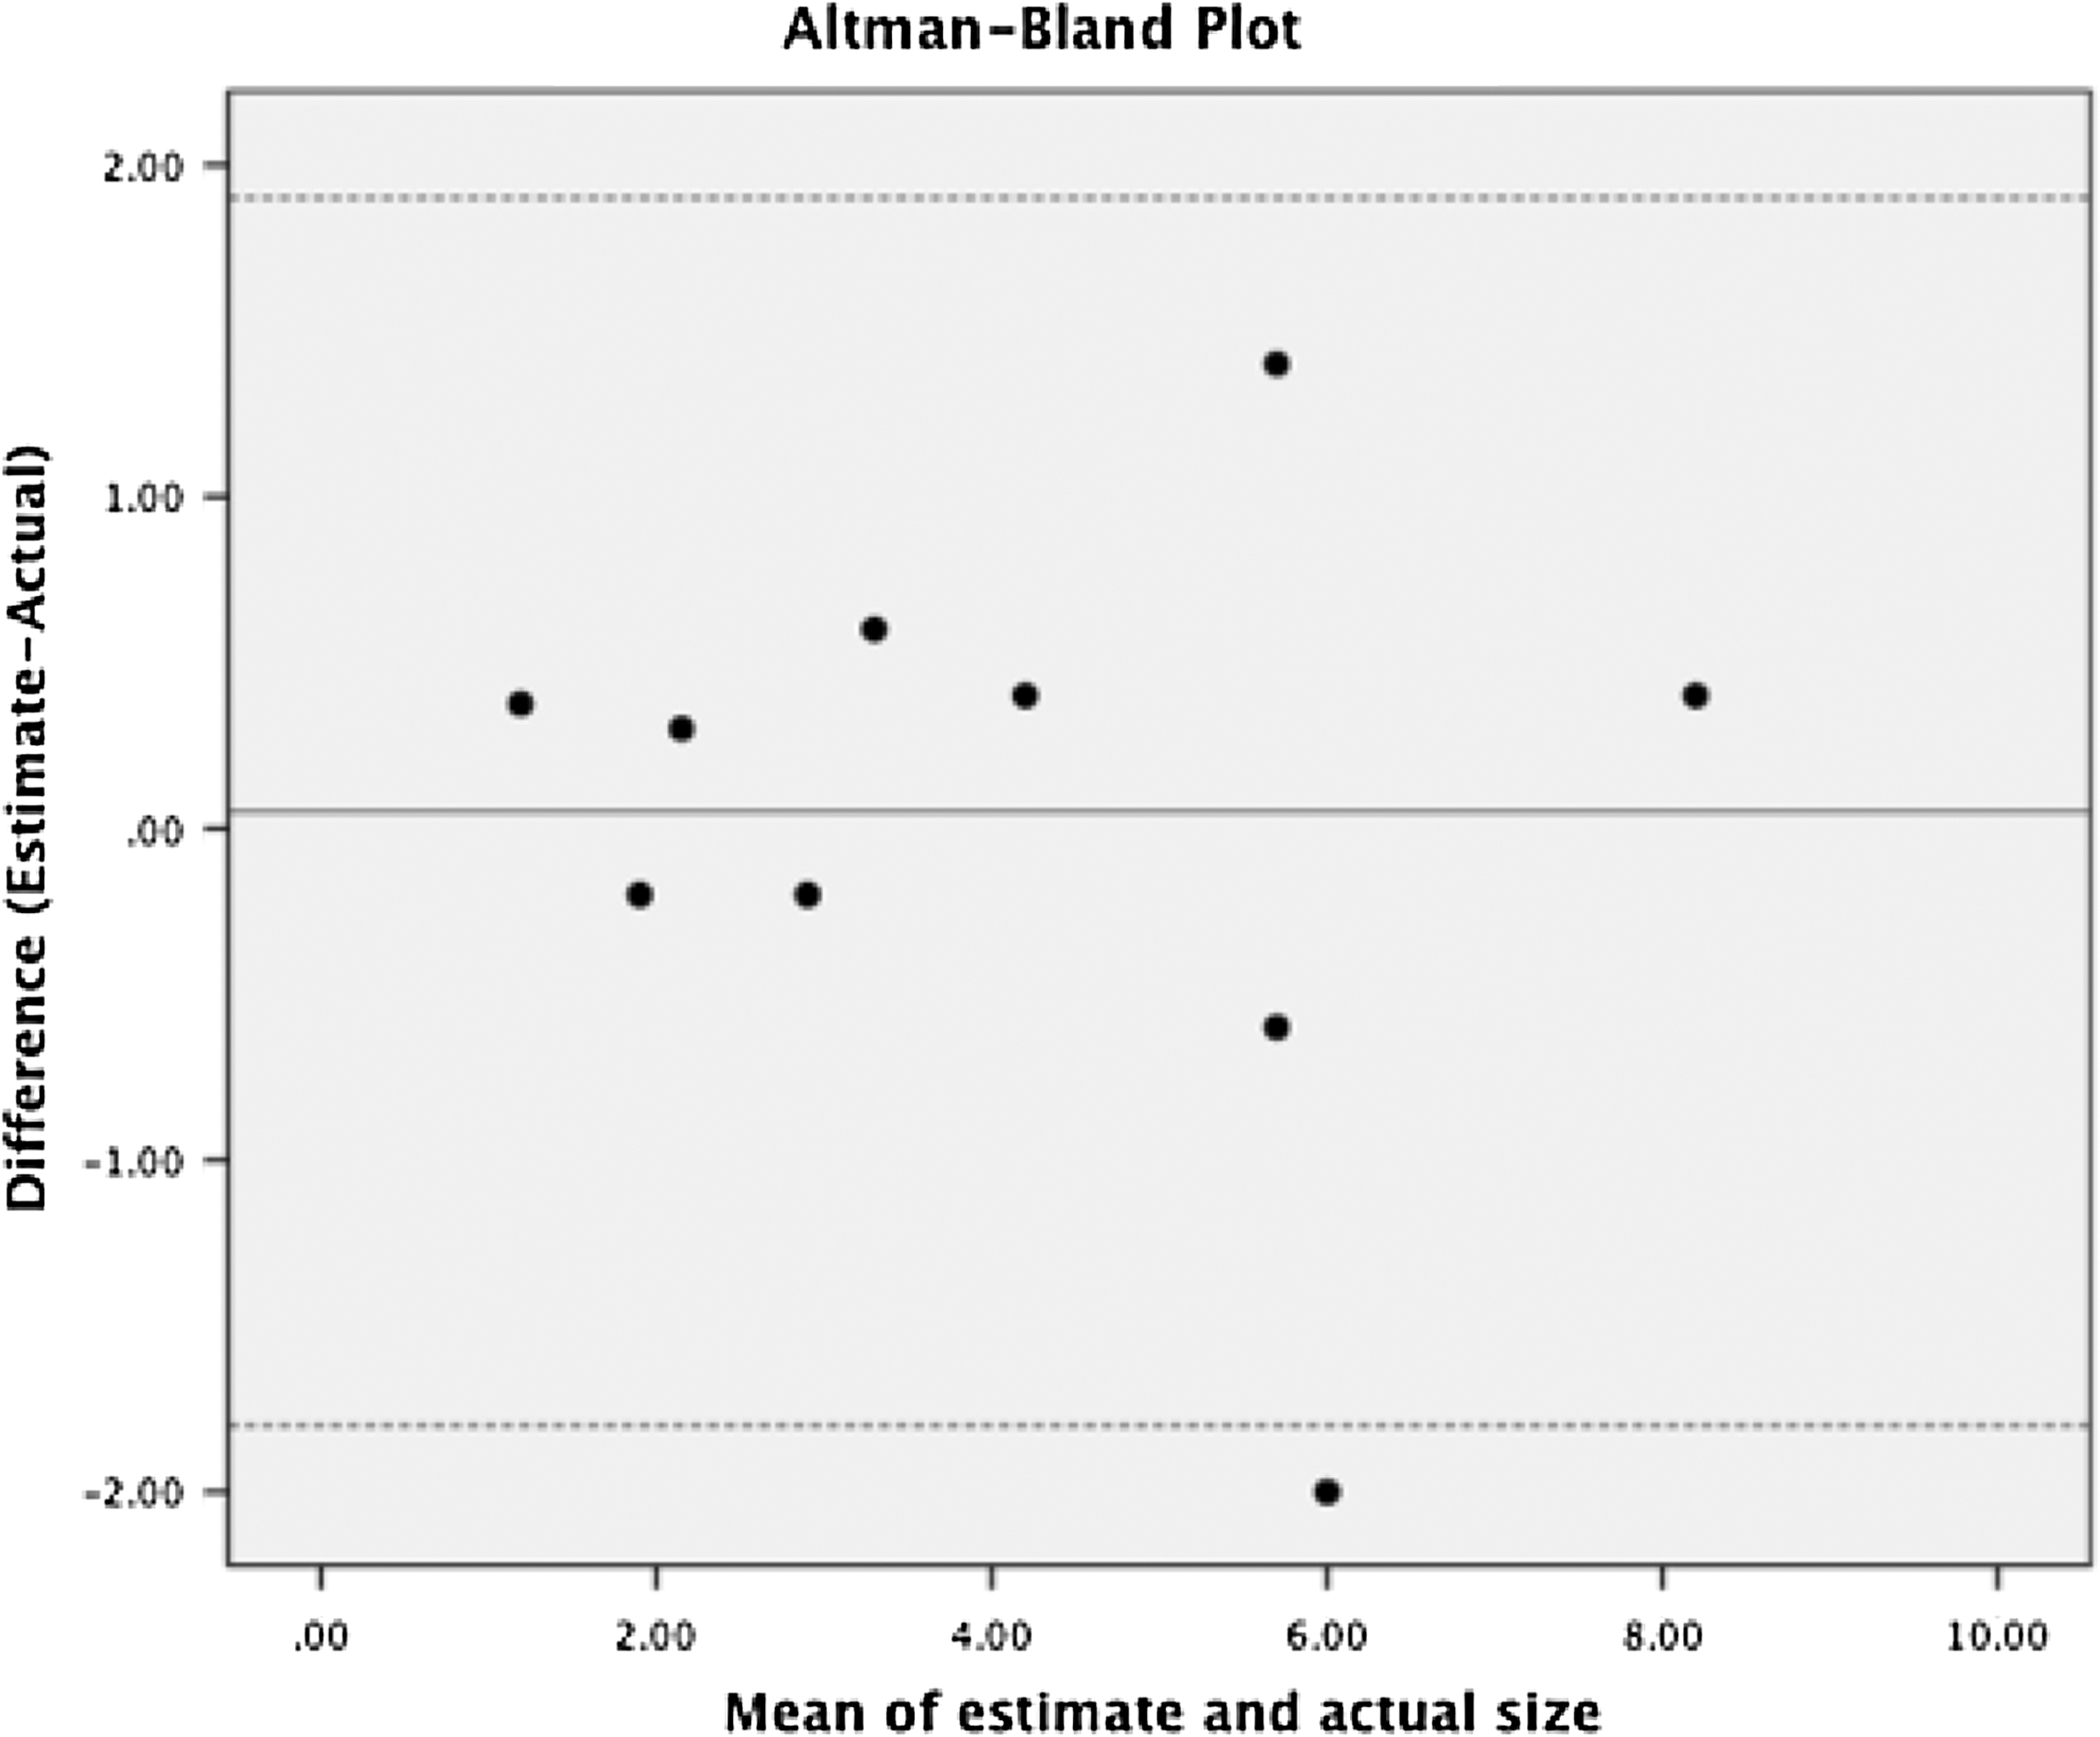
Altman–Bland plot demonstrating mean difference, +0.05 mm, in estimated stone size (solid line) with upper, +1.9 mm, and lower, −1.8 mm, 95% limits of agreement (dashed lines).
Five stones were <4 mm and five were ≥4 mm. Using this cutoff, the smaller stones (<4 mm) were overestimated by a mean of 0.18 mm with r=0.911, p-value=0.031. The larger stones (≥4 mm) were underestimated by a mean 0.08 mm with r=0.666, p=0.219.
Discussion
Accurate estimation of residual fragment size following ureteroscopic lithotripsy is essential for the urologists to determine whether these fragments are likely to pass spontaneously or require further lithotripsy or active retrieval. To our knowledge, this is the first study to investigate the accuracy of the surgeon's endoscopic visual assessment of calculi size. The term “clinically insignificant residual fragment” (CIRF) has recently been challenged. Osman et al., demonstrated that RF>3 mm as measured by noncontrast CT was associated with RF growth or ureteral obstruction following percutaneous nephrolithotomy (PNL). 9 Raman et al., recommended a residual fragment threshold of 2 mm to guide second-look nephroscopy following PNL. 10 Following ureteroscopy, Rebuck et al., observed a 19.6% risk of a stone event within 1.6 years for residuals fragments ≤4 mm as measured by CT, prompting their recommendation to “remove all fragments in safe and timely manner at time of ureteroscopy” if possible. 11
In majority of studies, CT imaging is employed to demonstrate the presence and size of residual fragments. However, CT imaging may not accurately predict actual stone size. Although their study only included distal ureteral calculi, Kishore et al., indicated that CT scan imaging is a poor predictor of actual calculi size with a correlation coefficient −0.022 and wide range of accuracy −4.6 to 6.6 mm. 12 We demonstrate that visual assessment has a high correlation coefficient to actual stone size r=0.923. Further, Altman–Bland analysis reveals a smaller range of accuracy of −1.8 to +1.9 mm when visually assessing stone size. Therefore, this study provides preliminary evidence that visual assessment of stone size can guide decision making for either allowing spontaneous passages or active extraction.
This study reveals that visual estimation of small stones (<4 mm) has higher accuracy than estimation of large stones (≥4 mm), r=0.911 vs r=0.666. This conclusion is significant because a greater estimation accuracy of small stones is needed to guide the endourologist to either basketing or allowing spontaneous passage, whereas the discrepancy of large stones size would be of less significance, since they would ultimately require additional fragmentation.
The strengths of this study are that endourologists were blinded to actual stone size, and the study design did not allow them to assess stone size through any other method than endoscopic evaluation. This provides a realistic model for stone size evaluation and mimics the intraoperative setting.
The limitations of this study are its small sample size, the use of nonbiologic calculi substitutes, and the polling of endourologists. The sample size of five endourologists was chosen to simplify the experiment. Even with the small sample size in this study, one stone was lost in the mailing process. It is arguable that nonbiologic stones are not valid substitutes for true kidney stones but they were grossly very similar in appearance. A study in which ureteroscopic estimation of biologic calculi size in situ compared to pathologic report would be more realistic. We, however, chose nonbiologic stones since transferring patient biological tissue has inherent confidentiality and consenting issues that would have complicated the simplicity of this study. We chose to use endourologists at tertiary referral centers as we felt they would be best at estimating stone size given their high stone volume experience. While most urologists today have significant endoscopic experience, the additional experience endourologists have with endoscopic cases may limit the generalizability of this study. If the study were to include nonfellowship trained endourologists or trainees, the stone size estimation accuracy is likely to decrease.
As a reference, all participants used a 200-μm core sized laser fiber to estimate stone size. As some centers opt to use 365-μm core size fibers, the visual assessment accuracy may increase, since the increased fiber size would provide a larger reference point. However, we chose to use the smaller fiber size with the flexible ureteroscope, since in a clinical setting the smaller fibers afford greater scope deflection, increased irrigation flow, and decreased wear and tear of the endoscope.
Another important consideration is that the Olympus URF-V digital ureteroscope was used in all cases. Different endoscopes may have different field of views and it is possible that the accuracy of estimating stone size could differ when different ureteroscopes are used. Specifically, the use of a conventional fiberoptic ureteroscope results in a 30% decrease in visibility compared to digital ureteroscopes and may subsequently decrease stone size estimation accuracy. 13 However, we felt it important to limit variables and have all participants use the same model of digital ureteroscope. Future studies could evaluate different ureteroscopes or camera systems.
Conclusion
Endourologists in this study were able to accurately assess renal stone size, which suggests that they have valid intraoperative decision-making capability to choose between spontaneous passage and active retrieval of stone fragments.
Footnotes
Disclosure Statement
No competing financial interests exist.