
Abstract
Objective:
To determine if the application of using standard tools on tumor complexity and comorbidity indexes may replace the traditional choice of nephron-sparing procedure (NSP) based on clinical maximal tumor diameter (cMTD), age, and comorbidity.
Patients and Methods:
Anatomic complexity scores (PADUA and RENAL) and Charlson comorbidity index (CCI) and CCI age-adjusted (CACI) were applied to 261 cases of either nephron-sparing surgery (NSS) or cryoablation (CA). Patient- and tumor-related preoperative variables, PADUA, RENAL, CCI, and CACI, were evaluated for their association and as treatment predictors in uni- and multivariate regression analysis. Discriminative ability of each of the models generated was compared for their receiver operating curve area under the curve (AUC). Survival analysis was performed using log rank tests.
Results:
In total, 124 cases underwent partial nephrectomy and 137 cases CA. cMTD, RENAL, PADUA, age, and CACI were independently associated with the choice of NSS. Five models integrating a combination of age, cMTD, CACI, PADUA, and RENAL (scores and complexity groups) showed an AUC >0.72 to predict the odds of receiving NSS. The discriminative ability of these five models was not statistically significantly different.
Conclusions:
cMTD, RENAL, PADUA, age, and CACI are preoperative variables independently associated with the choice of NSP. Models incorporating tools on tumor anatomic complexity and CACI may replace the decision-making in the type of NSP based on cMTD and age. The use of these models can be of value for future standardization and comparison.
Introduction
N
Because of its recent incorporation, tumor complexity scores have been mostly applied retrospectively and strong recommendations on which comorbidity classifications should be used are still lacking. Waiting for contemporary series incorporating prospectively these standard tools, it seems logical to test their influence in the choice of NSP.
The objective of the present work is to assess the application of standard measures in the decision-making process between two different NSP options in the treatment of renal masses (cryoablation [CA] and NSS).
Patients and Methods
Data source
Consecutive patients who underwent NSS or CA from September 2003 to December 2013 were selected from our renal mass database. For this retrospective study, the institutional review board was waived due to the anonymization of the database. Charlson comorbidity index (CCI), CCI age-adjusted (CACI), PADUA score, and RENAL nephrometry were assigned retrospectively until December 2009 and prospectively afterwards. Patients with distant metastasis were excluded from the study. Cases with previous history of renal-cell carcinoma (RCC) and those with de novo tumors in the contralateral kidney during the study period were included.
The selection of the NSP was taken during the oncologic multidisciplinary meeting. Indication was based on clinical maximal tumor diameter (cMTD) on contrast enhanced computed tomography (CECT) or MRI, with a limit of 4 cm for ablation, and on patient's age (no definite limit) and comorbidity. Comorbidity was qualitatively assessed without applying any metric tool. NSS and laparoscopic CA were performed by dedicated urologic surgeons and percutaneous CT-guided CA by interventional radiologists and urologists. The three procedures were performed according to the standard department protocols.
For analysis, patients were divided into the following two groups: NSS (including PN, enucleation, and enucleoresection) and CA. Baseline patient characteristics and oncologic characteristics between the two groups were compared. Comorbidity was scored according to CCI and CACI using an electronic application
10
(
Statistical measurements
Chi-square and t tests were used to compare the two groups for categoric and continuous variables, respectively. When necessary, the nonparametric equivalent was also used.
Univariate logistic regression analysis was performed to determine the association between selected baseline variables and the treatment type (NSS and CA). Variables included were age at intervention, gender, body mass index (BMI), American Society of Anesthesiologist (ASA) score, CCI and CACI, cMTD, PADUA and RENAL score, and groups. To stratify patients in two comorbid groups, the Charlson score was divided into two categories by a cutoff value of 2 (CCI groups: group 1 [Charlson 0 and 1] and group 2 [Charlson ≥2]). 10 Morphometric scores were divided according to the original categories: low (RENAL 4–6, PADUA 6–7), moderate (RENAL 7–9, PADUA 8–9), or high complexity (RENAL ≥10, PADUA ≥10). 8,9 The most frequent category was chosen as reference for the analysis.
Various multivariate models based on univariate significant, but not correlated, variables were fitted to predict the choice of treatment. Receiver operating curves (ROCs) and concordance statistic (c) were used to compare the discriminative abilities of the models. The concordance statistic (c) also represents the area under the curve (AUC).
DeLong's test for ROCs was used to compare the different models for possible significant differences. Bootstrapping (internal validation) was performed 500 times for each of the various multivariate models to correct for overoptimism. A shrinkage factor (slope) was obtained to correct the regression coefficients. Furthermore, the c-index was adjusted. 12,13
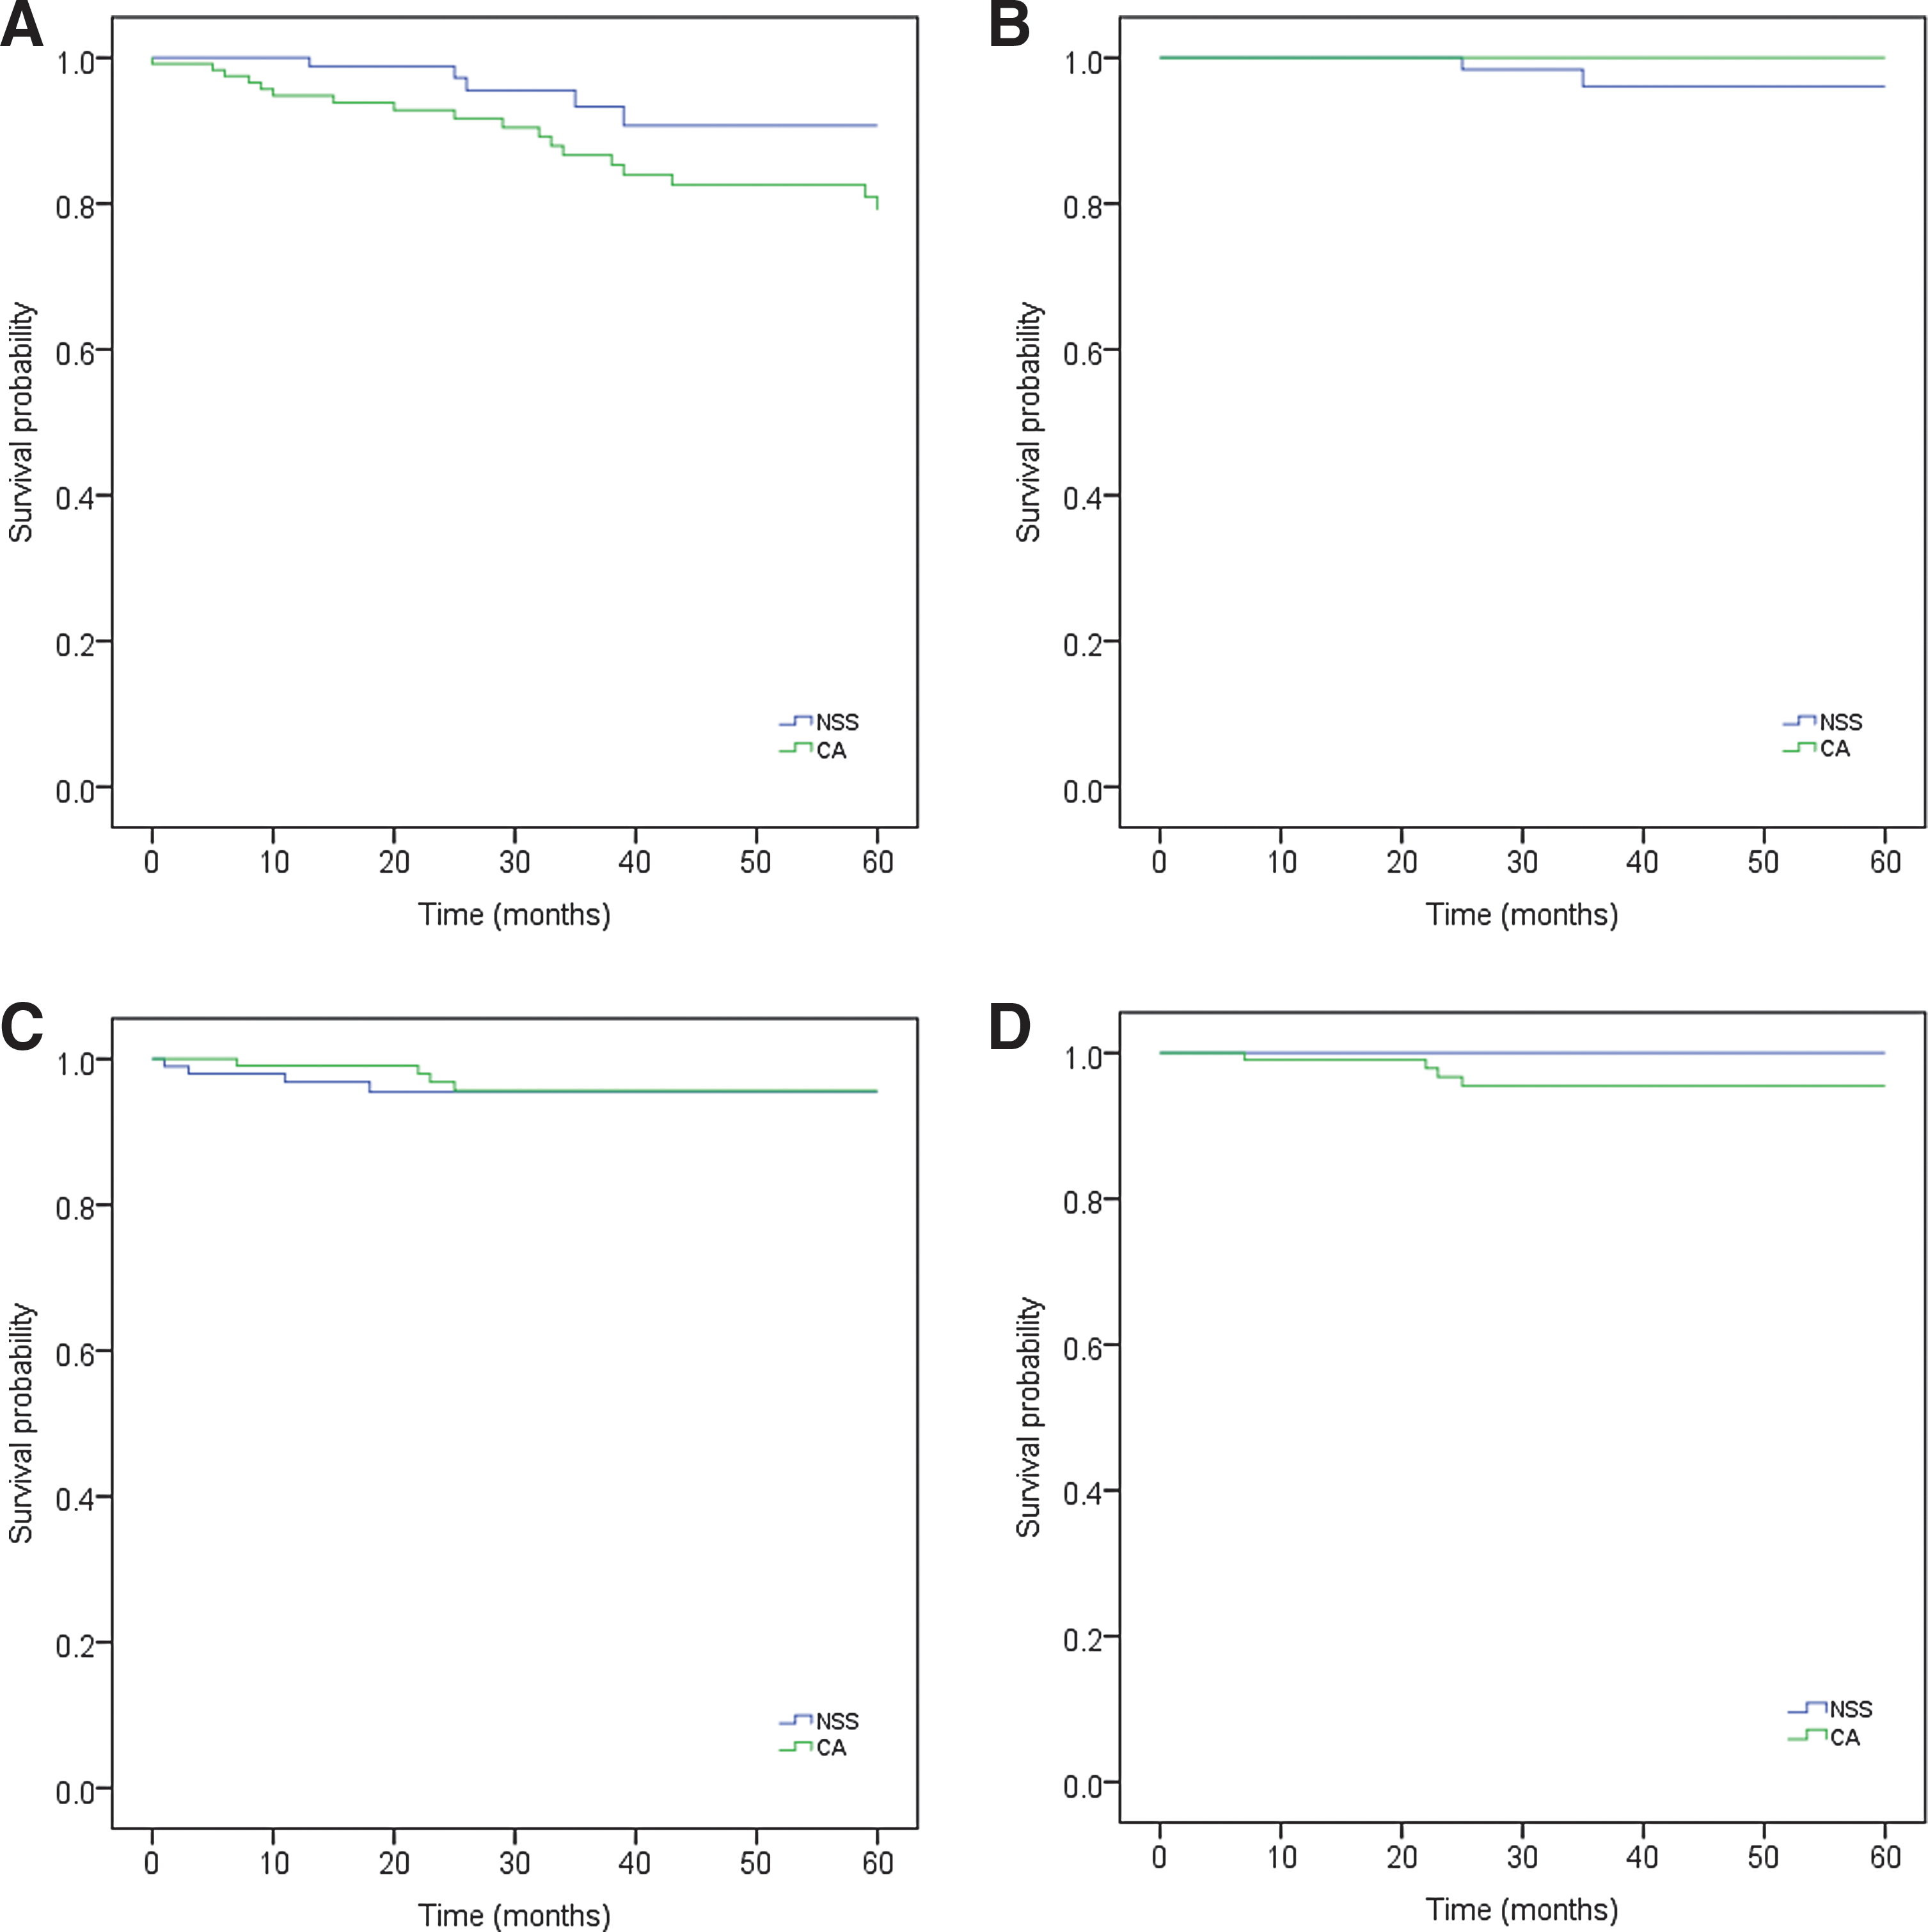
Finally, survival analysis was performed in cases with proven RCC to compare between patients who underwent NSS or CA with the sole objective to support the adequacy of the treatment choice. To avoid survival bias and allow a straightforward interpretation of results, this analysis was done on a subsample of patients with no previous history of familiar or synchronous/metachronous RCC. Kaplan–Meier curves were made for CSS, DFS, OS, and RFS, and the Log-rank test was used to compare their distribution between the two groups.
All statistical analyses were performed using R-statistical programming software version 3.0.2, and the level of statistical significance was set at 0.05.
Results
During the study period, 251 patients underwent a NSP (261 tumors). In total, 124 cases underwent NSS (81 cases open and 43 cases laparoscopic) and 137 cases underwent CA (121 cases laparoscopic and 16 cases percutaneous). Table 1 shows baseline patient and tumor characteristics. Mean (standard deviation [SD]) and median follow-up time was 44 (28.8) and 43 (0–108) months, respectively, for patients who underwent CA. For patients who underwent NSS, the mean (SD) and median follow-up time was 33 (29.9) and 25 (0–125) months. A significant difference was seen between the two groups for age, ASA score, solitary kidney, CCI (median), CACI, CCI groups, cMTD, cTNM stage, PADUA and RENAL scores, and PADUA and RENAL complexity groups. In the NSS group, 21 (16.9%) masses were benign. In the CA group, 22 (16.1%) showed benign tumor pathology following biopsy, while 32 (23.4%) were nondiagnostic, and in 4 initial cases, biopsy was not performed (2.9%).
ASA = American Society of Anesthesiologist; BMI = body mass index; CA = cryoablation; CACI = CCI age-adjusted; CCI = Charlson comorbidity index; CCI groups: group 1 = CCI 0, 1, group 2 = CCI ≥2; cMTD = clinical maximal tumor diameter; cTNM = clinical TNM staging of renal-cell carcinoma; NA = not applicable; NSS = nephron-sparing surgery; pTNM = pathological TNM staging of renal-cell carcinoma; RCC = renal-cell carcinoma; SD = standard deviation.
Univariate regression analysis showed age (p < 0.001), ASA score (p = 0.027), CACI (p < 0.001), CCI groups (p = 0.04), cMTD (p < 0.001), PADUA (p < 0.001) and RENAL scores (p = 0.001), and PADUA (p < 0.001) and RENAL (p = 0.001) high-complexity groups to be predictors of the type of NSP choice (data not shown).
Different multivariate models were constructed avoiding variables that were correlated or included within the scoring systems, for example, cMTD and anatomic scores or age and CACI (Table 2). CCI was nonsignificant when included in models 4 and 7 (p 0.532 and 0.509, respectively), likely overpowered by age and thus was not included in the final models to avoid confounding. Multivariate regression analysis demonstrated the odds of undergoing NSS vs CA for the different models (Table 2).
AUC, area under the curve; b = Bootstrap corrected; c = concordance statistic (AUC); CCI groups: group 1 = CCI 0 or 1, group 2 = CCI ≥2; CI = confidence interval; OR = odds ratio of receiving NSS; p = p-value; slope = shrinkage factor.
Only significant variables are included.
Model 1 with our two primary variables of age and cMTD exhibited the highest discriminative ability (AUC = 0.79), showing that for each cm increase in cMTD there was a 2.11 higher odds of receiving NSS. Conversely, per each year of increase in age, the odds decreased 0.92-fold. Four models incorporating standardized measures of tumor complexity or comorbidity or both showed similar and nonstatistically different discriminative ability from model 1. Model 8, incorporating the quantitative assessment of comorbidity weighted by age, had an AUC of 0.75 with similar increasing cMTD odds of receiving NSS and a more realistic odds decrease for each point increase of CACI (0.69). The discriminative ability of models 4, 7, and 9 incorporating anatomic scores was 0.73 and nonstatistically significantly different from models 1 and 8. Figure 1 depicts the discriminative ability of those models with the best cutoff combination on treatment prediction with AUC >0.72 (models 1, 4, 7, 8, and 9). The calibration slope for these models (shrinkage factor) ranged from 0.95 to 0.99, indicating a little overoptimism.
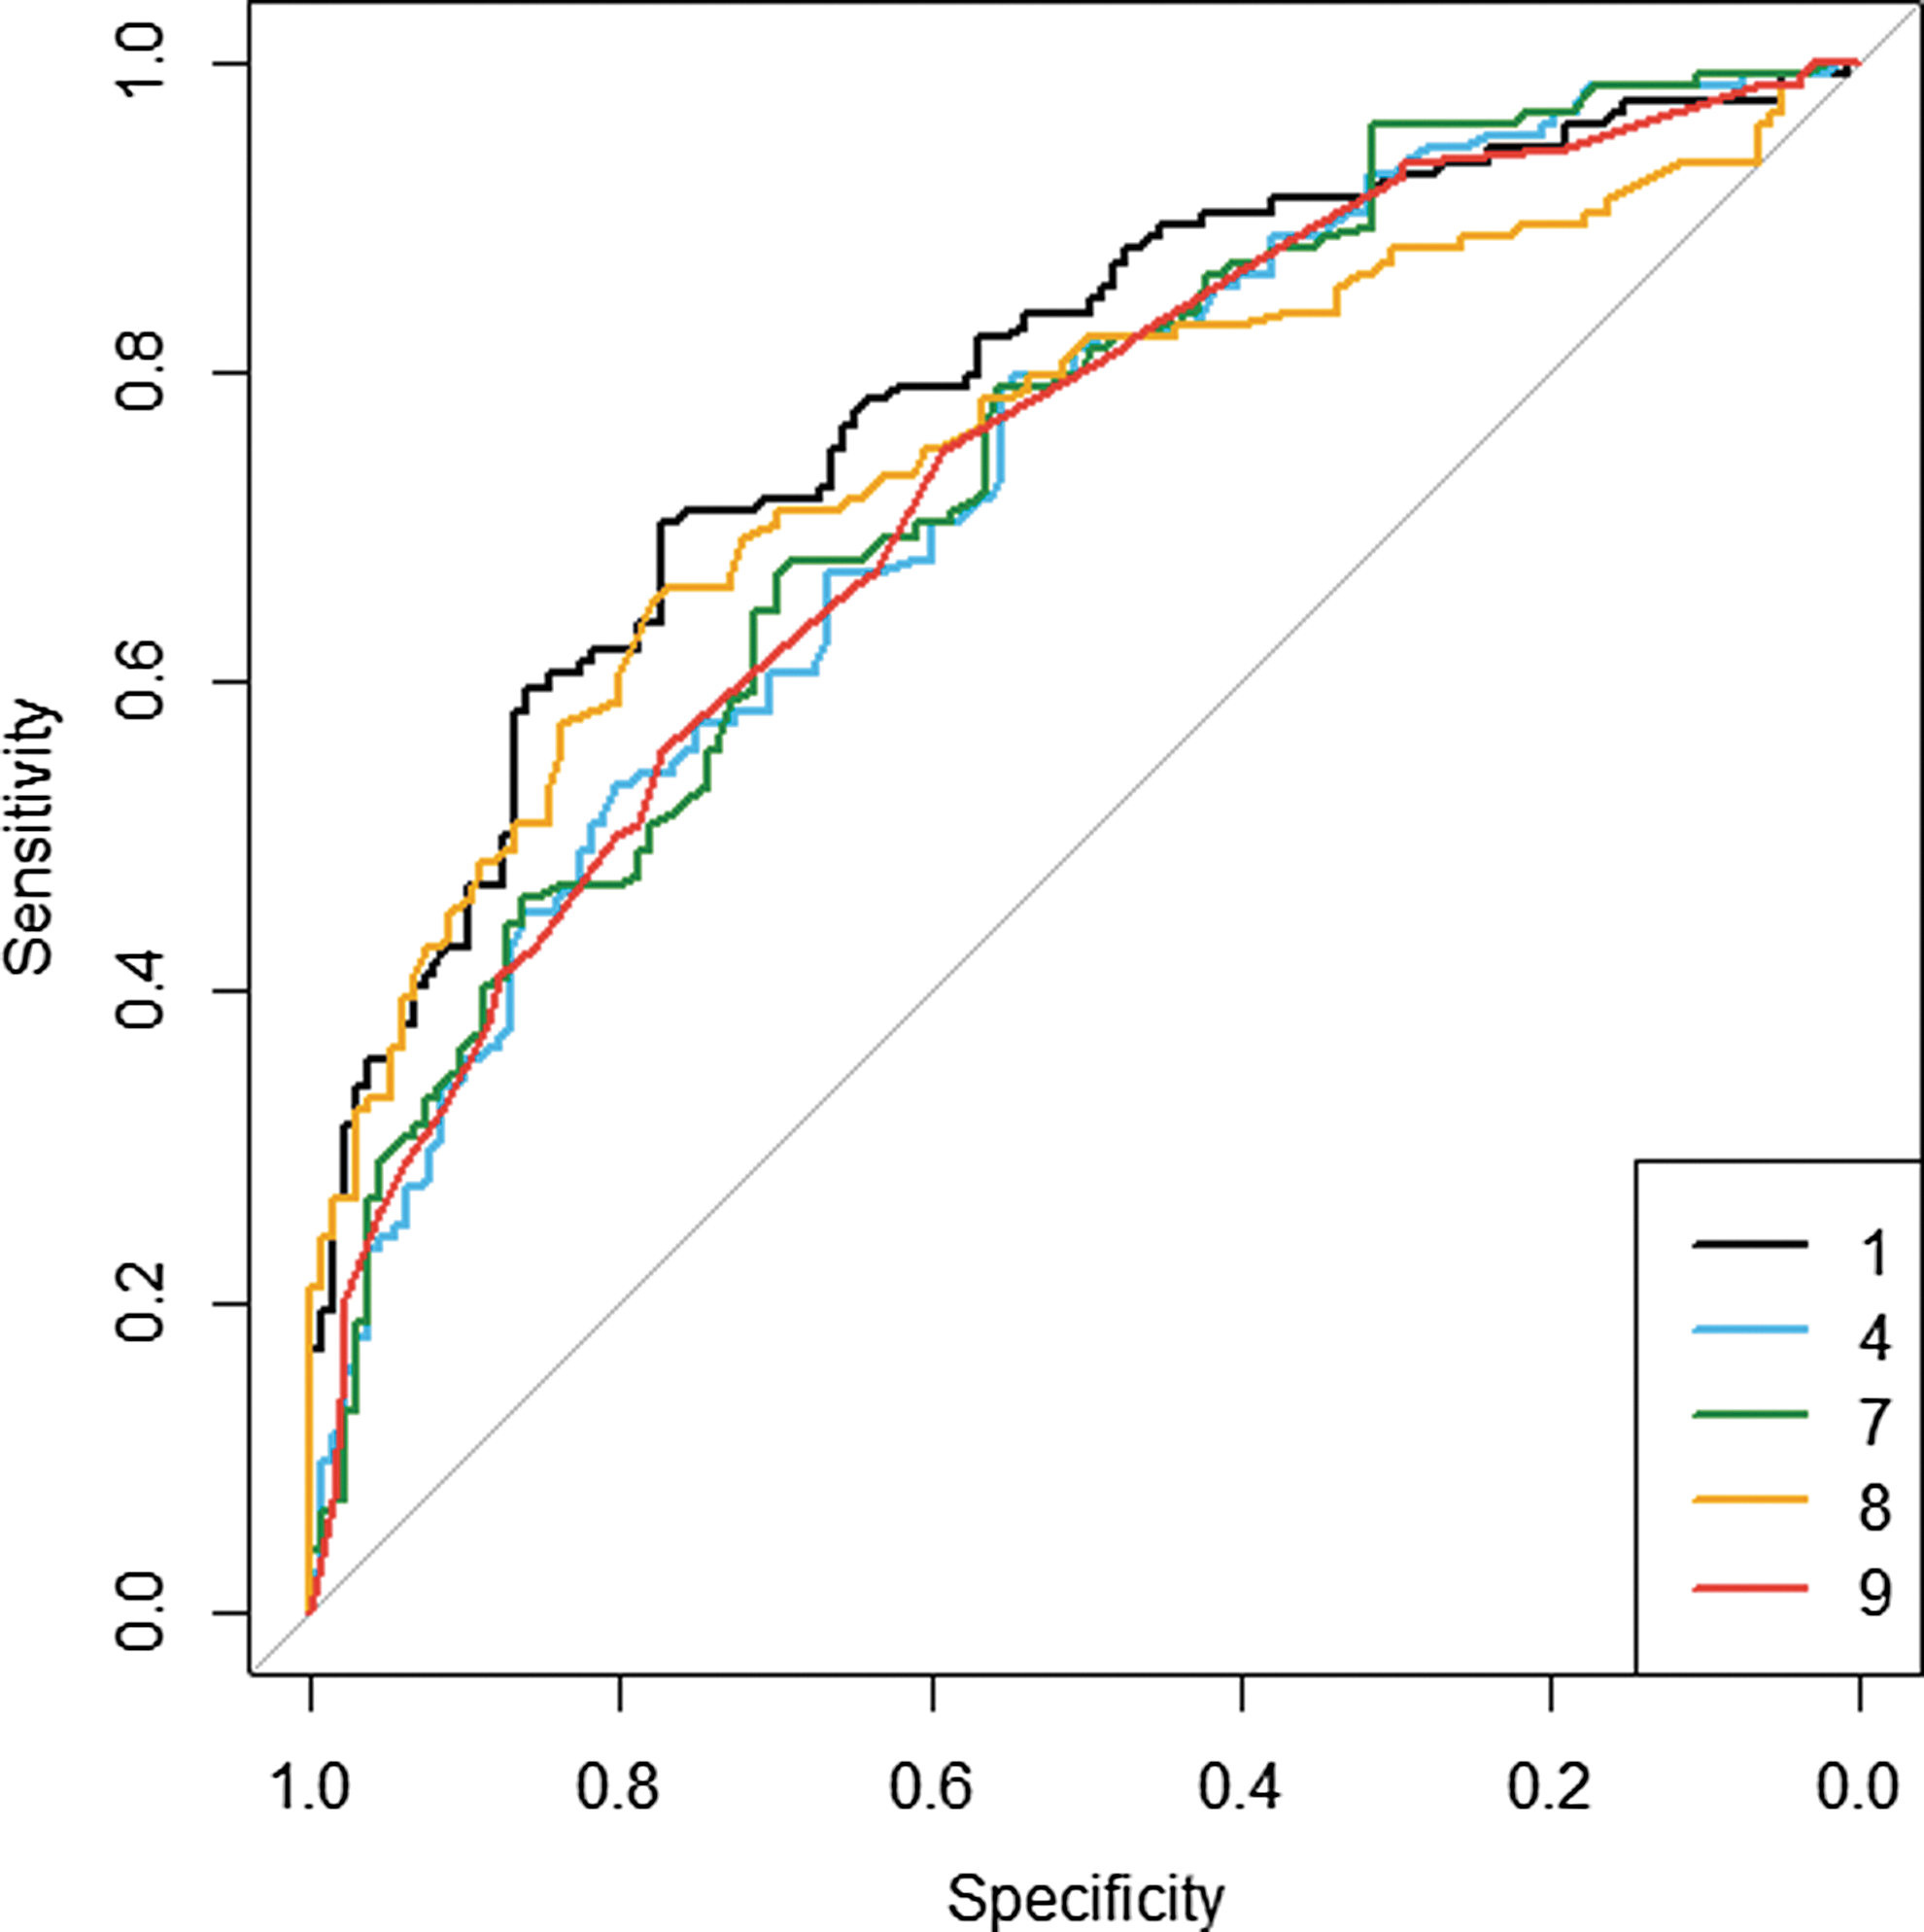
Comparison of the performance and discrimination of different models using receiver operating curve (ROC). Only models with area under the curve (AUC) >0.72 are depicted (not bootstrap corrected). Model 1 includes clinical maximal tumor diameter (cMTD) and age; Model 4 includes RENAL score, age; Model 7 includes PADUA score, age; Model 8 includes cMTD and CACI; Model 9 includes PADUA groups and CACI.
The predictive ability of models 3, 5, and 6 was statistically significantly lower (p = 0.001, p = 0.038, p = 0.001) compared to model 1.
The 5-year OS probability for both NSS and CA groups was not significantly different (91% for NSS and 79% for CA, p = 0.058) (Fig. 2). The 5-year CSS, DFS, and RFS were not significantly different between the two groups (Fig. 2).
Discussion
In our cohort, multivariate regression models show that incorporation of standard tools such as PADUA and RENAL anatomic characterization and CACI could predict the type of NSP with similar accuracy as a simplistic model based on age and cMTD. Especially a model combining cMTD and age-adjusted comorbidity offers more realistic odds of receiving NSS over CA than when age is used as a variable.
Despite the abundant literature on the subject, the choice between ablation and NSS is still ill defined, but for tumor size limits, and subject to multiple influences such as physician and patient preferences 14 or to a certain extent of comorbidity subjective assessment. To minimize the influence of surgeon's technical preferences, we chose a time frame when NSS and ablation were available at our center and when indications for one or another NSP were discussed in a structured multidisciplinary manner. CCIs were chosen to standardize comorbidity due to their widespread use and because they have been validated for surgical procedures. 15 Anatomic scores for tumor characterization were chosen based on their functionality, external validations, and reproducibility, all of them justifying its clinical use. 8,16 –23
As expected, patient's and tumor's characteristics treated by NSS or CA differed significantly reflecting our primary selection process. The differences persisted when standard criteria were applied to patient and tumor (anatomic) characteristics. Our data support the current literature, indicating that less complex anatomic tumors and patients with a higher comorbidity load are selected for ablation. 24
Quantitative comorbidity was significantly different only when adjusted for age (CACI) or when CCI was categorically divided. The differences in comorbidity observed between the two treatment groups when standard metrics are applied support our primary qualitative assessment and the known correlation between age and comorbidity. Age and comorbidity scores are strongly correlated with patient mortality rate and, therefore, predictive of nonkidney cancer death. 25 –27 The lack of significant difference in 5-year OS between the two subcohorts supports a choice based on age and cMTD, otherwise fully replicated by a combination of cMTD and CACI and RENAL or PADUA scores combined with age.
Once proven that standard metric tools reproduce the classic selection criteria, the logical step is to test the ability of different models combining standardized classification tools. To answer this question, the significant variables were combined in different predictive models and their performance compared with the model that incorporated the classic selection variables along the study period (model 1).
Age, CACI, tumor size, PADUA and RENAL score, and complexity groups appeared as the most powerful variables in univariate analysis. When creating the different predictive models, it was taken into account to avoid variables that were already part of a scoring system (e.g., cMTD and anatomic scores or age and CACI). When comparing performance and discriminative ability of the different models, models 1, 4, 7, 8, and 9 showed the best cutoff combination on treatment prediction with AUC >0.72 (Fig. 1). These five models that included the most intuitive one (model 1, combining two clean nonstandardized variables as cMTD and age) to a model combining two scores (PADUA groups with CACI) exhibited a similar discriminative ability, showing that our intuitive choice is fully reproducible when applying standard tools with a nonsignificant decrease in accuracy. When incorporating anatomic complexity groups to the models (9 and 10), no differences were found in the NSS predictive odds for lower and intermediate groups. Consequently, the low morphometric complexity group was taken as the reference. In these models, the balance was clearly in favor of NSS for those complex renal masses.
An important question is the subjective appraisal of the comorbidity. Overall crude rates of different comorbid conditions are different between patients treated by NSS or by ablation. 28 Whether they reflect the general condition depends on the degree of severity of the comorbid conditions and this is probably more weighted by means of a score than of a percentage. The reason why CACI had a predictive value by opposition to CCI might be due to the obvious difference in the age of both groups or overlapping scores, however, when groups were assigned, this difference became obvious (Table 1). Comorbidity increases with age, the latter being per se an important predictor of risk of death. Especially when follow-up periods longer than 1 year are expected, the weighted age comorbidity index might reflect better the real situation of a given patient than the CCI. 15
Our study is not devoid of limitations. It can be argued on the size and composition of the cohort. The study period was chosen based on the possibility of choice between both NSP modalities, and the relative abundance of CA in the cohort responds to the fact that we are center of reference for this technology. Although clinical tumor size and age played an important role in our treatment decision-making, the other tumor (e.g., location, exophytic percentage, relationship with collecting system, or hilar component) or patient factors influenced our treatment decision. The lack of 5-year differences in OS and oncologic outcomes in our cohort supports the appropriateness of the treatment choice, although a proxy of 5-year estimation may be insufficient to establish definitive conclusions in terms of survival outcomes in T1 mass. AUCs <0.8 for our primary and standardized models reflect that variations in treatment choice exists without compromise survival outcomes.
Although in our setting the application of a standardized model has proven to be of the same value as cMTD and age, a work remains to determine if the models will be suitable to establish a threshold in tumor complexity and patient comorbidity that could be included in a treatment choice algorithm. This will be better tested in prospective studies, where perioperative outcomes are reliably collected. Finally, we should not generalize assuming that our standardized models fit other practices and settings. Therefore, validation in different centers is recommended.
Conclusions
Standardized models reproduce the intuitive choice of NSP type for localized renal masses. In our setting, the models 4, 7, 8, and 9 using standard tools such as RENAL, PADUA, and CACI are of value for future standardization on the choice between NSS and CA. Although using validated tools might be a consuming task, it overcomes selection biases, provides the basis for comparison, and if positive external validation, they should be used in the decision-making process.
Footnotes
Acknowledgments
The authors thank Iris Maas and Alette Spriensma for the statistical analysis.
Authors' Contributions
Patricia J. Zondervan, M. Pilar Laguna: Protocol/Project development; Patricia J. Zondervan, M. Pilar Laguna: Data collection or management; Iris Maas, Alette Spriensma: Data analysis; Patricia J. Zondervan, M. Pilar Laguna, Jean J.M.C.H. de la Rosette, Otto M. van Delden, Krijn P. van Lienden: Manuscript writing/editing.
Author Disclosure Statement
No competing financial interests exist.