
Abstract
Introduction:
Approximately 5% of angiomyolipomas (AMLs) are classified as “fat poor” due to lack of visually detectable fat on imaging, making them difficult to distinguish from renal cell carcinoma. Recent investigations have proposed CT and MR imaging features suggestive of fat-poor AML (fp-AML). Herein, we determined the frequency of these features in a cohort of fp-AMLs by retrospective review of preoperative imaging.
Methods:
A pathology database query from January 2005 to August 2013 identified 49 renal specimens of AML with available imaging. A retrospective review of all CT and MR images of these 49 cases was conducted. Cases with visually detectable fat on imaging were excluded.
Results:
A total of 26 fp-AMLs were identified. Thirteen lesions had available unenhanced CT images, of which eight (62%) were hyperdense compared to the adjacent renal parenchyma, while five (38%) were isodense. Twenty lesions had enhanced CT images: 14 (70%) and 6 (30%) with homogeneous and heterogeneous enhancement, respectively. Of the nine lesions with enhanced MR sequences, five (56%) were homogeneously enhancing, and four (44%) were heterogeneously enhancing. Eight of nine (89%) lesions had hypointense signal intensity (SI) on T2-weighted MR sequences, while one (11%) had hyperintense SI. None of the eight lesions displayed a decrease in signal on fat-suppressed sequences.
Conclusions:
In this study, we confirmed common imaging features of fp-AML: high attenuation on unenhanced CT sequences, homogeneous enhancement on CT, and hypointensity on T2-weighted MR. When these features are present, a renal mass biopsy may be prudent.
Introduction
R
Improved radiographic identification of fp-AML could reduce surgeries undertaken for suspicion of malignancy. The CT and MR characteristics of fp-AML have been evaluated in several series, although the reliable distinction of these lesions remains elusive. 4 The objective of this investigation was to evaluate the CT and MR characteristics of pathologically proven fp-AMLs, to identify findings that may suggest AML in otherwise ambiguous cases.
Materials and Methods
Patient and pathologic data
After institutional review board approval, a query of the pathology database for AMLs was conducted from January 1, 2005, to August 1, 2013, and these cases were evaluated for available preoperative imaging. Forty-nine patients had pathologically proven AML and available imaging. Patients were excluded who had visually detectable fat on imaging (n = 17) or lesions too small (<3 mm) to evaluate on preoperative CT or MR (n = 6). The final cohort consisted of 26 patients, all with single tumors.
Demographic and medical history was recorded, including age, gender, medical history, and source of pathologic specimen. Further pathologic descriptions, such as the predominance of smooth muscle or scant fatty component, were recorded. The percentage of fat was not specified in the pathology report.
Computed tomography
Twenty of the 26 patients underwent a preoperative CT examination. Fifteen CTs were performed at our institution, while six were acquired at outside institutions. Due to the retrospective nature of the study and the inclusion of outside imaging, CT acquisition parameters and protocols were not standardized. One patient underwent two preoperative CT examinations (one with corticomedullary phase only and one with pre- and postcontrast images); therefore, the results of 21 preoperative CTs are presented. All patients had postcontrast imaging available in the corticomedullary phase (n = 8), the nephrographic phase (n = 4), or both (n = 9). Thirteen patients had precontrast imaging available, and three studies included an excretory phase.
Magnetic resonance
Nine of the 26 patients underwent MR examinations (6 MR only, 3 MR in addition to CT). Due to the retrospective nature of the study, MR acquisition parameters and protocols were not standardized. Seven studies were performed at our institution, while two were acquired at outside institutions. All nine MR examinations included T2-weighted and postcontrast sequences. Eight MR examinations included fat-suppressed sequences (both in- and opposed-phase and fat-saturated sequences). Eight MRs included unenhanced, corticomedullary, and nephrographic phases, with five of eight having additional delayed postcontrast phases. One MR was performed only with unenhanced and nephrographic phases.
Image analysis
All CT and MR images were reviewed by one fellowship-trained radiologist (C.S.) with 20 years of experience in genitourinary imaging. Tumor diameter, side, and tumor location (upper pole, interpolar, or lower pole) were recorded. Tumors were labeled exophytic, endophytic, or central. Exophytic lesions were further assessed to see if the lesion was entirely exophytic, possessed a round or angular tumor/parenchymal interface, or a “mushroom” extension from the renal border (Fig. 1). 9,10 The presence or absence of calcifications and necrosis on CT and necrosis on MR was recorded. For both CT and MR examinations, manually placed regions of interest (ROIs) on the slice with largest volume of tumor were used for density, signal intensity (SI), and enhancement assessment. Homogeneity of enhancement was assessed by gross visual inspection.
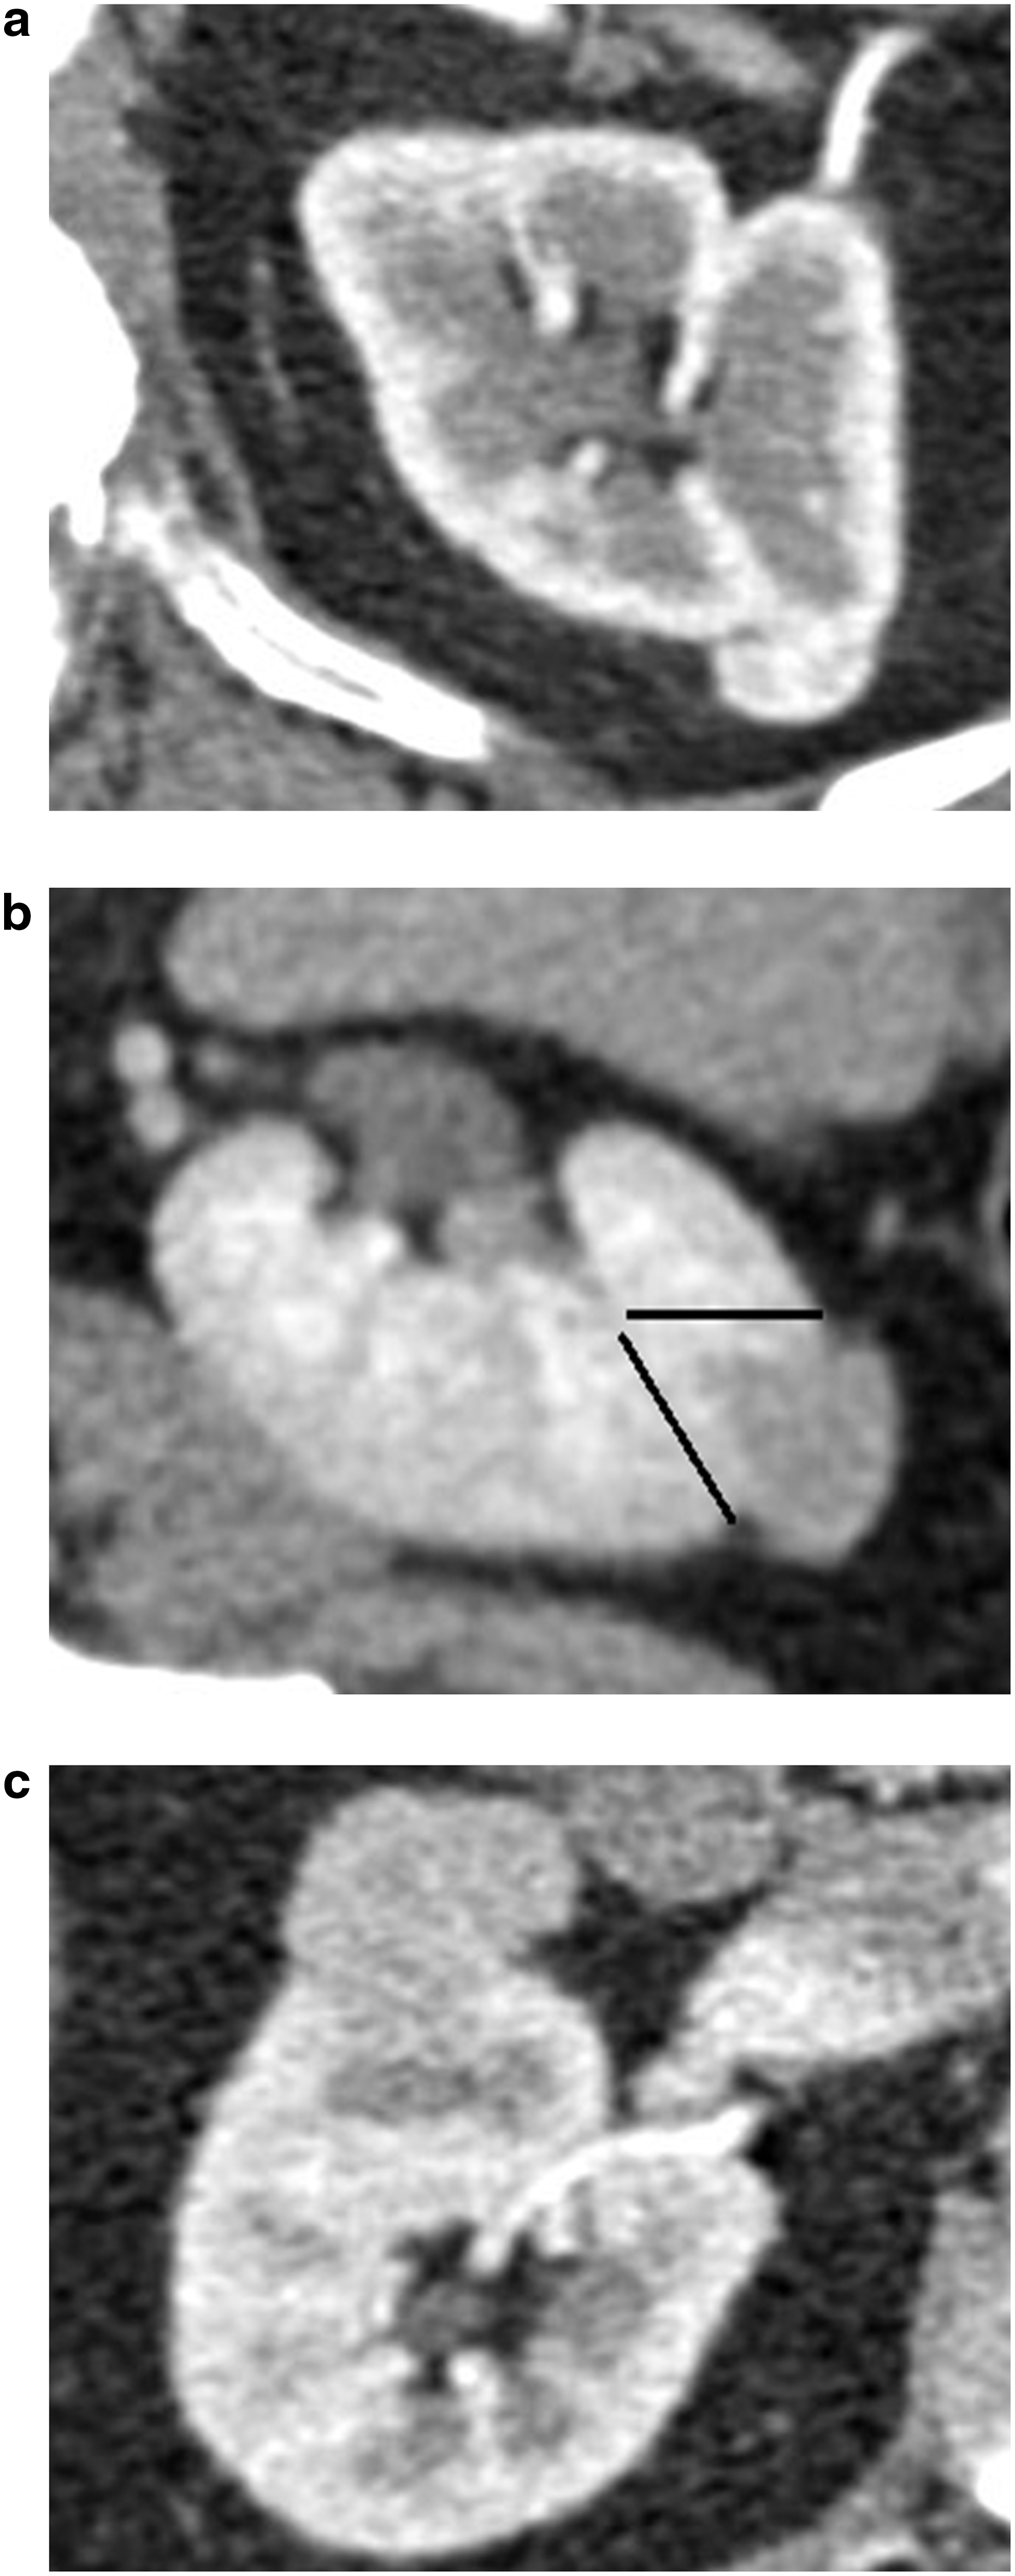
Examples of radiographic features evaluated in all patients with AML:
CT attenuation was quantitatively measured for renal masses on all phases. Enhancement was defined as an increase in attenuation of 10 HU from the unenhanced to enhanced sequences (either corticomedullary or nephrographic). The attenuation of the tumor was visually compared to the normal renal parenchyma on the unenhanced scans and described as hypodense, isodense, or hyperdense.
On MR, the SI in the tumor on T1- and T2-weighted images was described visually as hypointense, isointense, or hyperintense relative to the adjacent normal renal parenchyma. SI is an arbitrary unit that depends on numerous factors specific to both patient and MRI scanner. 11 These variables include intrinsic properties of T1 and T2 sequences, echo time, inversion time, and rotational angle. The tumor SI on in- and opposed-phase images was recorded with “SI drop,” defined as a 10% drop in SI from in-phase to opposed-phase. Lesion SI was measured at the same slice level on in-phase and opposed-phase images with a manually placed round or elliptical ROI. SI values were compared between the two, and a quantitative calculation to assess for signal drop in the opposed phase was performed using the following formula: (SIin−SIopp)/SIin × 100, where SIn is lesion SI on in-phase images and SIopp is lesion SI on opposed-phase images. The threshold of 10% was chosen to reflect a non-negligible amount of intralesional microscopic fat and to be consistent with prior literature. 12 The SI on fat saturation sequences was visually compared to the same sequence without fat saturation, and the tumor was noted to have or not have macroscopic fat. Quantitative measurements of SI were obtained in each phase. Enhancement was defined as an increase in SI of 10% from precontrast to nephrographic sequences and by using the following equation: % enhancement = (SIpost−SIpre)/SIpre × 100%, where SIpre is the precontrast SI of the lesion and SIpost is the postcontrast SI of the lesion. A 10% threshold was used to achieve high sensitivity for tumor enhancement and simultaneously avoid artifactual enhancement as can be seen in nonenhancing lesions (e.g., simple cysts may manifest enhancement of 1%–5%). 11
Descriptive statistics were performed, rather than a formal statistical analysis, given that the aim of the study was to determine frequency of findings.
Results
Twenty-three patients were found to have fp-AML after undergoing a partial nephrectomy, while one patient was diagnosed after radical nephrectomy. Two patients were diagnosed by renal mass biopsy, one of which was performed at the time of cryoablation for suspected RCC. Table 1 summarizes the patients' clinical characteristics. One patient had a history of AML and was also the only patient with tuberous sclerosis. Table 1 also displays radiographic characteristics of the AMLs. Twenty-four of the AMLs were less than 4 cm, leaving only 2 AMLs greater than 4 cm in diameter (4.2 and 5.3 cm, respectively).
SD = standard deviation.
Review of pathology reports revealed a specific description of “minimal fat,” “fat-poor,” or similar terms for 12 of the masses. The remaining 14 masses were identified as being fp-AMLs by the pathologic identification of AML and comparison to the preoperative imaging, which did not reveal macroscopic fat. One tumor was the epithelioid variant of AML.
Table 2 summarizes the CT findings of the 20 patients who underwent CT examination. The mean ± standard deviation (SD) density on unenhanced images was 37 ± 10 HU. The range was from 20 to 54 HU, and no lesions had HU measurements near the −10 HU threshold, which is characteristic of fat. 13 All 13 patients with unenhanced and enhanced sequences demonstrated enhancement. Figure 2 illustrates the unenhanced and enhanced CT features of the majority of fp-AMLs.
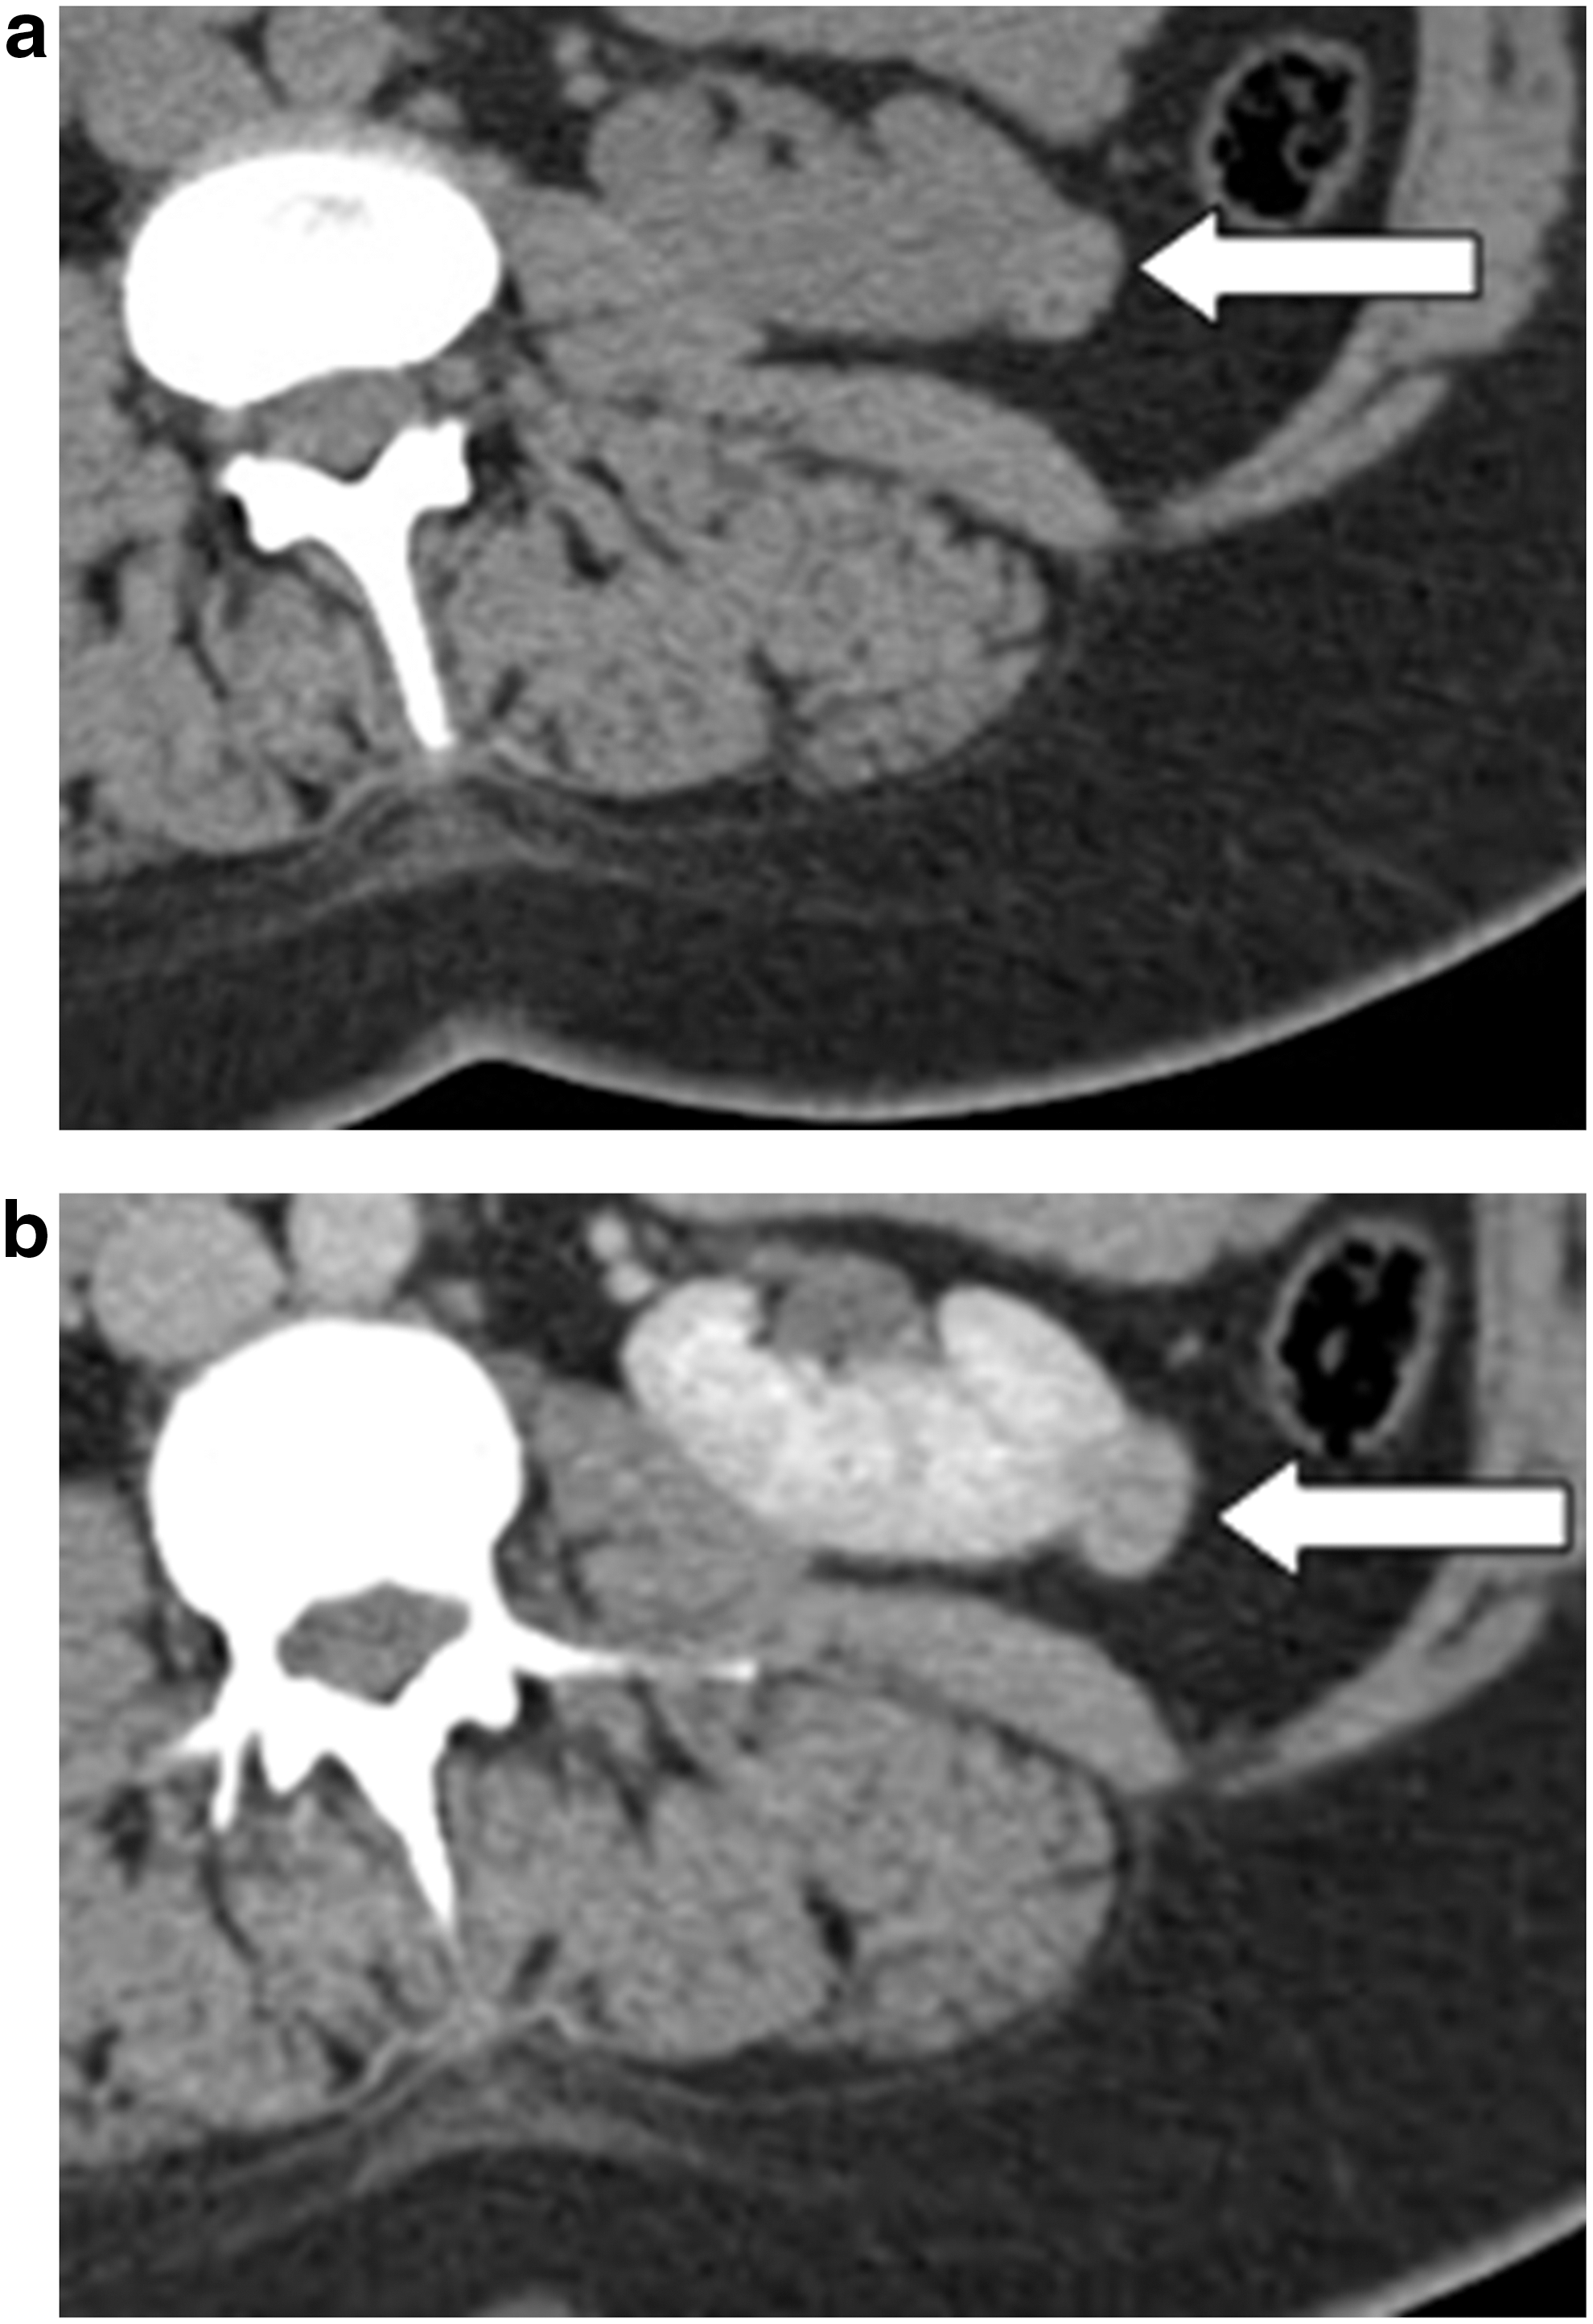
Transverse CT scan showing a 1.8 cm exophytic, left lower pole AML with minimal fat in a 41-year-old female (arrows).
CT = computed tomography; HU = Hounsfield units.
Table 3 shows the MR characteristics of nine AML lesions. The mean SI ± SD on T1-weighted images before gadolinium was 113 (±73). Enhancement following administration of gadolinium occurred in all cases with available pre- and postgadolinium images. All nine lesions were either hypointense on T2-weighted MR or homogenously enhancing. Figure 3 illustrates common MR features of fp-AMLs.
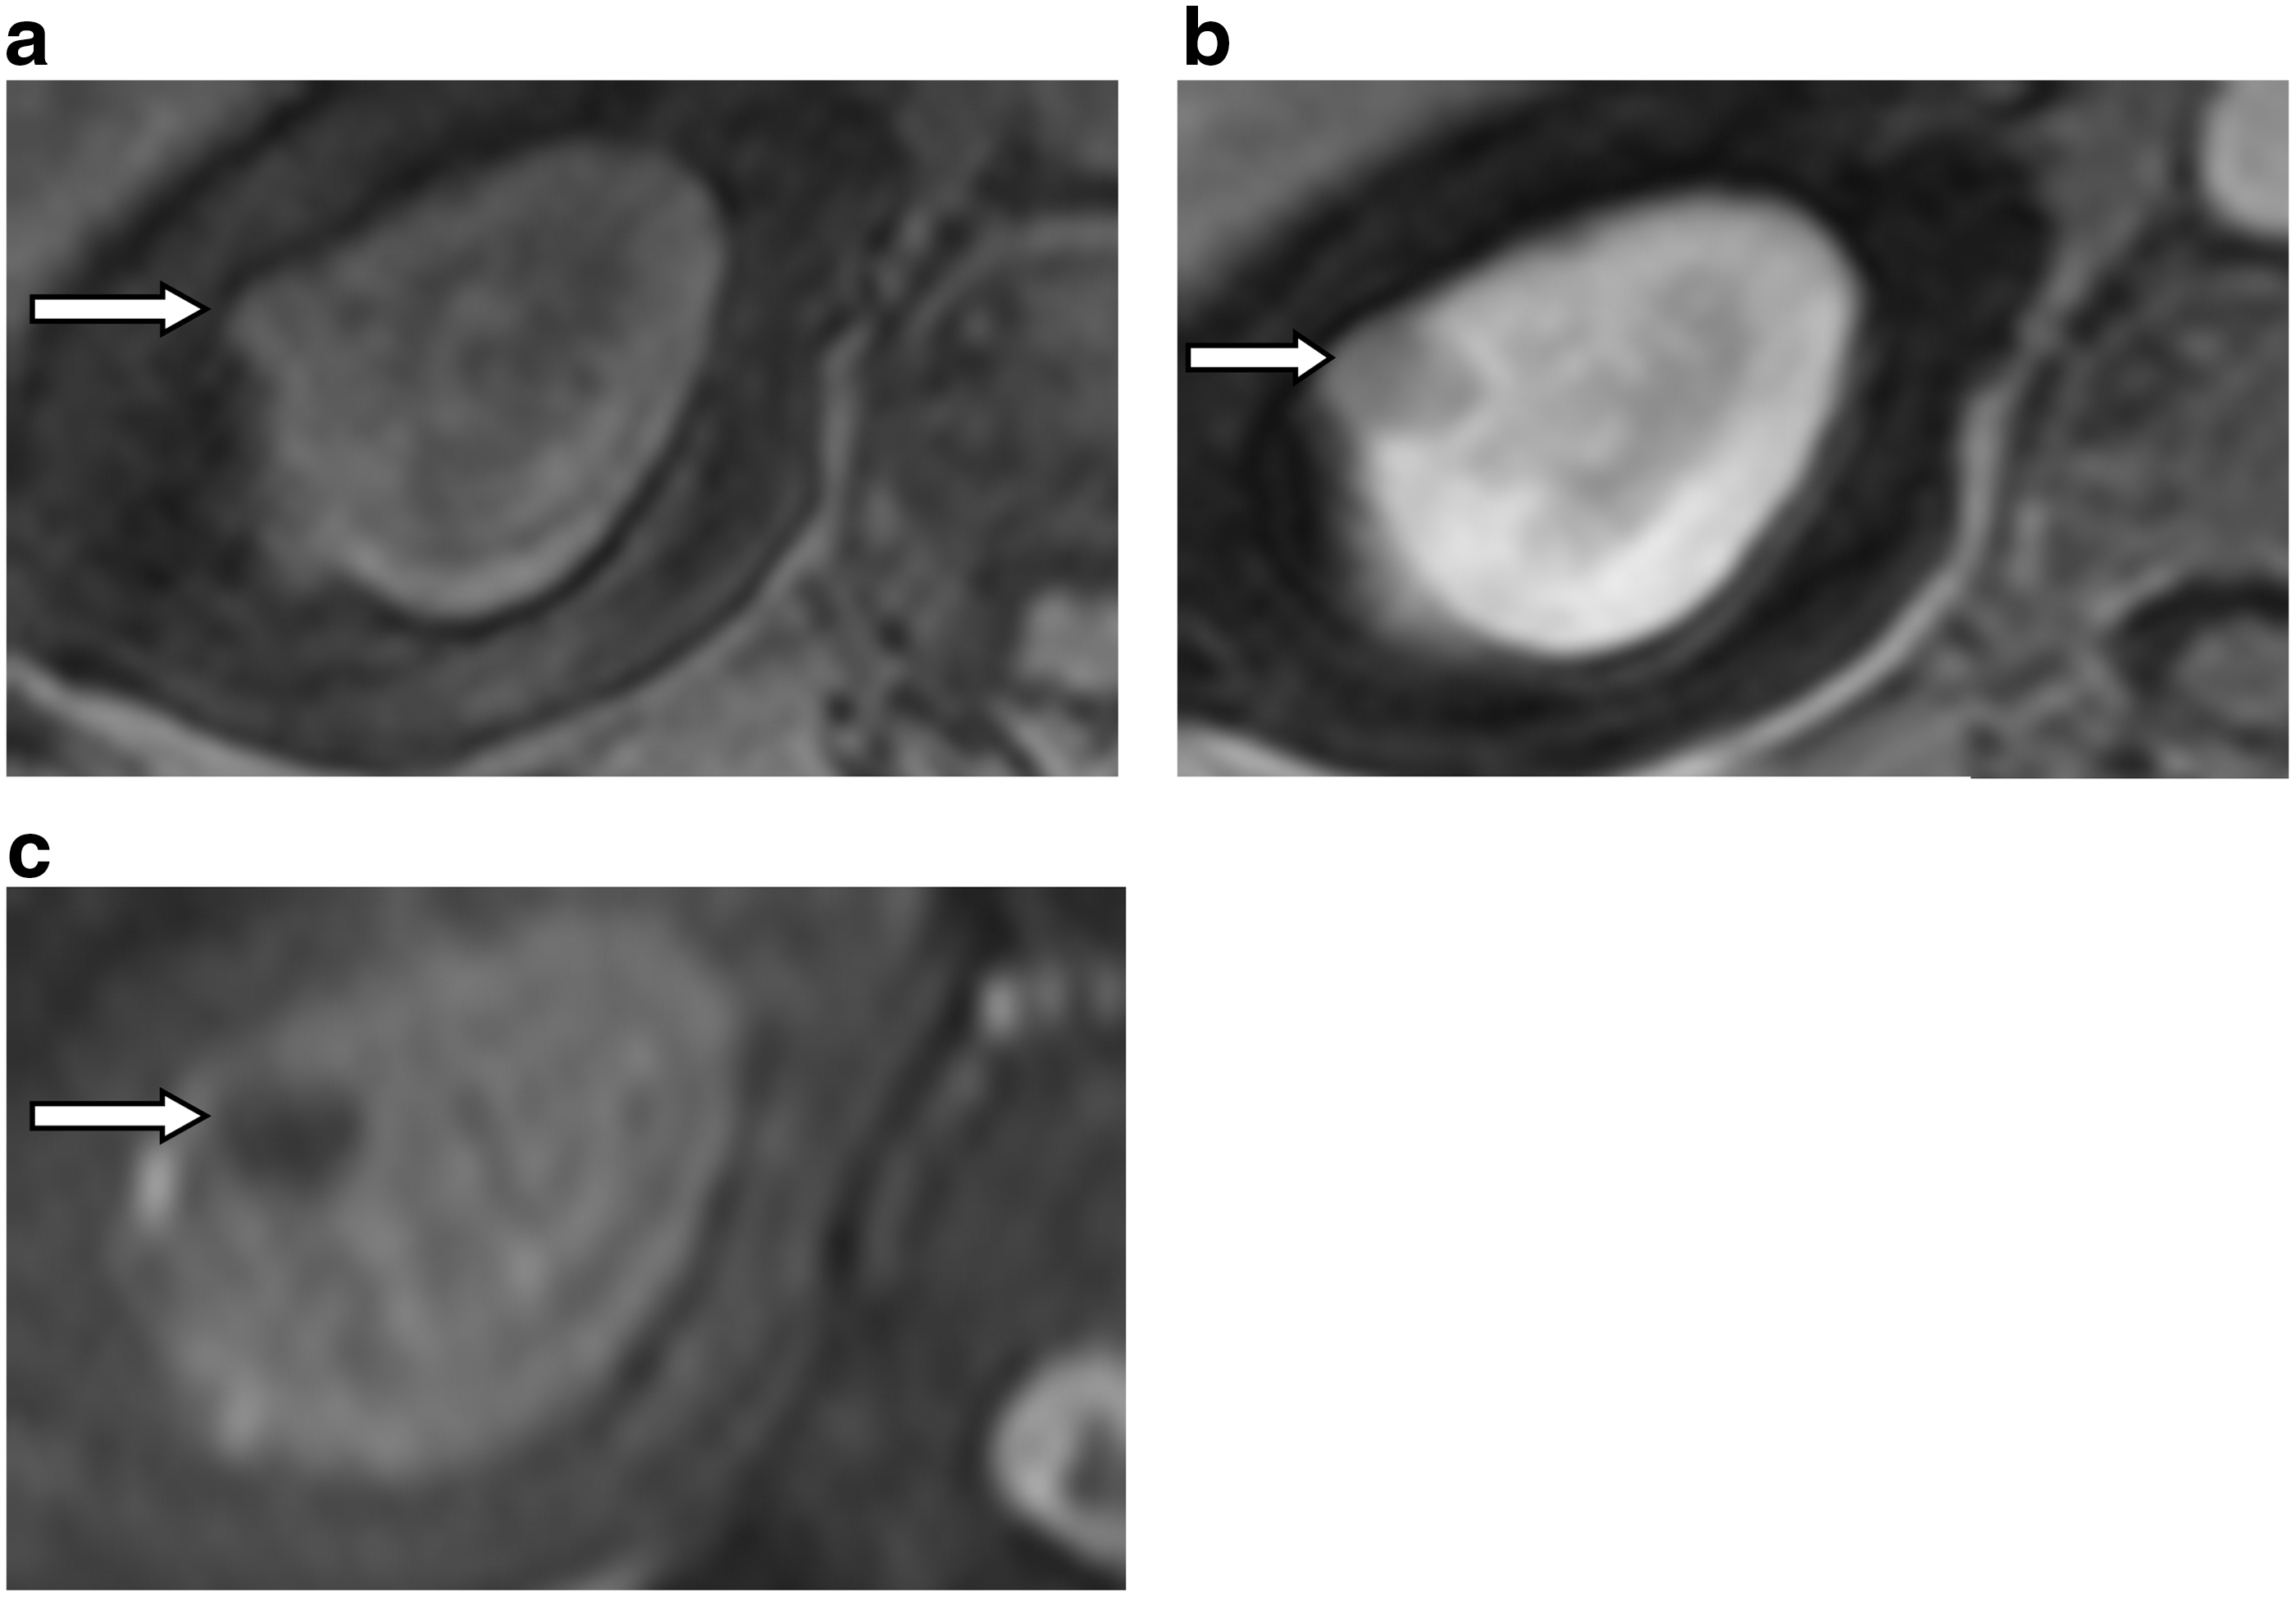
Transverse MR images showing a 1.1 cm right upper pole AML with minimal fat in a 77-year-old female (arrows).
SI = signal intensity.
Discussion
Differentiating an fp-AML from RCC remains challenging, despite improvements in imaging. 4,10 The body of literature describing findings and techniques that may be used to distinguish fp-AMLs is growing (Table 4). Some of the most commonly described findings are (1) hyperdensity on unenhanced CT, (2) homogenous enhancement on enhanced CT, and (3) hypointensity of T2-weighted MR. We evaluated the applicability of these imaging characteristics to an institutional cohort of fp-AMLs. Twenty-one of 26 (81%) patients met at least one of the criteria: hyperattenuation on unenhanced CT (8/13 [62%]), homogeneous enhancement on CT (14/20 [70%]), or hypointensity on T2-weighted MR (8/9 [89%]). Other notable findings in the present review include the absence of a signal drop on opposed-phase MR (6/8 [75%]) and homogenous enhancement on enhanced MR (5/9 [56%]). However, these characteristics are not as often detailed in the literature, and may not help distinguish fp-AML from RCC. 12,14
Bolded text indicates study finds consistent with the results of the current study.
AML = angiomyolipoma; AUC = area under the curve; ccRCC = clear cell renal-cell carcinoma; fp-AML = fat-poor AML; NA = not applicable; RCC = renal-cell carcinoma; ROC = receiver operating characteristic.
As in the present study, many previous studies have found that hyperintensity on unenhanced CT 10,12,15 –18 and homogenous enhancement on contrasted CT 4,10,15,17 can help to identify fp-AMLs (Table 4). Similarly, there are several reports that describe a hypointense signal for fp-AMLs on T2-weighted MR. 5,12,14,19 –22 In a 2016 investigation, Jeong et al. compared 18 fp-AMLs to 155 RCCs. The authors found that the fp-AMLs had an increased tumor–cortex attenuation ratio on unenhanced CT and had a decreased SI of T2-weighted MR. 12 Likewise, in another large series described by Yang et al., 33 fp-AMLs were compared to 102 RCC tumors. The fp-AMLs were found to have a significantly greater rate of unenhanced attenuation of >38.5 HU and enhanced homogeneity. 17 Still other findings have been associated with fp-AML. Renal masses, which have been described as having either an angular interface with the adjacent parenchyma or having a shape resembling an “ice-cream cone” or “mushroom,” 17,23 are more likely to be fp-AML (Fig. 1). Finally, some authors have proposed using positron emission tomography-CT, which has shown early promising results. 24
Despite the above imaging descriptions, the findings manifest in fp-AMLs can be inconsistent across studies (Table 4). For example, MR with diffusion-weighted imaging presents conflicting results, as one study found a greater apparent diffusion coefficient (ADC) 25 and another a lower ADC relative to RCC. 26 Also, some authors have reported that in- and opposed-phase MR can be utilized to distinguish fp-AMLs, 14 while others have found these sequences unreliable. 12,21,27 Furthermore, the use of CT histogram analysis to predict fp-AML has been met with conflicting results and is not readily utilized. 13,28,29 Finally, while ultrasound provides characteristic findings (i.e., hyperechogenicity) for lipid-rich AMLs, the ultrasonic findings for fp-AML are variable. In the present cohort, seven patients had ultrasounds available for interpretation. Four of the fp-AMLs were hyperechoic, while three were hypoechoic.
The differing quantity of fat in each tumor makes universal findings on imaging unlikely. Thus, it is most likely that no single finding or instrument will be perfectly accurate. Recent work by Kim et al. has suggested a more comprehensive scoring system, which includes both clinical and radiographic variables. The scoring system was able to yield an area under the curve of 0.919. At various cutoff points, the system conferred accuracy, sensitivity, and specificity as high as 90%, 68%, and 95%, respectively. 15 Including multiple variables in such a system is time-consuming, not easily calculable, and presents challenges in any health system, in which imaging protocols are not standardized.
The rate of benign tumor extirpation remains unsatisfactory, and one of the most common benign lesions excised is AML. 5 –8 Thus, improved diagnostic practices are necessary. The use of percutaneous biopsy in patients with small renal masses may augment the effectiveness of current management of small renal masses. Contemporary biopsy techniques afford yields of >80% to 90%, benignity versus malignancy accuracy of 74% to 100%, and complications rates of 1% to 2%. 30 Given the safety and accuracy profiles of renal biopsy, it is reasonable to assert that a biopsy should be undertaken in any patient with a radiographic indication of possible benignity, or for any patient for whom the management may change based on biopsy results.
There are limitations to the present study, many of which are attributable to its retrospective nature. First, there was variability present in the imaging protocols. Furthermore, the series of cases is small, although there are few series with a larger cohort of fp-AMLs. A number of AMLs were not included in the present description due to the lack of available outside imaging. Also, diffusion-weighted MR imaging and CT histogram analysis were not available for many of the patients in this cohort, making comparison to the findings of previous reports impossible. In addition, all of the imaging was interpreted by a single, genitourinary-dedicated, fellowship-trained radiologist; however, she was not blinded to the diagnosis of fp-AML. Importantly, the present cohort was not matched to a group of similar non-fp-AMLs (e.g., RCCs), which prohibits statistical conclusions. Future work on fp-AMLs should seek to standardize imaging protocols and increase patient cohorts through multi-institutional collaborations. Finally, future investigations may benefit from focus on the inclusion of clinical variables (e.g., female gender) and novel techniques to improve the prospective identification of fp-AMLs.
Conclusion
The distinction between fp-AML and RCC continues to be difficult and may result in unnecessary interventions for these benign lesions. In this series, the majority of fp-AMLs were found in young females with asymptomatic, small renal masses. The presence of a small renal mass with hyperattenuation compared to normal renal parenchyma on unenhanced CT, homogeneous enhancement on enhanced CT, and a hypointense SI compared to normal renal parenchyma on T2-weighted MR should raise the suspicion of an fp-AML. Performing a renal mass biopsy when these features are present may confirm the diagnosis of AML and prevent unnecessary treatment of these benign tumors.
Footnotes
Author Disclosure Statement
No competing financial interests exist.