




Abstract
Objective:
To assess the association between the R.E.N.A.L. Nephrometry score, the amount of non-neoplastic parenchymal volume (NNPV) removed, and the renal function decline in patients undergoing robotic partial nephrectomy (RPN).
Patients and Methods:
The Multi-institutional Mount Sinai Kidney Cancer Database was used to identify 1235 patients who underwent RPN between January 2008 and February 2016, of whom 366 had complete data, including NNPV removed. Mann–Whitney U tests and univariable linear regression models were used to assess the relationships between R.E.N.A.L. Nephrometry score, warm ischemia time (WIT), and NNPV removed. Univariable and multivariable regression models were then used to assess the independent relationships of each of these variables with percent change in estimated glomerular filtration rates (eGFR) and acute kidney injury (AKI) within the first 30 postoperative days in addition to percent change in eGFR and progression to chronic kidney disease at a median follow-up of 6.9 months.
Results:
Increasing R.E.N.A.L. Nephrometry score was shown to be a predictor of WIT (β = 0.92, p < 0.001) and of NNPV removed (β = 6.21, p < 0.001) in univariable analyses. In multivariable analysis, postoperative reduction in eGFR within the first 30 days of surgery was associated with both R.E.N.A.L. Nephrometry score (β = −2.02, p < 0.001) and NNPV removed (β = −5.19, p = 0.015). R.E.N.A.L. Nephrometry score (OR = 1.21, p = 0.013) and NNPV removed (OR = 1.90, p = 0.013) were also associated with an increased likelihood of AKI within the first 30 days. No significant association in this cohort was found between R.E.N.A.L. Nephrometry score, NNPV removed, or WIT and renal function decline at 6.9 months.
Conclusion:
The preoperative R.E.N.A.L. Nephrometry score can be used to predict postoperative pathologically determined healthy renal volume loss or NNPV removed. Removal of not just the tumor but also the healthy surrounding parenchyma is important in determining renal function decline. As our understanding of the importance of renal volume loss grows, NNPV removed gains increasing utility as an easily determinable postoperative variable.
Introduction
P
Given the possible complexity associated with PN, validated tools and predictive calculators, including the R.E.N.A.L. Nephrometry score, have been used to assess perioperative and postoperative morbidity. 6 These calculations are vital for counseling PN patients before surgery. The R.E.N.A.L. Nephrometry score is a standardized anatomic classification system of renal tumors based on preoperative imaging findings, which has been utilized to predict complications following surgery and recurrence after surgical removal of the primary tumor. 7 More recently, it has been used to predict the effects of surgery on postoperative renal function. 6,8,9 While both NNPV removed and radiographically determined renal volume loss have previously been shown to affect postoperative PN outcomes, 3,10,11 to our knowledge no study has linked R.E.N.A.L. Nephrometry score and pathologically determined NNPV removed and functional outcome. In this study, we assess whether the R.E.N.A.L. Nephrometry score is associated with NNPV and postoperative renal function after robotic partial nephrectomy (RPN).
Patients and Methods
Study cohort selection
One thousand, two hundred thirty-five patients were identified from the IRB-approved Multi-institutional Mount Sinai Kidney Cancer Database who underwent RPN at 4 medical institutions between January 2008 and February 2016. Patients were excluded from analysis if the patient had prior ipsilateral kidney surgery (n = 3); solitary kidney (n = 5), multiple renal masses (n = 18); tumor thrombus (n = 9); a horseshoe kidney (n = 2); conversion to radical nephrectomy or open PN (n = 6); or missing data on NNPV (n = 783), R.E.N.A.L. Nephrometry score (n = 43), WIT (n = 5), or baseline estimated glomerular filtration rates (eGFR) (n = 3). There were 366 patients with complete data included in the analysis.
Population characteristics
The following preoperative variables were assessed: age, gender, body mass index (BMI), American Society of Anesthesiologists (ASA) score, baseline serum creatinine, baseline eGFR, R.E.N.A.L. Nephrometry score, anterior vs posterior location, tumor laterality, and preoperative tumor size. Perioperative data assessed included the following: NNPV removed, WIT duration, renal artery clamp technique, estimated blood loss (EBL), operative time, length of stay (LOS), positive surgical margins, and overall postoperative complication rates. The percent change in eGFR and acute kidney injury (AKI) within the first 30 postoperative days in addition to the percent change in eGFR and progression to chronic kidney disease (CKD) at ≥3 months postoperative evaluation.
The modification of diet in renal disease formula was used to calculate eGFR. 12 The percent change in eGFR was calculated as follows: [100 × ((eGFR at follow-up − eGFR at baseline)/eGFR at baseline)]. CKD stages were defined using the previously published and commonly used references. 13 Progression of CKD was calculated by comparing eGFR at ≥3 months and the patient's baseline eGFR and corresponding CKD stage. Progression of CKD was defined as an increase from CKD stage 1 or 2 to stage ≥3, an increase from CKD stage 3 to stage ≥4, or an increase from CKD stage 4 to stage 5. AKI was defined as ≥25% reduction in eGFR within the first 30 postoperative days. Major complications were defined as Clavien–Dindo ≥3. NNPV removed was calculated according to a previously defined pathologic method (specimen volume [tumor volume + normal renal parenchyma with peri-renal fat removed from specimen] − tumor volume), using three-dimensional ellipsoid formulas for pathologic tumor volume 11,14 and specimen volume [(π/6) × length × width × height]. 11
Primary comparisons
The cohort was analyzed for relationships between R.E.N.A.L. Nephrometry score, NNPV removed, WIT, and short-term renal function outcomes (defined as percent reduction in eGFR and AKI within the first 30 postoperative days), as well as long-term outcomes (defined as percent reduction in eGFR and progression to CKD at ≥3 months), which in this cohort was a median follow-up of 6.9 months (IQR 6.0–17.9; Range 2.9–40.0). We also examined the effect of the individual R.E.N.A.L. Nephrometry score components on NNPV removed.
Statistical analyses
Medians, interquartile ranges, frequencies, and percentages were calculated for demographic and clinical characteristics, as well as for tumor-specific and perioperative variables. NNPV removed was treated in a continuous and categorical (i.e., greater or equal to vs less than the average) manner for all analyses.
Regression (linear, logistic, Cox proportion hazards) models were used to assess the relationships between R.E.N.A.L. Nephrometry score, NNPV removed, WIT, and renal function outcomes. Mann–Whitney U tests were used to compare the R.E.N.A.L. Nephrometry score and renal function outcomes in cohorts with NNPV as a categorical variable, comparing NNPV greater than or equal to the median NNPV vs less than the median NNPV value across all patients. Both univariable and multivariable linear and logistic regression models were used to assess the independent relationships of NNPV, R.E.N.A.L. Nephrometry score, and WIT against the percent change in eGFR, AKI, and progression of CKD. For multivariable analyses assessing the influence of NNPV removed, the R.E.N.A.L. Nephrometry score, and WIT on renal function outcome at 6.9 months, we adjusted for baseline demographic and tumor-specific variables, including age, gender, BMI, ASA score, baseline eGFR, and anterior/posterior tumor location.
Multivariable linear and logistic regression analyses were also conducted to assess the influence of each individual component of the R.E.N.A.L. Nephrometry score (i.e., radius of tumor, endophytic component, nearness of the tumor to the collecting system, anterior vs posterior location, location relative to polar lines, hilar location) on NNPV (continuous and categorical). All statistical analyses were performed using R version 3.1.3.
Results
Clinical and demographic characteristics are summarized in Table 1. More patients were male (63.4%) than female, and a majority of the patients had normal baseline kidney function (86.6 with eGFR ≥60 mL/min/1.73/m2). WIT was less than 25 minutes for 97.3% of patients (median 14.6 minutes, IQR 11.5–17.8 minutes). The average NNPV removed was 21.3 cm3 (median 11.8 cm3, IQR 6.1–25.6 cm3). Perioperative data, including estimated blood loss, operative time, LOS, positive surgical margins, postoperative complication rates, and percent change in eGFR in the first 30 postoperative days and at a median follow-up of 6.9 months, are presented in Table 1.
For categorical variables, frequencies presented with percentages in parenthesis.
For continuous variables, medians presented with interquartile ranges in parenthesis.
AKI = acute kidney injury; ASA = American Society of Anesthesiologists; BMI = body mass index; CCI = Charlson comorbidity index; CKD = chronic kidney disease; EBL = estimated blood loss; eGFR = estimated glomerular filtration rates; MAC = main renal artery clamping; NNPV = non-neoplastic parenchymal volume; PSM = positive surgical margins; WIT = warm ischemia time.
R.E.N.A.L. Nephrometry score was positively associated with NNPV removed (continuous) (β = 6.21, p < 0.001) (Fig. 1). R.E.N.A.L. Nephrometry score was also found to be significantly higher when NNPV was larger (categorical) (8 vs 7, p < 0.001). R.E.N.A.L. Nephrometry score was also positively associated with WIT (β = 0.92, p < 0.001). In univariable analysis, R.E.N.A.L. Nephrometry score was negatively associated with percent change in eGFR (β = −2.52, p < 0.001) within the first 30 postoperative days but not at ≥3 months (p = 0.072).
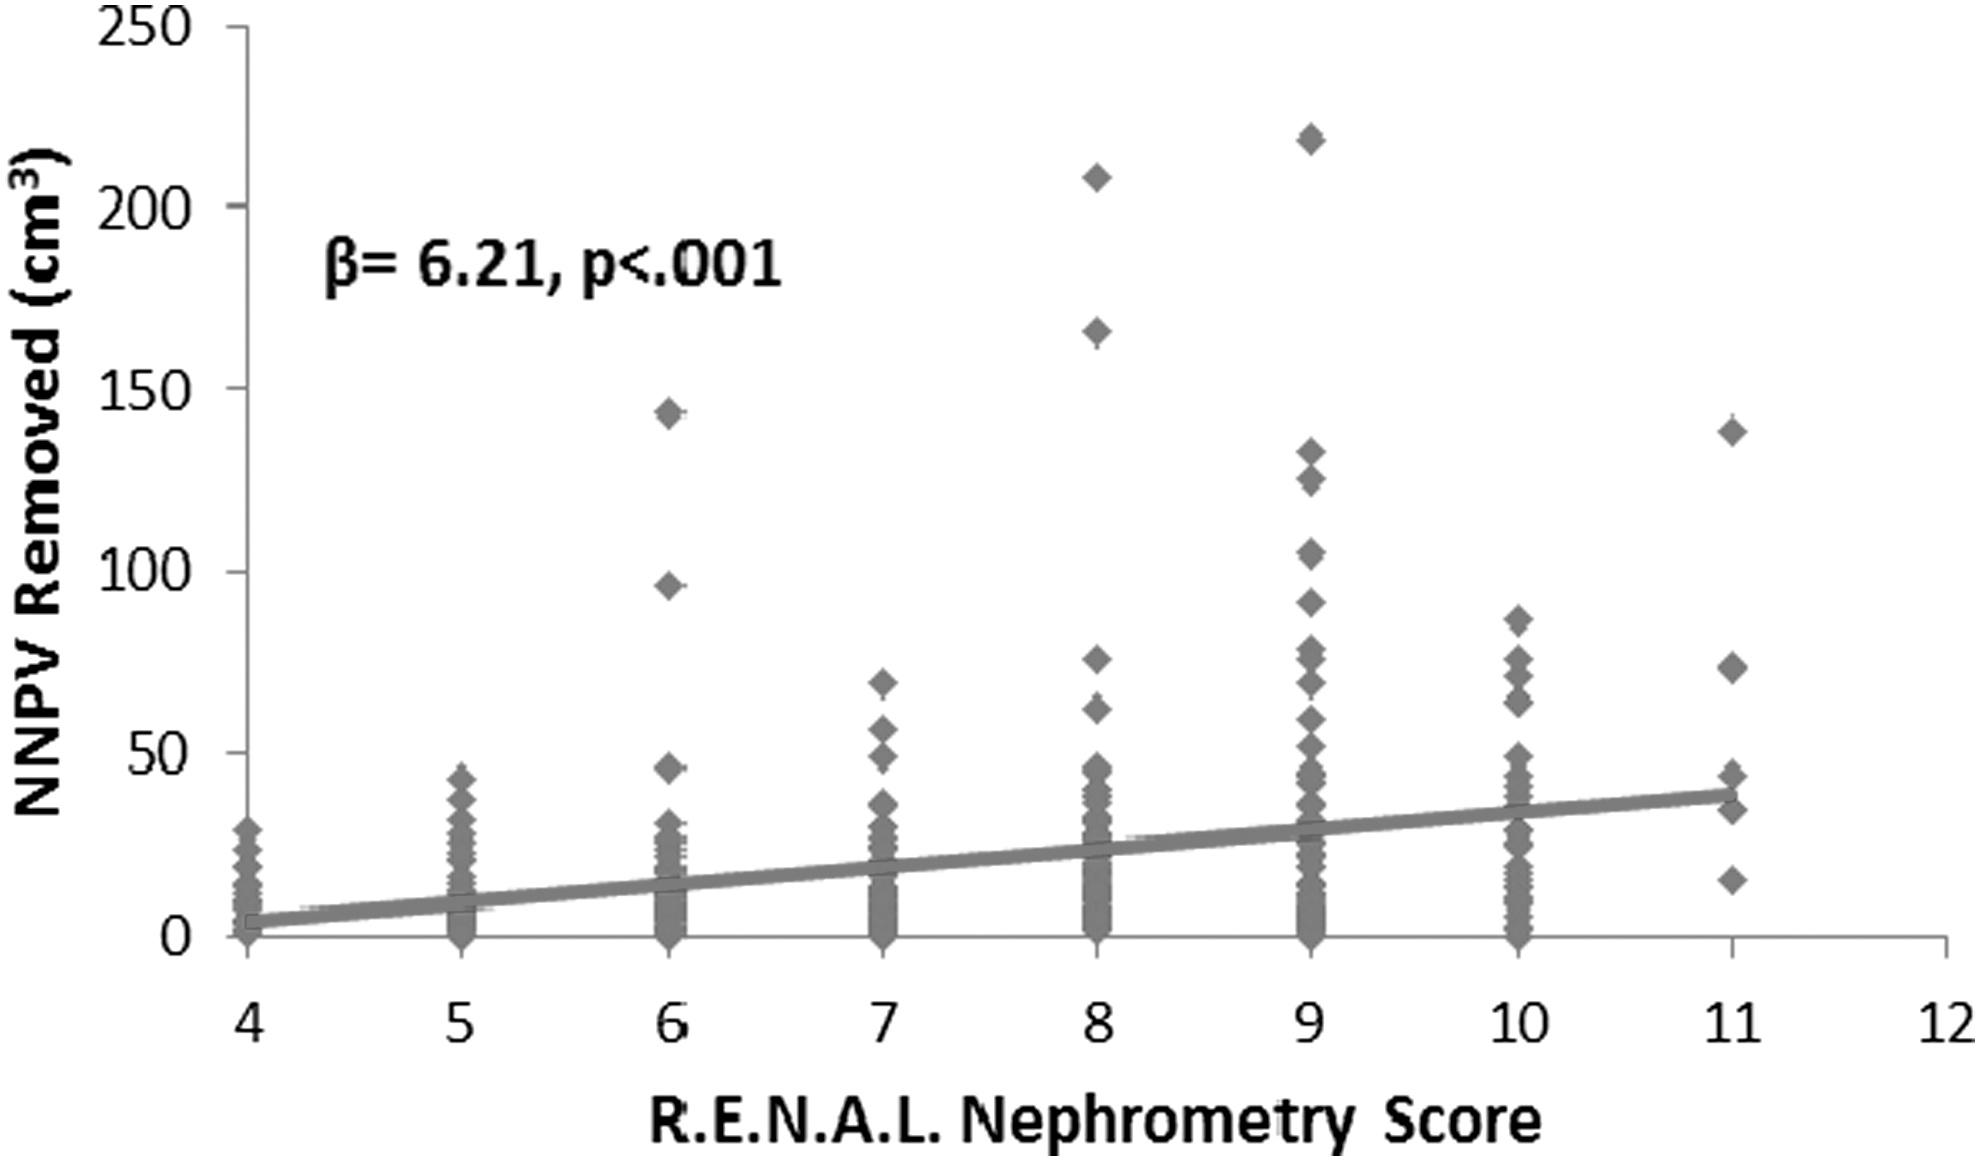
Univariable analysis showing rising NNPV removed (continuous variable) rising with increasing R.E.N.A.L. Nephrometry score. Gray line is a linear line of best fit for the relationship between NNPV removed and the R.E.N.A.L. Nephrometry score. NNPV = non-neoplastic parenchymal volume.
WIT was negatively associated with percent change in eGFR (β = −0.36 p = 0.036) in the first 30 postoperative days but not at ≥3 months (p = 0.573) in univariable analysis.
NNPV (categorical, β = −7.86, p < 0.001) and NNPV (continuous, β = −0.08, p = 0.005) were negatively associated with the change in eGFR within 30 days in univariable analysis. NNPV continuous (p = 0.694) and NNPV categorical (p = 0.328) were not associated with percent change in eGFR at 6.9 months in univariable analysis.
In multivariable analysis, R.E.N.A.L. Nephrometry score (β = −2.02, p < 0.001) and NNPV (categorical) (β = −5.19, p = 0.015), but not WIT (p = 0.868), were negatively associated with percent change in eGFR in the first 30 postoperative days. Similarly, R.E.N.A.L. Nephrometry score (OR = 1.21, p = 0.013) and NNPV (categorical) (OR = 1.90, p = 0.013), but not WIT (p = 0.632), were associated with an increased likelihood of AKI in the first 30 postoperative days.
R.E.N.A.L. Nephrometry score (p = 0.105), NNPV (categorical) (p = 0.178), and WIT (p = 0.272) were not found to be significantly associated with the percent change in eGFR at ≥3 months. R.E.N.A.L. Nephrometry score (p = 0.127), NNPV (categorical) (p = 0.456), and WIT (p = 0.689) were not found to be significantly associated with an increased likelihood of progression to CKD at ≥3 months. Higher baseline eGFR (β = −0.19, p = 0.001) was associated with a greater percent reduction in eGFR but a reduced likelihood of progression to CKD (HR = 0.97, p = 0.016). Age, gender, BMI, ASA score, and lateral vs anterior/posterior tumor location were not associated with either renal function outcome at 6.9 months (p > 0.05).
Results from multivariable linear regression analysis showed that components of the R.E.N.A.L. Nephrometry score, including the radius of the tumor (β = 31.9, p < 0.001) and location of the tumor relative to the polar lines of the kidney (β = 5.26, p = 0.036), were associated with greater NNPV removed (continuous). Radius of the tumor (OR = 2.22, p < 0.001) was the only variable associated with greater NNPV removed (categorical).
Discussion
The loss of healthy renal parenchyma in an RPN has been recognized as one of the most important factors affecting clinical renal function outcome. Recent controversy surrounding the primacy of renal volume compared to WIT in predicting postoperative renal function has increased the importance of accurately assessing volume removed. NNPV is a postoperative, pathologically determined descriptor of healthy parenchyma loss, derivable from most standard pathology reports, and therefore serves as an easily attainable and useful tool for comparing PN outcomes. The R.E.N.A.L. Nephrometry score is an assessment tool of anatomic and surgical complexity, and is associated with increased operative time, EBL, total renal volume loss, 15,16 WIT, 17 –19 and complications. 20 Therefore, it follows that it would also serve as a predictor of NNPV as well as postoperative renal function. 15,21 This study, which demonstrates the association between the R.E.N.A.L. Nephrometry score and NNPV, suggests further validation of the R.E.N.A.L. Nephrometry score as a clinical barometer for surgical complexity and postoperative outcomes.
To our knowledge, our study is the first to document the association of R.E.N.A.L. Nephrometry score and NNPV removed. In prior, predominantly nonrobotic studies focused on NNPV, the reported mean NNPV removed ranged from 34 to 55.1 cm3, 3,4,22 while the present study had a mean of 21.3 cm3 and a median of 11.8 cm3 NNPV, which may reflect an advantage of the robotic approach. 23 –25 Our data show that the radius of the tumor component of the R.E.N.A.L. Nephrometry score, was the strongest predictor of NNPV. This correlates well with the data reported by Golan et al., 5 which identified tumor size, ischemia time, and an earlier era of minimally invasive surgery as predictive factors for the amount of NNPV lost during a PN. In that series, NNPV removed was not associated with decreased long-term renal function after surgery. Yet, Kotamarti et al. previously found that greater NNPV removed was a predictor of CKD upstaging. A cohort of Kotamarti et al. 11 had an average preoperative eGFR of 73.22 mL/min/1.73/m2, a mean NNPV removed of 33.54 cm3, and a median WIT of 23 minutes. The cohort of the present study had a higher preoperative eGFR of 84.6 mL/min/1.73/m2, a lower mean NNPV of 21.3 cm3, and a lower median WIT of 14.6. Thus, both the removal of functional kidney parenchyma and damage to the remaining healthy kidney were limited in the present study's patients, and may explain why we found no significant long-term association between NNPV removed and decrease in eGFR (p = 0.178) or CKD progression (p = 0.456). In fact, when looked at as a continuous variable, small incremental changes in NNPV removed did not demonstrate the clinical impact seen when examined as a categorical variable. These notable differences between the study cohorts, particularly the relatively small amount of NNPV removed, may explain the variation between the studies' findings. Since the amount of NNPV removed was found to be relatively low, it is likely that NNPV removed for most patients in this study represents renal parenchyma proximal to the tumor. Renal parenchyma closer to the tumor has been shown to have less glomerular viability than renal parenchyma further from the tumor, which is lost during larger resections and may underlie why low NNPV removed in this study did not significantly affect renal function at 6.9 months. 26
Examining the long-term effects of loss of volume due to PN on renal function can be challenging in many cases because of the normal function and compensation of the contralateral kidney, which can obscure the loss of renal function from PN. However, studies on patients with solitary kidneys can provide information on isolated renal function and long-term effects after nephron sparing surgery. Fergany et al. examined the outcomes of PN in patients with solitary kidneys and reported that more than 38% of the patients had a significant rise in serum creatinine with an additional 41% having a minor increase in creatinine. Factors identified that statistically affected postoperative creatinine included renal ischemia time, percent of renal parenchyma resected, and age of the patient. 27 Sharma et al. 3 reported an average functional volume loss of 15% in patients with solitary kidneys after PN, and a correlation between percent volume loss and long-term eGFR, especially in patients with baseline impairment of renal function.
It is suspected that in patients with two functioning kidneys, the effect of renal parenchyma loss on renal function in the operated kidney is tempered by the healthy contralateral kidney. Choi et al. 28 supported the assertion that postoperative contralateral compensational hypertrophy after PN correlates with the amount of parenchyma loss, as well as subsequent eGFR recovery. Studies in patients with two kidneys have found that percent functional volume preservation is predictive of postoperative renal function preservation. 29 In particular, Simmons et al. 10 found that late (median 1.4-year follow-up) postoperative renal function was strongly correlated with renal parenchyma preserved (r 2 = 0.5, p < 0.001).
Along with volume loss, ischemia to the kidney during surgery, specifically a WIT of greater than 25 minutes, has also been shown to impact eGFR. 2,10,21,30,31 In this study, the WIT was well below this time threshold (97.3% of patients had WIT below) with a median WIT of 14.6 minutes. As has been previously shown, 19 in our study, R.E.N.A.L. Nephrometry score was positively associated with WIT, but in this low ischemia cohort there was no significant association between WIT and reduction in eGFR at median follow-up of 6.9 months, possibly reflecting a threshold effect and limited long-term damage from ischemia. These findings are consistent with other studies which have demonstrated that short WIT does not have a significant impact on long-term postoperative renal function and eGFR. 4,10
This study is limited by the subjective variability of measurement by multiple pathologists calculating NNPV without a standardized protocol, although it was calculated from standardized pathologic measurements. The R.E.N.A.L. Nephrometry score also has inherent evaluator variability, but has also been shown to be reproducible in the past. 32 In addition, because many of the study cohort patients were referred to a tertiary care facility for surgical management, for some patients, long-term follow-up was done outside the system and follow-up times varied. While these results are highly generalizable since most patients undergoing RPN have both kidneys, compensatory hypertrophy of the contralateral kidney highlights the need for validation of this study's findings in a single kidney model.
This study supports and demonstrates the R.E.N.A.L. Nephrometry score's ability to predict NNPV removed. NNPV removed can be easily calculated, making it significantly more widely available for academic research than preserved kidney volume calculated from dedicated imaging. Wide adaptation of this easily attained variable could significantly increase the ability to assess the effects of volume loss on renal function. Our data support the ability of R.E.N.A.L. Nephrometry score to predict both NNPV removed and early postoperative eGFR change, and link NNPV removed with postoperative renal function decline.
Footnotes
Author Disclosure Statement
Dr. Ronney Abaza received grants from Intuitive Surgical and ConMed (Surgiquest), outside the submitted work, so there are no competing financial interests. All other authors have no competing financial interests.