




Abstract
Introduction and Objective:
This prospective study aimed to evaluate the effect of ramping and pause protocols on renal fibrosis, blood pressure control, and renal function in patients receiving extracorporeal shockwave lithotripsy (SWL).
Patients and Methods:
This study prospectively recruited 320 patients with solitary radiopaque renal stones <15 mm in size. Patients were randomized to receive one of four shockwave protocols: (1) standard protocol (no ramping or pause); (2) ramping protocol alone; (3) ramping and pause protocols; or (4) pause protocol alone. Spot urine samples were collected before and for 2 years after treatment to monitor the levels of the renal fibrosis marker procollagen III aminoterminal propeptide (PIIINP) by blinded research staffs. Blood pressure and serum creatinine levels were also monitored during follow-up.
Results:
The four groups had comparable baseline data and treatment parameters. Significant increases (p < 0.05) in the urinary PIIINP levels from 6 weeks until 18 months after SWL were observed among all patients and in individual groups. PIIINP levels peaked at 1 year after SWL and gradually decreased to the baseline at 2 years. At the 2-year follow-up point, the overall serum creatinine levels remained significantly elevated (76.21–80.01 μmol/L, p < 0.001). Twenty (9.95%) patients developed new-onset hypertension and another 43 (36.4%) experienced worsening blood pressure control. However, no differences were observed among the four treatment groups.
Conclusions:
SWL led to significant increases in renal fibrosis marker levels for up to 18 months after treatment. However, no differences in changes in renal fibrosis marker and serum creatinine levels and worsening of blood pressure control were observed with respect to the use of either ramping or pause treatment protocols.
Introduction
A
Here, we report the longer-term (up to 2 years) results of patients in this study cohort. In particular, we focus on the changes in urine markers of renal fibrosis, change in renal function, and the incidence of worsening blood pressure control. We hope that our findings will further address the impacts, if any, of these two treatment protocols on longer-term outcomes and complication rates. Moreover, we hope that our findings will provide further prospective information regarding the long-term effects of SWL in clinical practice.
Patients and Methods
This prospective randomized study was designed to assess the effects of two renal protective protocols, ramping and pause, on patients receiving SWL for renal stones. Local institutional ethics approval was obtained, and the study was conducted in accordance with good clinical practice guidelines and the Declaration of Helsinki. The clinical trial registration number is ChiCTR-TRC-10001134. The details of the trial protocol (including the sample size estimation and randomization process) were published in an earlier report describing the immediate to 3-month follow-up of these patients.
5
In summary, 320 adult patients with solitary renal stones <15 mm in size who were planning to undergo primary SWL with an electroconductive lithotripter (Sonolith Vision; Edap-Technomed, France) at our center were prospectively recruited for this study between January 2011 and July 2013. The specification of the machine was listed in Supplementary Table S1 (Supplementary Data are available in online at
Regarding lithotripsy, the maximum power recommended by the manufacturer for renal stone treatment was 80% (14.5 kV). All patient treatments were designed to administer maximum energy of 1000 energy units (as recommended by the manufacturer).
6,7
After receiving informed consent and confirming that all inclusion criteria were met, we randomized patients to receive one of the following four treatment protocols: Group 1 Patients received 80% power (14.5 kV), which was achieved within 20 shockwaves (SWs), from the beginning to the end of treatment (control). Group 2 Patients received the first 100 shocks at 40% power (9.2 kV), followed by SWs at 80% power until the end of treatment (ramping protocol). Group 3 Patients received 100 shocks at 40% power, followed by a 3-minute pause and then additional SWs at 80% power until the end of treatment (ramping and pause protocol). Group 4 Patients received 100 shocks at 80% power, followed by a 3-minute pause and then additional SWs at 80% power until the end of treatment (pause protocol).
After the SW, patients were followed-up at 2 days, 6 and 12 weeks, and 6 months after treatment, and every 6 months thereafter until the 2-year point (Fig. 1). In addition to the parameters reported previously (e.g., treatment outcomes, urine markers of acute renal injury, adverse events), the following parameters were monitored throughout the 2-year follow-up to assess the long-term effects of these treatment protocols: 1. Procollagen III aminoterminal propeptide (PIIINP), a marker of renal fibrosis,
8,9
in spot urine samples (50 mL) collected during each follow-up. 2. Blood pressure and antihypertensive drug usage for hypertensive subjects (add-on therapy). 3. Serum creatinine level and modification of diet in renal disease–estimated glomerular filtration rate (MDRD-eGFR) at the end of the 2-year follow-up.
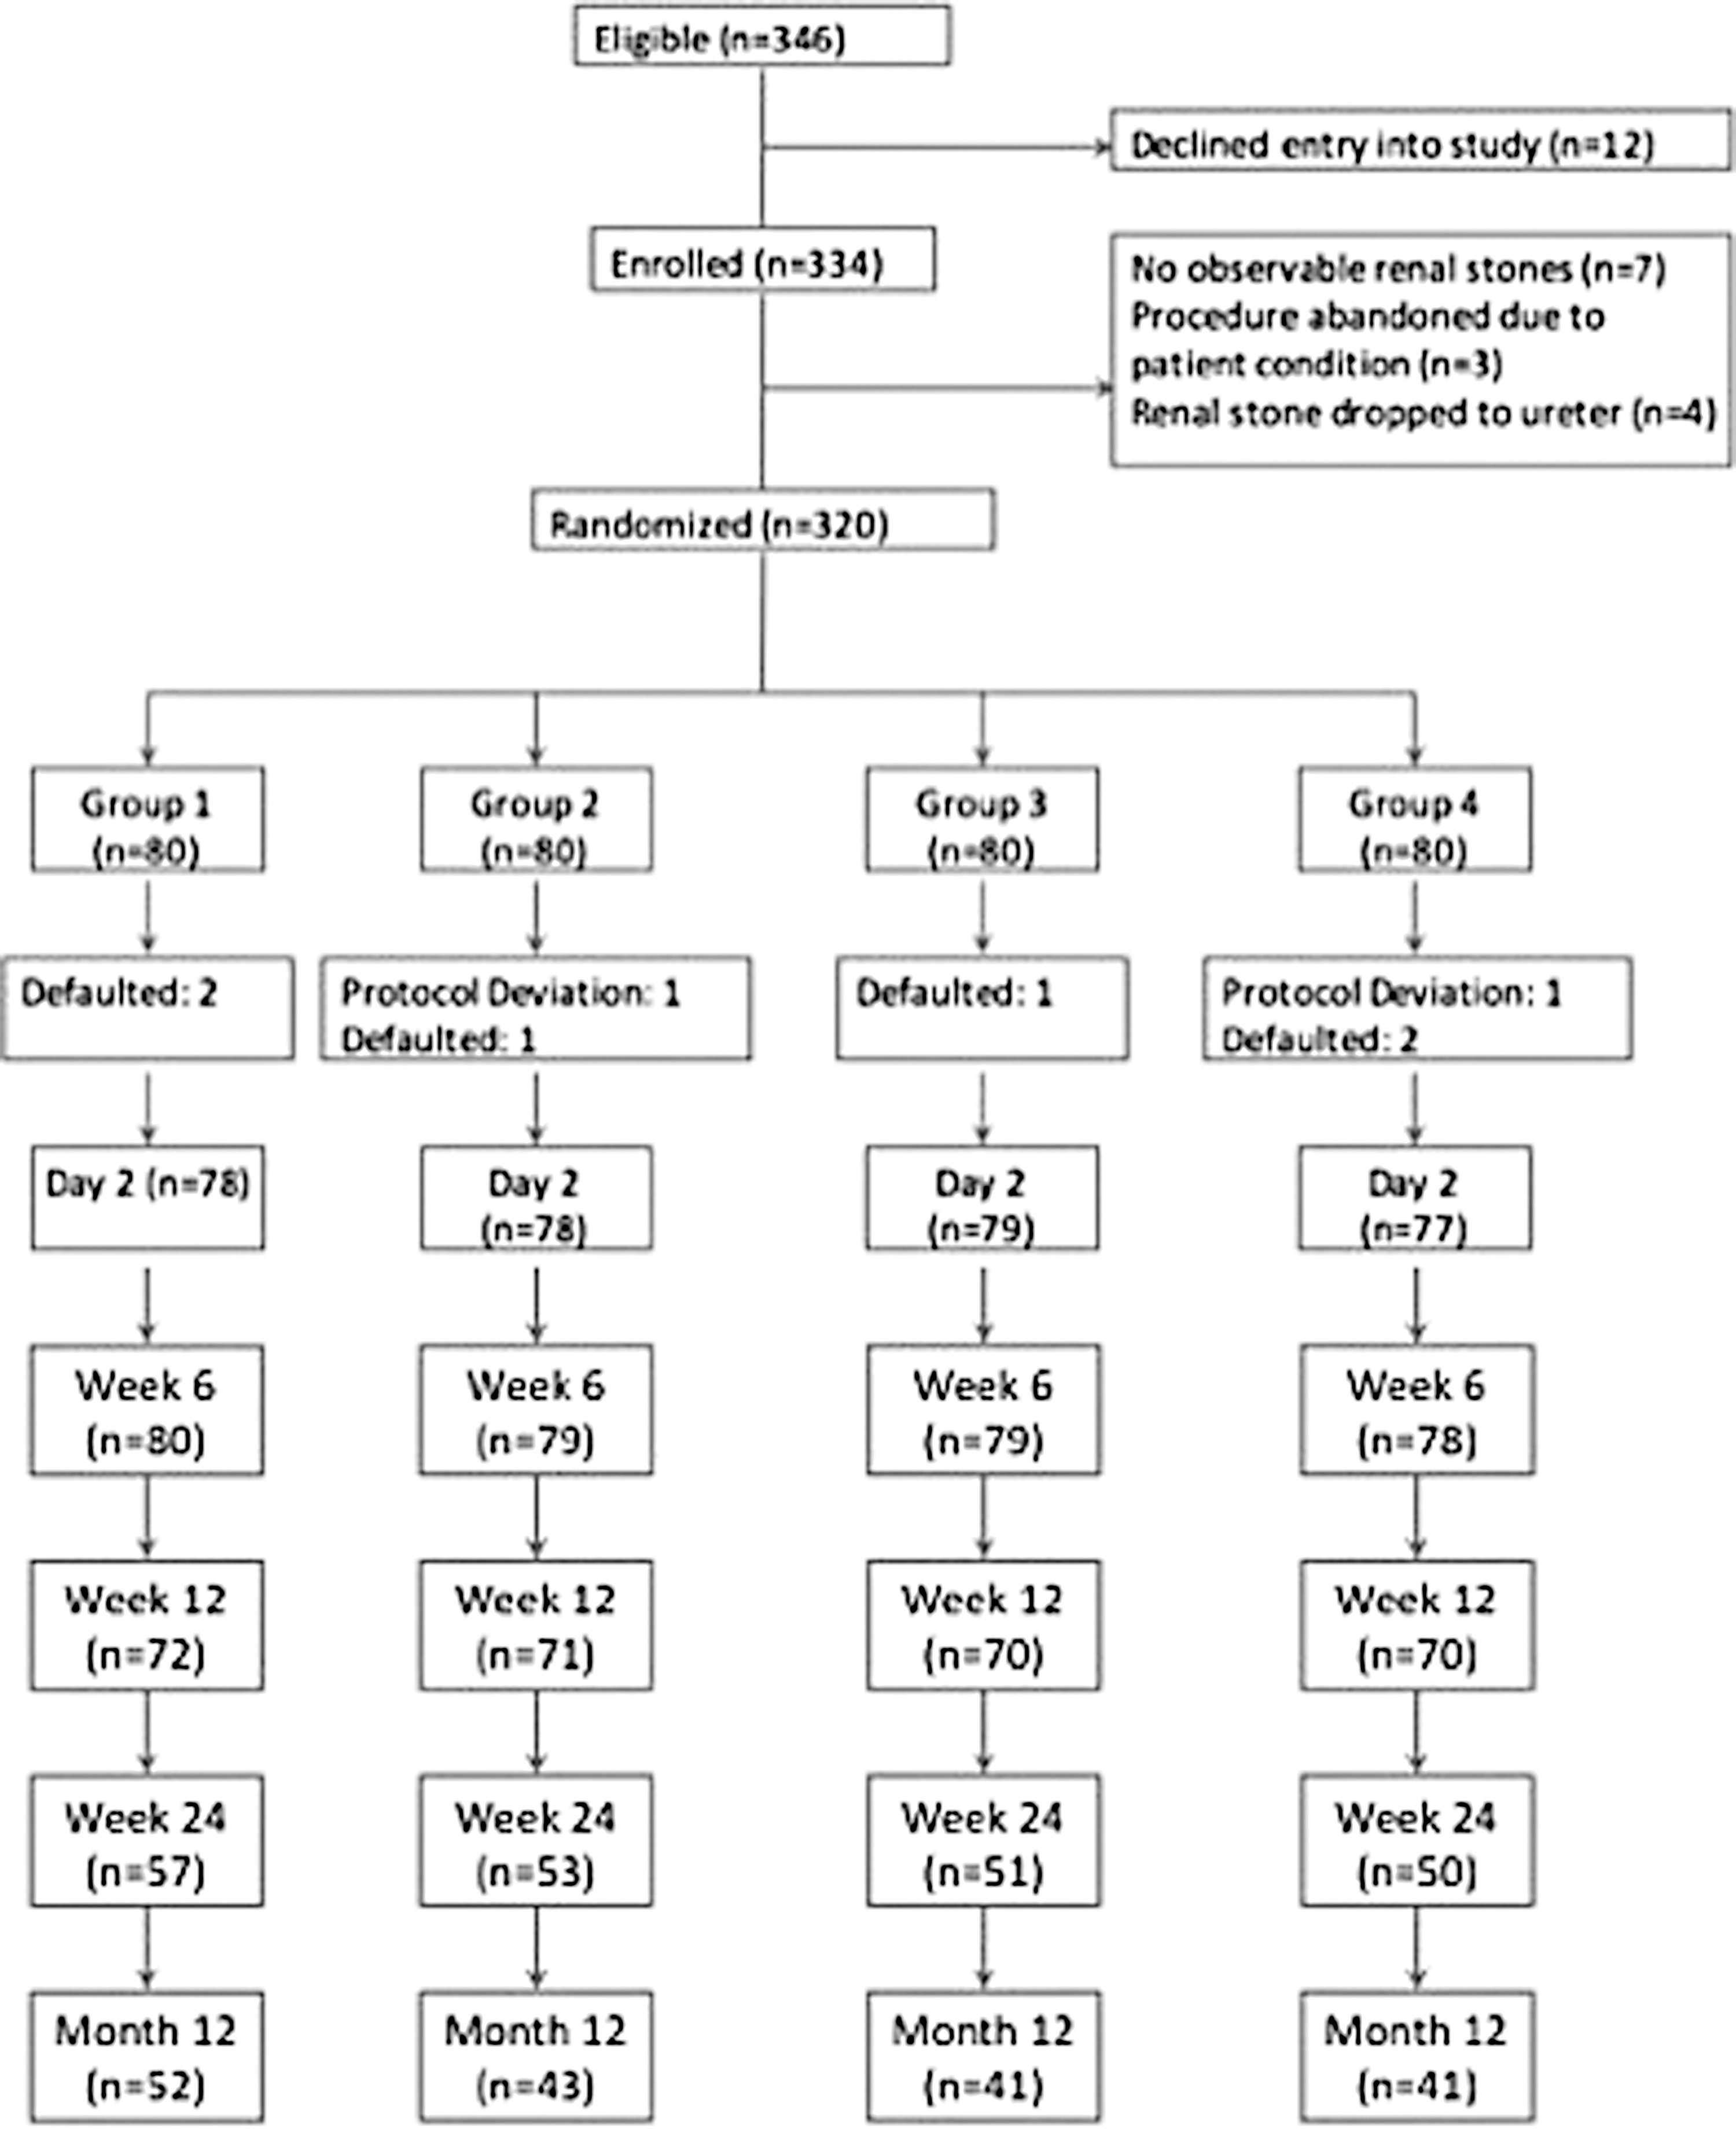
Patient flowchart.
MDRD-eGFR was calculated according to the four variable MDRD equation. 10 To assess renal fibrosis, the PIIINP levels were measured from pretreatment to 24 months post-treatment using a commercial enzyme-linked immunosorbent assay kit. The marker levels were expressed as ratios to urinary creatinine levels, which were measured using an automated analyzer. All measurements were performed in duplicate, and the mean value was used for analysis. All tests were performed by a single research staff member blinded to the clinical information.
Outcome assessment
The main outcome assessed in this part of the study was SWL-related renal fibrosis. The primary outcome was the changes in urine PIIINP levels for up to 2 years after one session of SWL. Other assessed outcomes included changes in the serum creatinine levels and in blood pressure control during the same period. For patients with no background history of hypertension, new-onset hypertension was defined as a persistently elevated blood pressure >140/90 mm Hg that required referral to a physician. For patients with known hypertension, worsening of blood pressure control was defined as the requirement for add-on therapy (i.e., change in the dosage/regime of antihypertensive agents) to address to inadequate blood pressure control.
Data treatment and statistical analysis
All analyses were performed using SPSS version 23.0 (SPSS, Inc., Chicago, IL). Treatment outcomes were analyzed using an intention-to-treat approach. Baseline and treatment parameters were compared using a one-way ANOVA for continuous variables and the chi-square test for categorical variables. Differences in the changes in urine marker levels and the incidence of worsening blood pressure control/new-onset hypertension after SWL among the different protocols were compared using linear and logistic regression analyses, respectively, adjusting for baseline values and other potential factors related to these changes. The adjusted odds ratios from the logistic regression models and their 95% confidence intervals are reported. A two-sided p-value <0.05 was considered statistically significant.
Results
Three hundred thirty-four patients were prospectively recruited for this study from January 2011 to July 2013. Fourteen patients were excluded because they did not fulfill the inclusion criteria. The remaining 320 patients were randomized to 1 of the 4 above-described groups (n = 80/group). Patients were preplanned to undergo follow-up for 2 years unless they decided to receive other modalities of stone treatment or otherwise defaulted from the follow-up (Fig. 1).
The patients' clinical characteristics, stone parameters, and treatment parameters were comparable among the four groups and have been reported in detail elsewhere (Supplementary Table S2). 5 Overall, 118 (36.88%) and 41 (12.81%) patients had histories of hypertension and diabetes, respectively. The overall mean serum creatinine level was 77.8 μmol/L (standard deviation = 19.8 μmol/L). The mean baseline urine PIIINP level (adjusted to the urine creatinine level) was 6.10 mg/mol, and no differences were observed among the four groups. A higher body mass index was associated with a higher baseline PIIINP level (Supplementary Table S3).
The overall treatment success rate, early post-treatment complication rate, and changes in urine acute renal injury marker levels were reported previously. 5 In brief, we observed no differences in these parameters or the post-treatment renal hematoma rate among the groups. Regarding the PIIINP levels, we observed significant increases from 6 weeks until 18 months after SWL in the whole study population and in individual groups (p < 0.05). PIIINP levels peaked at 1 year after SWL and gradually returned to the baseline levels at 2 years (Fig. 2a). The four treatment groups exhibited similar trends in these changes, and no significant inter-group differences were observed (Fig. 2b). Furthermore, no factors were found to predict the urinary PIIINP level at 1 year after treatment (i.e., peak level) (data not shown). We also observed there was no correlation between the presence of post-SWL hematoma and the peak level of PIIINP (data not shown).
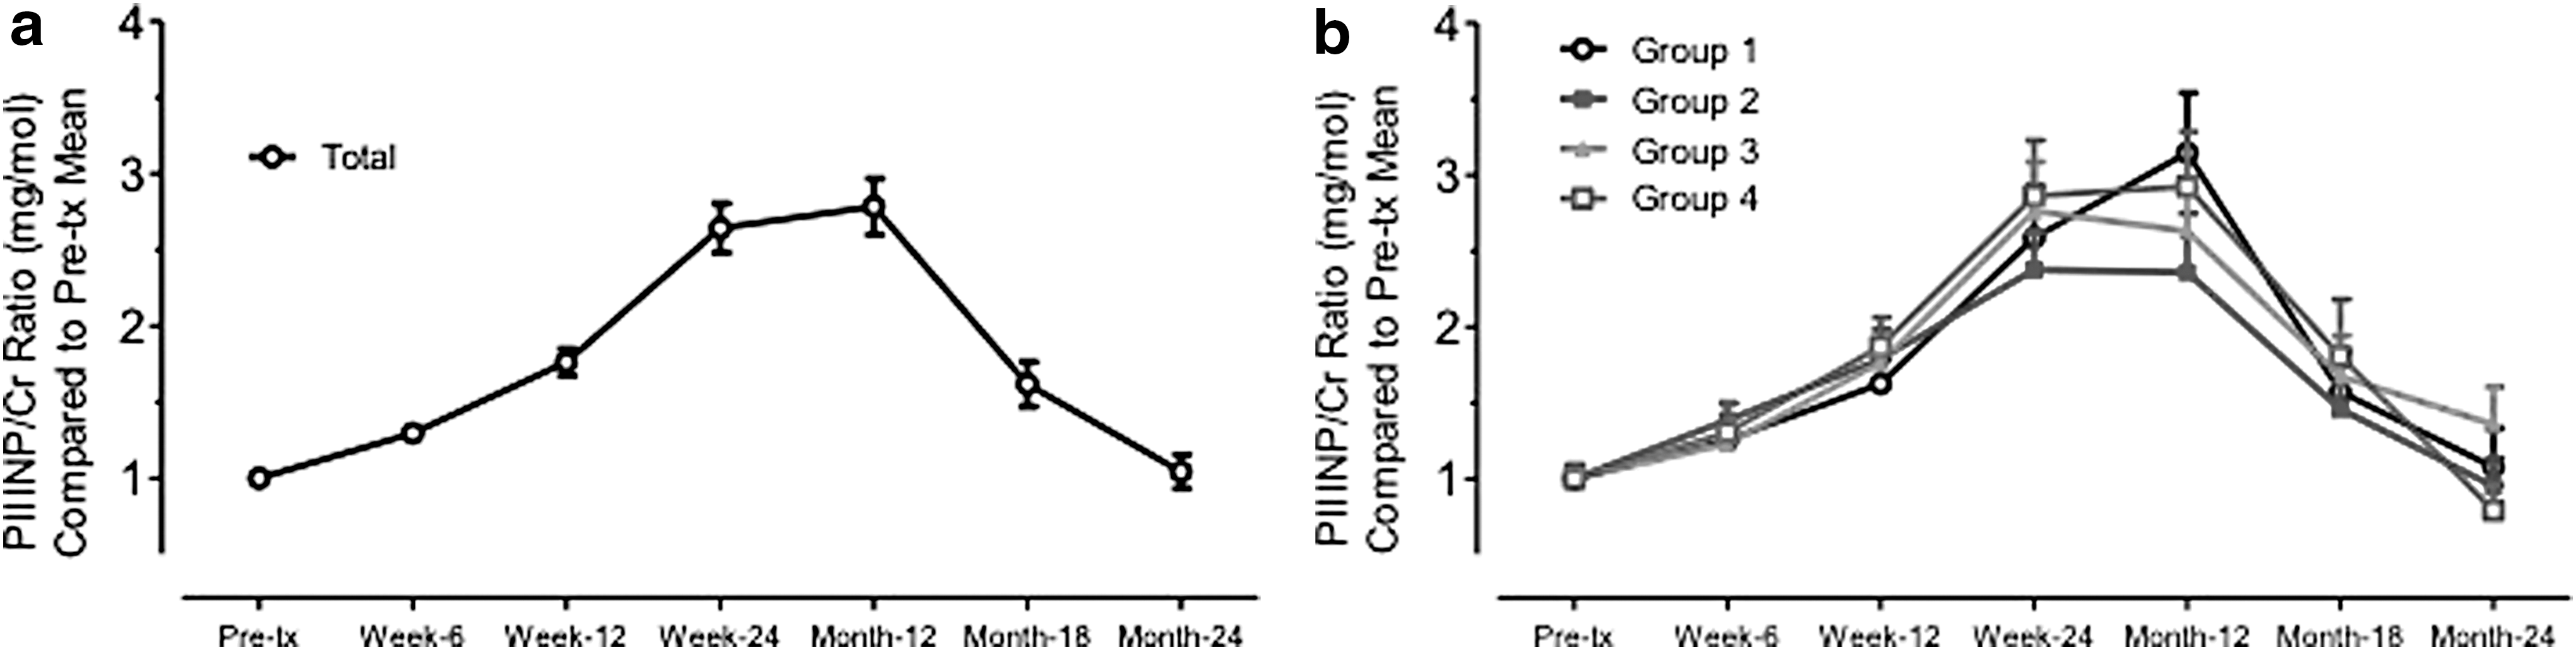
Mean changes in the PIIINP/creatinine ratio in
The overall serum creatinine levels were statistically significantly elevated, and MDRD-eGFR were significantly reduced at the 2-year follow-up (Table 1), and these changes were significant in all except for Group 2 (Ramping protocol). However, Group 2 still exhibited a trend suggestive of an elevation in the serum creatinine level (p = 0.064) and decrease in eGFR level (p = 0.075). In the multivariate analysis, only baseline eGFR level (p < 0.001) were associated with a significant decrease in eGFR level (Table 2), There were no inter-group differences regarding these changes in eGFR level. Nevertheless, the overall changes of serum creatinine level from 76.2 to 80.01 μmol/L might not be clinically significant. There was also no correlation between the maximum level of PIIINP and the absolute level and the change in eGFR at 2 years after treatment.
Serum creatinine levels (μmol/L) and eGFR (mL/min/1.73 m2) are presented as means (standard deviations). p-Values were calculated using a paired t-test.
MDRD-eGFR = modification of diet in renal disease–estimated glomerular filtration rate; SWL = extracorporeal shockwave lithotripsy.
CI = confidence interval; BMI = body mass index.
During the 2-year follow-up, 20 (9.95%) patients developed new-onset hypertension (Table 3), and 36.4% (n = 43) of patients with known hypertension at baseline experienced a worsening of blood pressure control and required increased dosages of antihypertensive agents. Again, no difference was observed among the different treatment groups. A multivariate analysis revealed that background histories of hypertension and diabetes were associated with the risk of worsened blood pressure control (either new-onset hypertension and or worsened hypertension control). Overall, age was not predictive of poorer hypertension control (Table 4). However, when only patients with known hypertension were analyzed, both age (p = 0.032) and a history of diabetes (p = 0.002) were associated with a worsening of blood pressure control (i.e., requirement for add-on therapy) (Table 5). Again there was no correlation between the presence of hematoma after SWL, as well as the maximum level of PIIINP and the occurrence of new onset or worsened hypertension (data not shown).
p-Value was calculated using the chi-squared test.
p-Value was calculated using Fisher's exact test.
BMI = body mass index.
Discussion
Although SWL remains a first-line treatment for urinary calculi, increasing concerns have been raised regarding potential complications related to this treatment. In this 2-year follow-up to a prospective randomized study of 320 patients treated with SWL, we observed a continuous increase in the urinary levels of the renal fibrosis marker PIIINP for up to 1 year after a single session of SWL, followed by a gradual returned to the baseline level at 2 years post-treatment. Approximately 20% of our patients experienced worsened blood pressure control, including new-onset hypertension (9.95%) and worsened hypertension control (36.4%). We also observed a statistically significant increase in the overall serum creatinine level at the end of the 2-year follow-up. These results suggest that SWL could have long-term effects on patients. Unfortunately, there was no difference observed in the four treatment groups. Therefore, neither the ramping nor pause protocol failed to minimize these changes. As a result, newer approaches, such as pretreatment with low energy shock for 300 to 500 shocks, were continually developed to meet this clinical need. 11
The repair process following acute renal injury could lead to renal fibrosis, 12 and therefore, a SWL-related injury could also lead to renal fibrosis. 1,13 Unlike animal studies, however, the approaches for assessing post-SWL renal fibrosis are limited. Although renal biopsies provide histological evidence of renal fibrosis and allow an assessment of severity, 14 the invasiveness of this procedure and the potential for sampling errors from a few biopsy sites have limited its clinical usage. Imaging studies, such as [99]TcDMSA scans, have also been used to determine the size and site of renal scarring after SWL. 15 Although imaging can provide a global view of the extent of renal fibrosis, the cost and availability have limited its clinical application.
Previous studies have measured PIIINP, a degradation product of collagen type III, to monitor various fibrotic process, including pulmonary injury and hepatic fibrosis. 16 PIIINP levels have also been used to monitor fibrosis in various renal conditions. 8,9 The level of PIIINP had also been shown to correlate with GFR, risk of developing end stage renal disase and also graft kidney survival. 9,17,18 PIIINP is an advantageous marker of renal fibrosis because its measurement is simple and convenient, and it can provide an overall view of fibrosis in the whole kidney after SWL. Therefore, we used PIIINP to quantitatively assess renal fibrosis after SWL in our cohort with the intent to continuously monitor and compare changes among different treatment protocols after one session of SWL. We found even one session of SWL resulted in a prolonged and sustained increase in the PIIINP level, which peaked at 1 year after SWL and only returned to the baseline level at ∼2 years after treatment. Again, we observed no difference in this parameter with respect to treatment approach, in agreement with the earlier assessment of acute renal injury. 5 Nevertheless, ours is the first study to demonstrate temporal changes in the renal fibrotic process after SWL. Our observation that the increase in renal fibrotic process might persist for more than 1 year and could require 2 years to return to the baseline level further supports concerns regarding the long-term effects of SWL on the kidneys. From the literature, higher PIIINP level was associated with decline in GFR level. From our study, we also observed a statistically significant decrease in GFR after 2 year follow-up. Since the elevation of PIIINP level could last for upto 2 years, there might be a possibility of cumulative elevation of PIIINP, in patients receiving repeated SWL. These prolonged fibrosis activity might lead to more significant long-term effects on the renal function of patients. Therefore, we suggest that these effects should not be overlooked especially in patients receiving repeated SWL. Regular monitoring of the renal function might be needed.
In our study, ∼20% of subjects experienced worsened blood pressure control during the 2-year follow-up period, including 20/202 (9.95%) previously nonhypertensive subjects who developed new onset hypertension. This observed incidence of new-onset hypertension was quite similar those in some reported series. 19,20 We did not include a nonintervention control arm, therefore we could not comment whether SWL would lead to worsening of blood pressure control. The literature includes multiple reports, including case series 21 –23 and hospital data analyses, 24 –26 of the development of new-onset hypertension after SWL. Unfortunately, most of those studies were retrospective and used different definitions of hypertension. Nevertheless, in a recent systematic review based on 30 studies, the author concluded that there was no strong evidence to support a causative role for SWL in hypertension. 27 Still, the high incidence of worsening blood pressure control, including 43 (36.4%) of 118 hypertensive subjects who required add-on antihypertensive therapies, was alarming. Because most studies have focused on the development of new-onset hypertension, our observation provides supplementary information about the potential effects of SWL on preexisting hypertension. In the literature, the average annual incidence of add-on pharmacotherapy among local hypertensive patients was 4.71% to 6.41%. 28 Therefore, our add-on therapy rate of 36.4% during the 2-year follow-up was much higher than that in the general population. However, as we did not have a nontreatment arm for comparison, further studies would be helpful to assess the effect of SWL on blood pressure control in existing hypertensive patients.
Notwithstanding the importance of these findings, our study had some limitations. In our initial plan, we aimed to compare the effects of the ramping and pause protocols on renal injury after SWL. Therefore, we did not include a noninterventional control arm for comparison and could not conclude whether the worsened blood pressure control and increased serum creatinine levels were attributable solely to SWL or to other processes, such as aging. Since patients with hypertension would have regular follow-up by physicians, this might increase the chance of detection of worsening blood pressure control than nonhypertensive patients (detection bias). Moreover, when monitoring urine PIIINP levels, we assumed that the subjects were not experiencing other inflammatory processes that would also affect the marker level. Certainly, however, some patients might have developed other conditions that could have affected the PIIINP levels during the 2-year follow-up. Nevertheless, we hope that the relatively large number of subjects would help to overcome this limitation and note that the temporal changes in PIIINP levels were quite consistent among different treatment groups, and in the overall sample. Finally, as our initial study was planned to assess the post-SWL hematoma rate and therefore, the sample size planned might not have enough power to detect the difference between the four treatment groups. However, even though there was a difference between the groups, the difference was likely not clinically significant, based on the current data.
Conclusion
In this prospective randomized study, we observed that SWL led to a significant increase in the urinary levels of the renal fibrosis marker PIIINP for up to 18 months after treatment, suggesting that SWL might have a prolonged effect on the kidneys. We also observed a significant increase in the overall serum creatinine levels at 2 years after SWL. Furthermore, 20 (9.95%) patients developed new-onset hypertension and 43 (36.4%) experienced worsened blood pressure control. However, we observed no protocol-related differences in the changes in renal fibrosis marker levels or serum creatinine/eGFR levels and the incidence of worsened blood pressure control. Therefore, we recommend blood pressure monitoring of patients undergoing SWL, especially those with preexisting hypertension, to avoid overlooking a negative change in blood pressure control. We also encourage the search for better approaches to minimize the long-term effects of SWL on patients.
Footnotes
Acknowledgment
The study was supported by the Hong Kong RGC General Research Fund (Grants 472111 and 14113515) of the Research Grants Council, Hong Kong.
Author Disclosure Statement
No competing financial interests exist.
Abbreviations Used
References
Supplementary Material
Please find the following supplemental material available below.
For Open Access articles published under a Creative Commons License, all supplemental material carries the same license as the article it is associated with.
For non-Open Access articles published, all supplemental material carries a non-exclusive license, and permission requests for re-use of supplemental material or any part of supplemental material shall be sent directly to the copyright owner as specified in the copyright notice associated with the article.
