
Abstract
Objective:
To investigate the correlation between fluid dynamic processes and deposition of encrusting particles in ureteral stents.
Materials and Methods:
Microfluidic models (referred to as “stent-on-chip” or SOC) were developed to replicate relevant hydrodynamic regions of a stented ureter, including drainage holes and the cavity formed by a ureteral obstruction. Computational fluid dynamic simulations were performed to determine the wall shear stress (WSS) field over the solid surfaces of the model, and the computational flow field was validated experimentally. Artificial urine was conveyed through the SOCs to measure the temporal evolution of encrustation through optical microscopy.
Results:
It was revealed that drainage holes located well downstream of the obstruction had almost stagnant flow and low WSS (average 0.01 Pa, at 1 mL/min), and thus suffered from higher encrustation rates. On the contrary, higher levels of WSS in holes proximal to the obstruction (average ∼0.04 Pa, at 1 mL/min) resulted in lower encrustation rates in these regions. The cavity located nearby the obstruction was characterized by high levels of encrustation, because of the low WSS (average 1.6 × 10⁻⁴ Pa, at 1 mL/min) and the presence of flow vortices. Increasing the drainage flow rate from 1 to 10 mL/min resulted in significantly lower deposition of encrusting crystals.
Conclusion:
This study demonstrated an inverse correlation between deposition of encrusting bodies and the local WSS in a stented ureter model. Critical regions with low WSS and susceptible to encrustation were identified, including “inactive” side holes (i.e., with minimal or absent flow exchange between stent and ureter) and the cavity formed by a ureteral occlusion. Findings from this study can open new avenues for improving the stent's design through fluid dynamic optimization.
Introduction
U
Since the introduction of the double-pigtail ureteral stent by Finney in 1978, 4 the stenting technology has undergone several developments. 5 However, stents still suffer from failures, and the associated morbidities and complications significantly affect a patient's quality of life and cause financial burden on national healthcare services. 5 Incidence of these failures depends on several factors including indwelling time, patients' fluid intake, urinary stasis for extrinsic compression, and access to healthcare. Encrustation and biofilm formation over the stent surface have been identified as primary determinants of stents' failure, with incidence rates of 58% and 28%, respectively. 6 Although studies have been conducted to identify or develop materials and surface coatings inhibiting encrustation and bacterial adhesion, the dominant processes governing encrustation dynamics in ureteral stents are still not entirely clear. 7,8 Among these, fluid dynamic processes have been largely overlooked although earlier theoretical studies have suggested that they may play a significant role on the initiation and growth of encrustation. 9
This study attempts to fill this knowledge gap. It is herein hypothesized that encrustation rates are strongly correlated with specific flow metrics called wall shear stress (WSS). In particular, it is argued that low and high levels of WSS are correlated with high and low encrustation rates, respectively. To test this hypothesis, “stent-on-chip” (SOC) models were developed and employed to generate flow fields that resemble, in some measure, those encountered in a “stented ureteral system.” Artificial urine (AU) was run into the SOCs and encrustation deposits (mainly in the form of crystals) were monitored over time. A computational fluid dynamic (CFD) model replicating the experiments was then implemented to compute WSS, so that it was possible to spatially correlate WSS with the experimentally observed encrustation maps, thus allowing the identification of regions prone to encrustation.
Materials and Methods
SOC models: design rationale
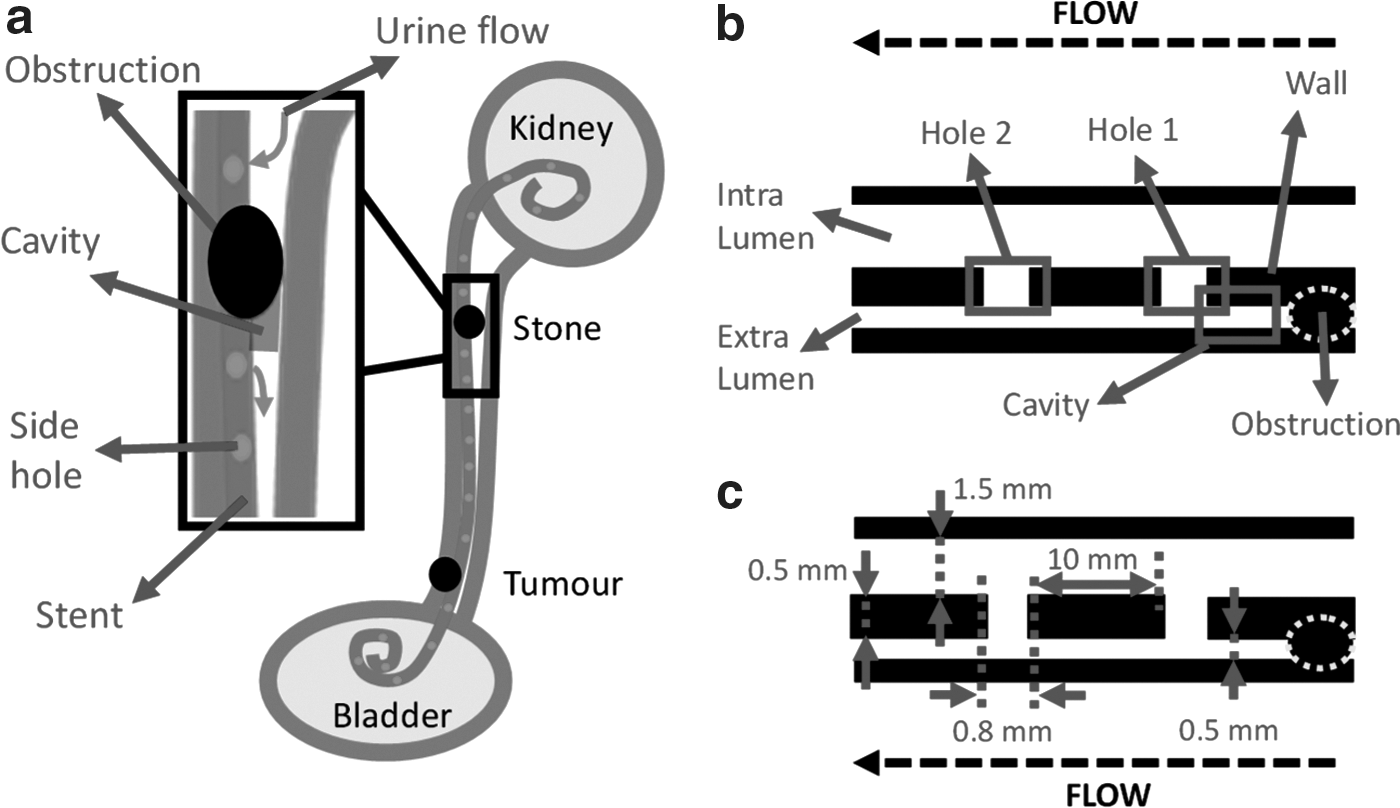
SOC models were designed to replicate relevant flow domains of a stented and occluded ureter, including: (1) A large (1.5 mm wide) and a narrow (0.5 mm wide) channel, replicating the intra- and extraluminal compartments of a ureteral stent, respectively. Channels were separated by a 0.5-mm thick wall, mimicking the stent's wall. (2) An obstruction (or cavity), replicating an occlusion of the ureter lumen caused by either a ureteral stone (intrinsic obstruction) or a tumor (extrinsic obstruction). A proximal complete occlusion of the ureter lumen was modeled (ureter diameter at the occlusion site = 2.5 mm). Notably, earlier studies using full-scale models of a stented and occluded ureter observed typical features of cavity flow (including formation of laminar vortices), nearby a complete ureteral occlusion.
10
We will thus refer to this specific flow domain as “cavity” or “occluded cavity” from herein. (3) Two drainage holes (0.8 mm wide), proximal (hole 1) and distal (hole 2) to the obstruction.
The mentioned dimensional characteristics of SOC models were defined to replicate those of commercial Double-J stents (Cook® Medical), as illustrated in Figure1a to c. Two cylindrical chambers (5 mm in diameter) were also designed as inlet and outlet reservoirs in the SOCs.
The total width and length of the microfluidic device were limited to 50 and 70 mm, respectively (Fig. 2a), so that it could fit onto a microscope stage to monitor flow and encrustation processes in situ. Moreover, the length of the stent compartment at the inlet side of the device was defined to be greater than the entrance length (Le ), allowing the flow to fully develop before reaching side hole 1. Le was determined from 0.06 × Re × Dh , where Dh and Re correspond to the channel's hydraulic diameter and Reynolds number, respectively. The Reynolds number is defined as ρVDh/μ, where ρ, μ, and V correspond to the fluid density, dynamic viscosity, and mean velocity, respectively. The mean velocity was determined from the ratio between the volumetric flow rate (Q) and the inlet channel's cross-sectional area. Values of inlet volumetric flow rate investigated in this study were in the range 0.1 to 20 mL/min, following a previous study by Tofft and colleagues. 11
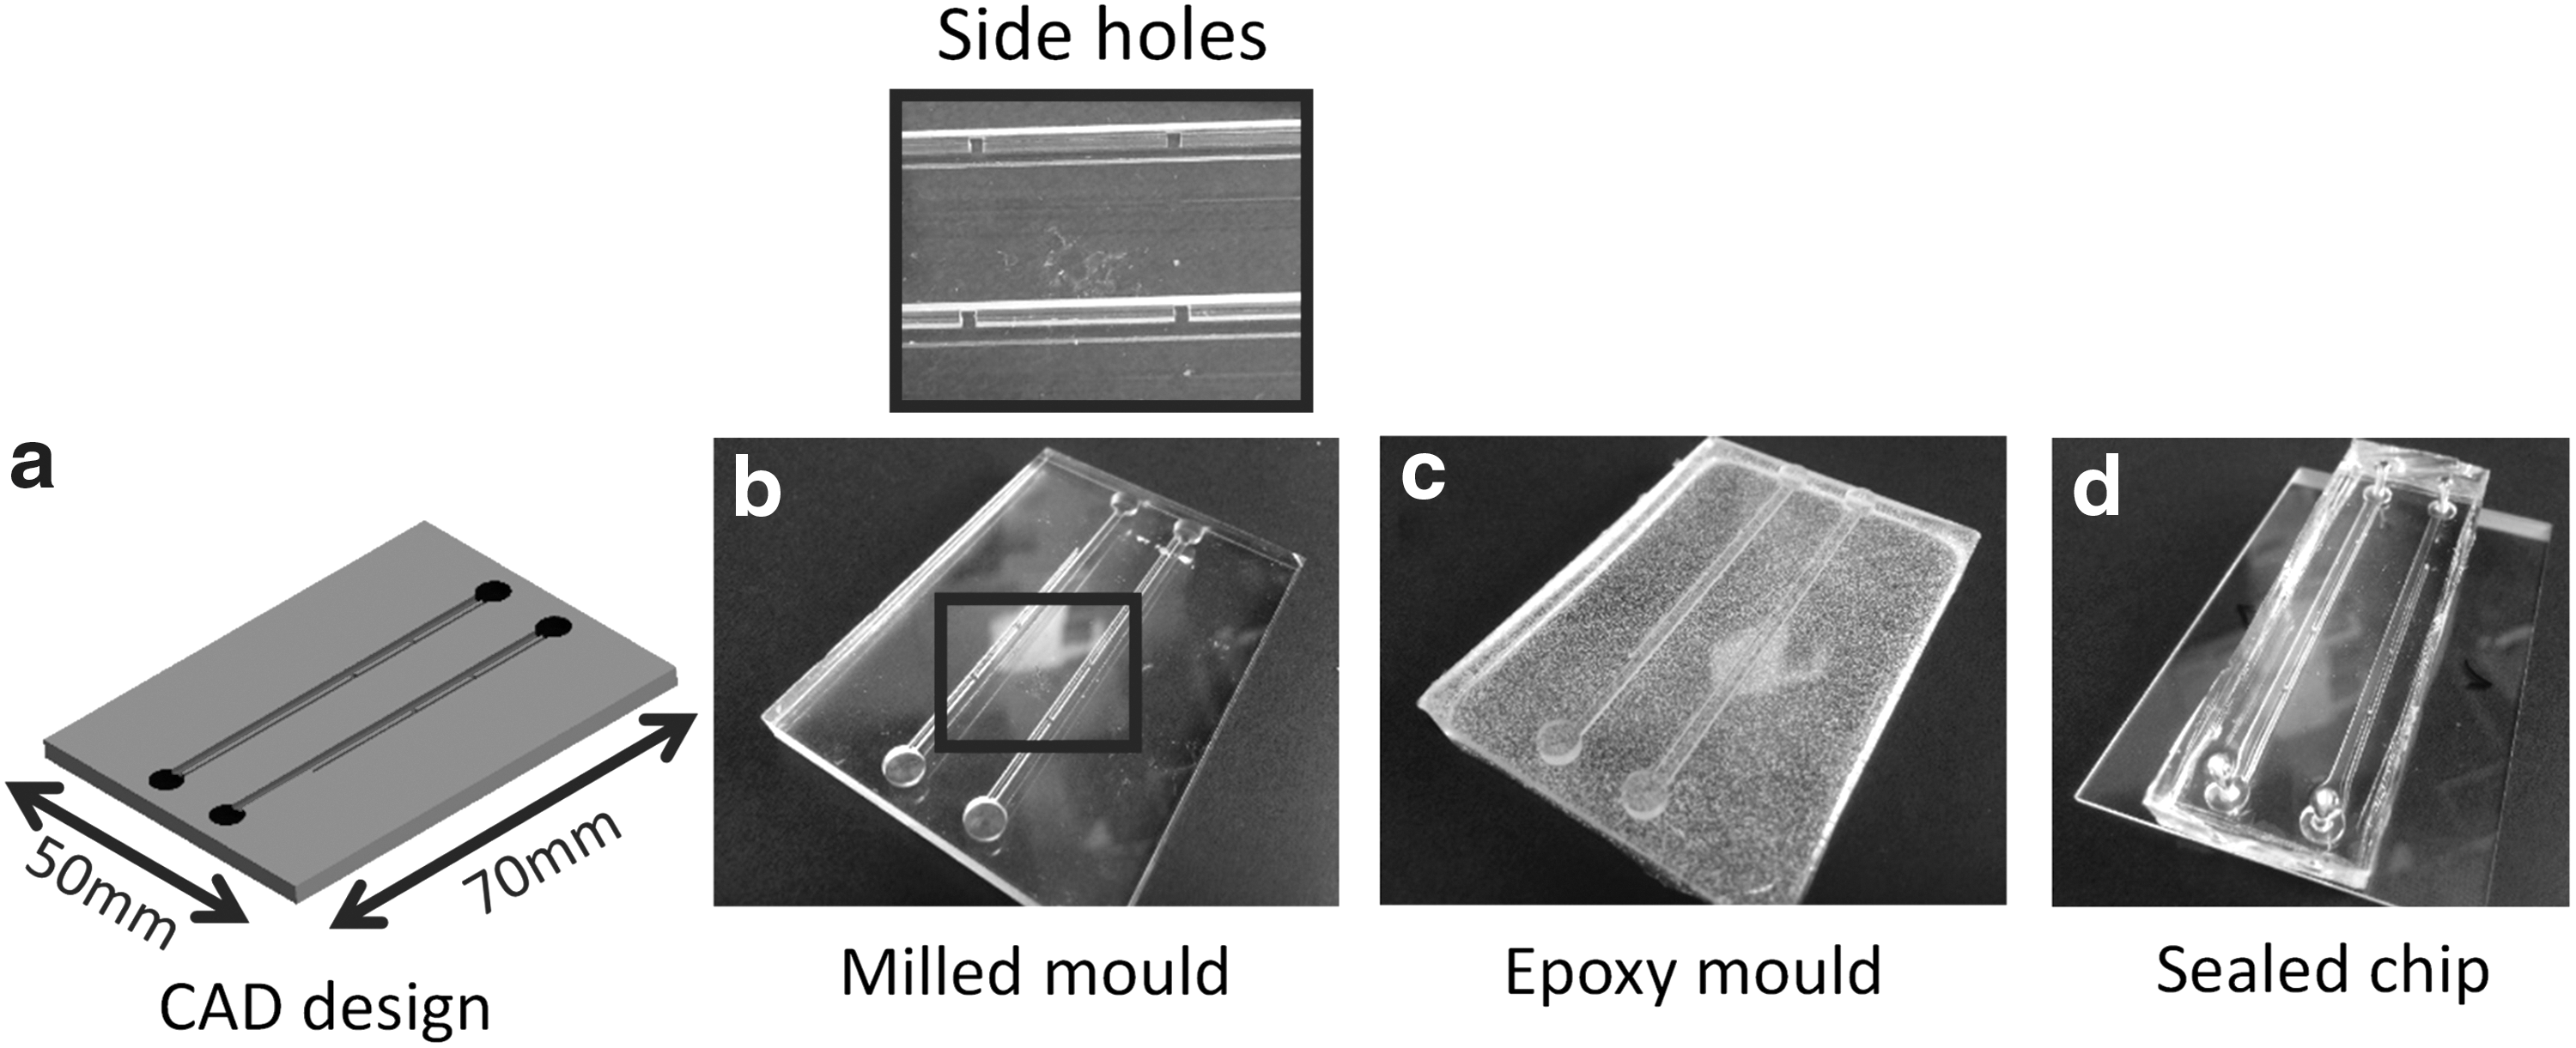
Combined micromilling replica molding process employed to fabricate SOC models. Images show
Although SOC models fail to make an exact replica of a stented ureter, they do capture relevant flow features, including a laminar vortex in the cavity formed by the obstruction and the lateral drainage through side holes (Fig. 1b, c). Furthermore, they provide an hydrodynamically rich environment—particularly in terms of its WSS field—which includes both regions of low and high WSS. Thus they represent a useful investigational tool that, while maintaining the essential flow features encountered in stented ureteral systems, also allows for high-resolution mapping of encrustation rates at key hydrodynamic regions of interest.
SOC models: fabrication protocols
SOC models were fabricated using a cost-effective technique described earlier, which combines micromilling with replica molding. 12 The fabrication process comprised the following steps (Fig. 2): (1) computationally assisted design (CAD) of the model geometry using SolidWorks (Dassault Systèmes Solidworks Corp.) (Fig. 2a). (2) Generation of a negative mold by micromilling of the model architecture into a layer of poly(methyl methacrylate) (PMMA) (Fig. 2b). (3) Pouring of a liquid epoxy resin (yellow dual cartridge; RS Components Ltd., at 1:1 weight ratio between components) on the negative mold. (4) Curing of the epoxy layer at room temperature (∼21°C, for ∼100 minutes), and removal from the PMMA negative mold (Fig. 2c). This layer contained a positive replica of the SOC architecture (positive mold). (5) Pouring of liquid poly(dimethylsiloxane) (PDMS; Sylgard® 184; Dow Corning Corporation) over the positive mold. PDMS was produced at a curing agent–monomer ratio of 1:10 (by weight), degassed using a vacuum chamber, and then cured overnight at ambient temperature. (6) Removal of the cured PDMS layer from the positive mold, and bonding to a 1-mm thick glass layer (Corning® microscope slides; Sigma-Aldrich) by plasma treatment (Tepla300; Oxford Instrument). A photograph of a finished SOC model is shown in Figure 2d.
Simulation of the flow field
CFD simulations were performed to characterize the flow field within SOC models. The simulated boundary conditions and fluid physical properties replicated the experimental ones. Simulations were performed at varying inlet volumetric flow rates, in the range 0.1 to 20 mL/min. In designing the numerical mesh, particular attention was devoted to accurately resolve the WSS distribution over the modeled solid surfaces. Additional details relating to the methods employed for model construction and numerical simulation are reported in Supplementary section S1 in Supplementary Data (Supplementary Data are available online at
Experimental characterization of flow and encrustation processes
In these experiments, the SOC model was placed horizontally over the microscope stage, to allow for optical access into the microfluidic channels.
Flow observation experiments were performed to qualitatively validate the simulated flow field. Fluorescent tracer beads (5.6 μm in diameter) were suspended in the fluid medium, and microscope images were acquired to reveal flow streamlines at selected locations within the SOC model. Further details about this method are reported in Supplementary section S2 in Supplementary Data.
Experiments were also conducted to quantify the formation of encrusting deposits. A supersaturated AU was employed to investigate deposition and growth of encrusting crystals. The surrogate fluid was produced following a protocol designed by Brooks and Keevil, 13 with minor modifications. Individual chemical constituents are reported in Supplementary Table S1 and were purchased from Sigma-Aldrich. The AU solution was prepared at 37°C and under continuous stirring; it had a pH of 6.8, and was kept at 37°C during experimentation.
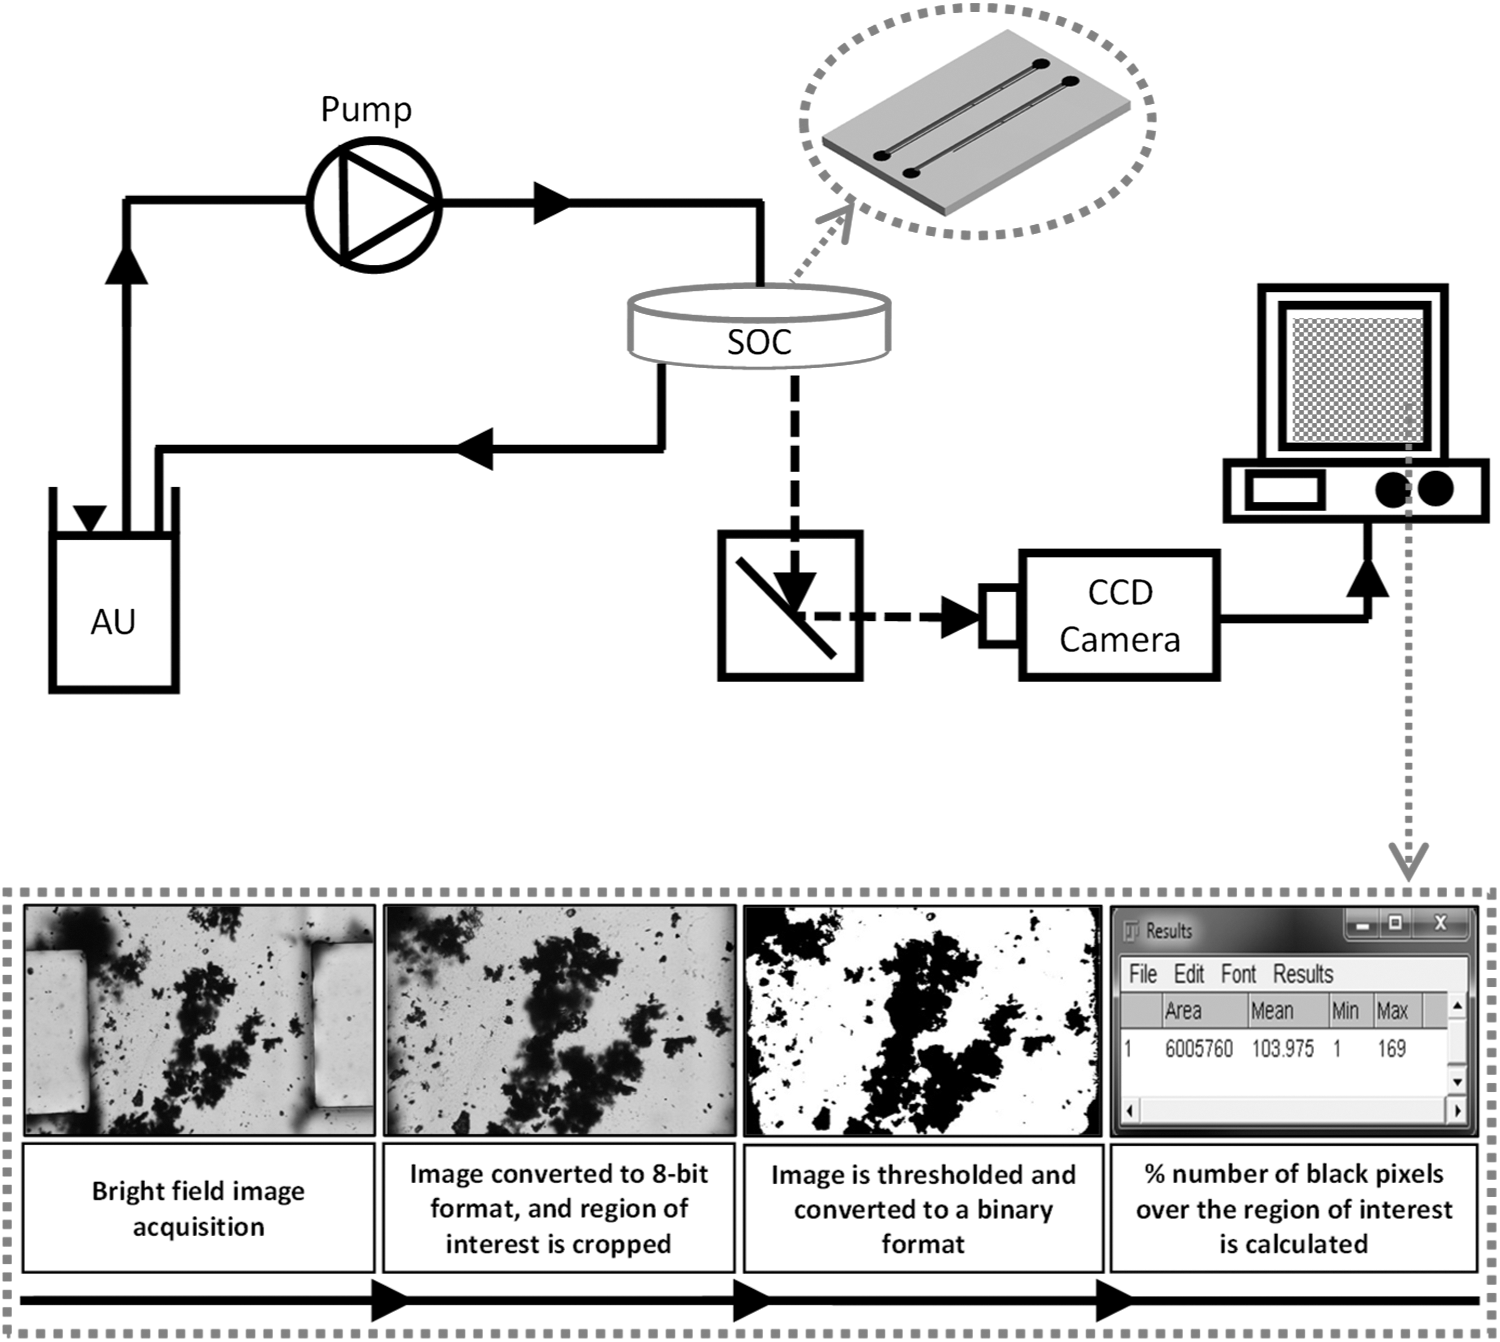
Experiments were performed at inlet flow rates of 1 and 10 mL/min, 10,11,14 and five independent repeats were performed at each flow rate. In each experimental run, AU was pumped into the microfluidic device for up to 90 minutes (Fig. 3), and microscope images were acquired at intervals of 15 minutes, using a charge-coupled device (CCD) camera (exposure time = 1 millisecond). Further details about the experimental setup and protocols are reported in Supplementary section S3 in Supplementary Data. Image J (NIH) was employed to process the microscope images and quantify the time evolution of encrustation at selected locations within the device (Fig. 3). The image processing protocols are also described in Supplementary section S3 in Supplementary Data.
Statistical analysis
A paired two sample t-test was performed to evaluate statistical differences between group means using Microsoft Excel 2013 (Microsoft Corporation). The significance level was set to 0.05 (i.e., differences were considered to be statistically significant if p < 0.05).
Results
Experimental validation of the simulations
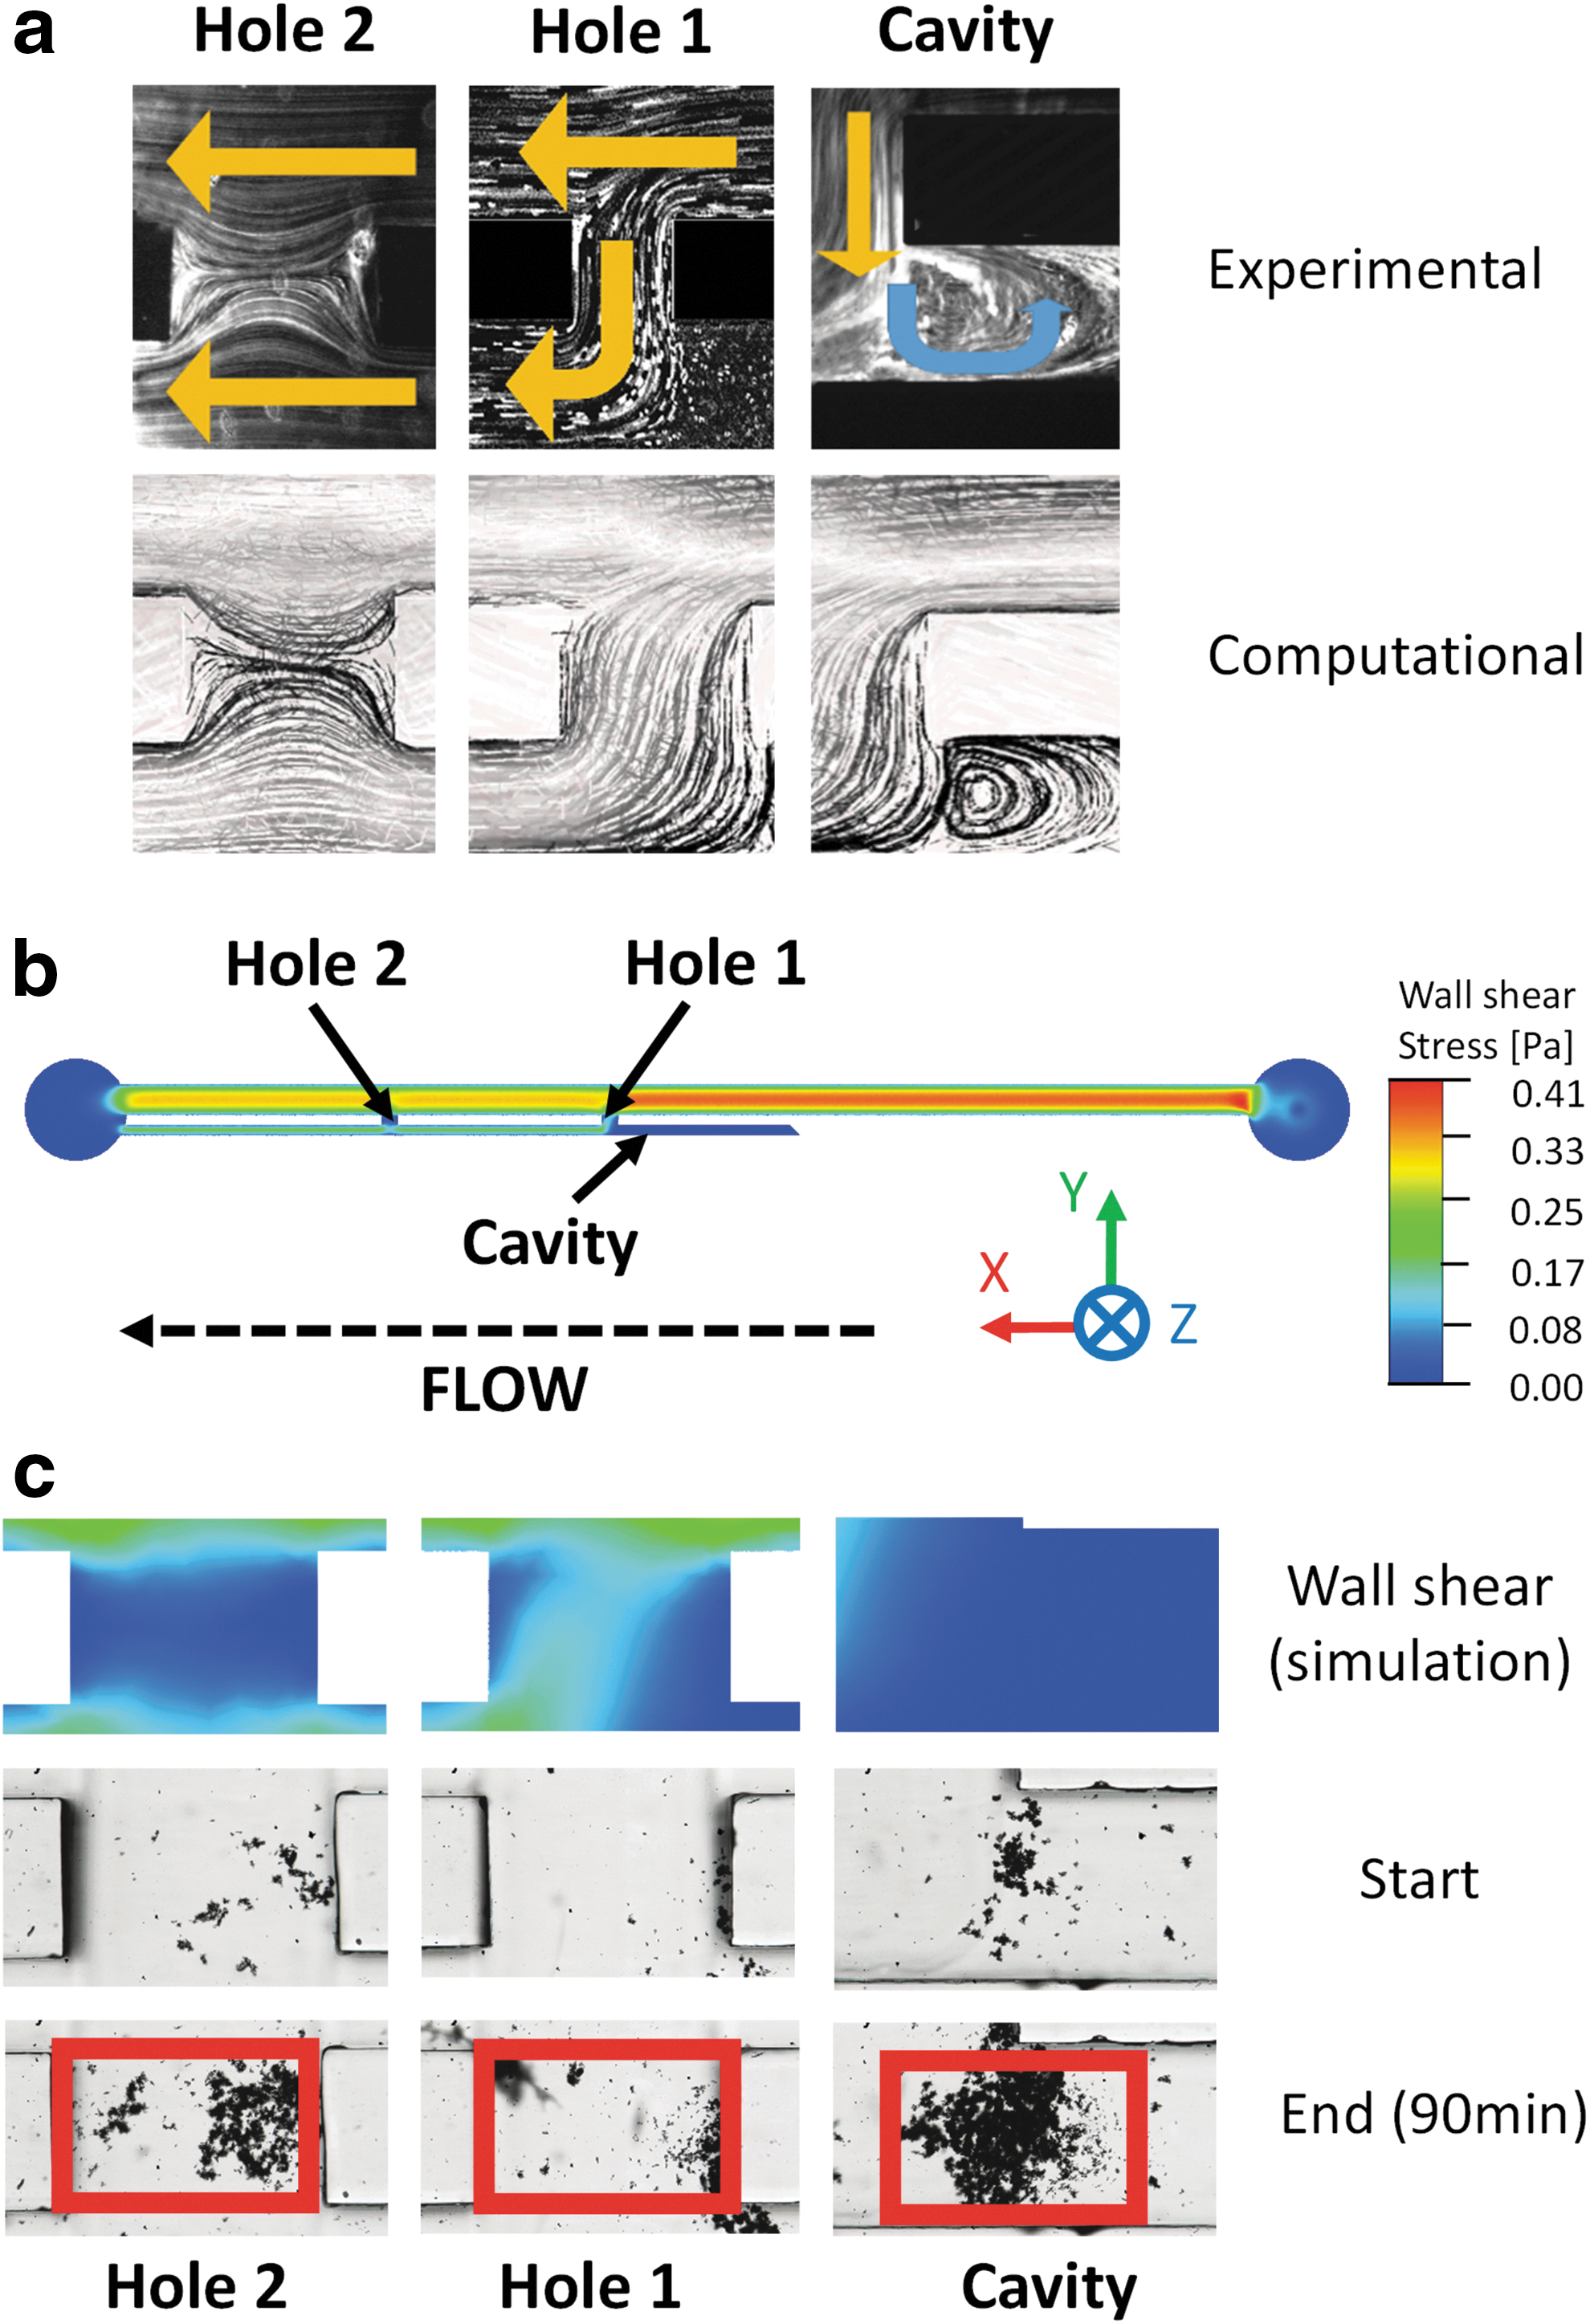
Figure 4a shows a comparison between the experimental and simulated (computational) flow streamlines at three regions of interest within the model. All experimental repeats showed strong qualitative agreement with the numerical simulations in describing the flow field in both proximal and distal side holes and the occluded cavity.
WSS influences formation and growth of encrusting deposits in stents
Simulations revealed the spatial distribution of WSS over the solid surfaces of the modeled SOCs. The contour of WSS over the bottom wall is shown in Figure 4b and c. Hole 2 (i.e., located well downstream of the obstruction) represents a fairly stagnant flow region and is, therefore, characterized by low WSS (average WSS = 0.010 Pa). On the contrary, in hole 1 (i.e., right in proximity to the obstruction), the flow diversion caused by the obstruction imposes higher levels of WSS (average WSS = 0.038 Pa). The occluded cavity, where the laminar vortex was observed, is also characterized by low levels of WSS (average WSS = 1.6 × 10⁻⁴ P3). It is, therefore, anticipated that regions potentially susceptible to the formation and growth of encrusting bodies include side holes of the stent interested by negligible intercompartmental flow exchange (i.e., hole 2) and the cavity formed by the obstruction.
This is confirmed in Figure 4c, which shows accumulation of encrusting deposits within side holes and the occluded cavity, at an inlet flow rate of 1 mL/min (up to 90 minutes). As anticipated, on the one hand, the side hole characterized by low WSS (hole 2) suffered from significant deposition of encrusting bodies. On the other hand, the side hole characterized by higher levels of WSS (hole 1) had a much lower degree of encrustation than hole 2. Notably, encrustation appeared to grow unevenly within a single side hole, with lower shear stress regions characterized by greater encrustation rates (see Fig. 4c for direct comparison between WSS and encrustation maps). The occluded cavity, characterized by low WSS, also experienced significant accumulation of encrusting bodies.
Figure 5 shows a more quantitative analysis of encrustation, as it shows its time evolution within the stent side holes and the occluded cavity, measured from the microscope images as percentage area covered by encrusting deposits. The area used for the calculation of the encrustation rate was 500 × 800 μm (height × width), and is shown in Figure 4c by red boxes. Figure 6a instead shows the mean percentage encrusted area after 90 minutes at different regions of interest, and for both 1 and 10 mL/min inlet flow rates. Values are reported as average ± standard deviation, and are compared for statistical significance.
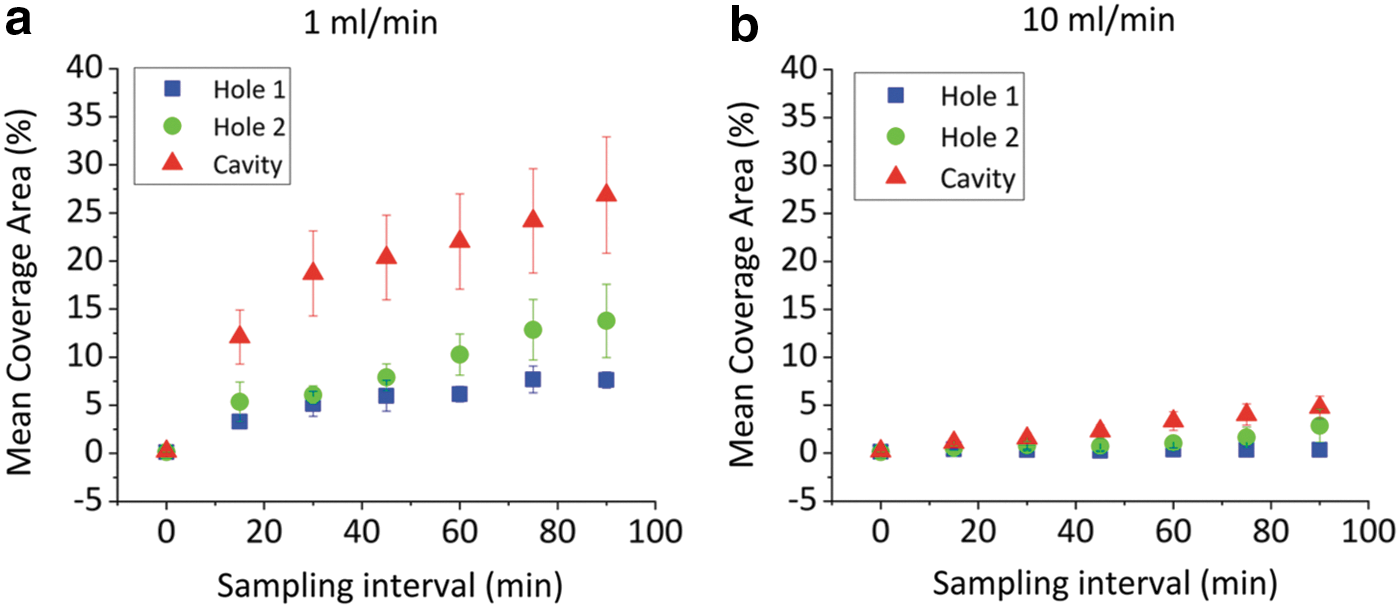
Time evolution of the percentage area covered by encrustation at specific regions of interest within the SOC models (side holes and cavity). Results are reported for inlet flow rate of
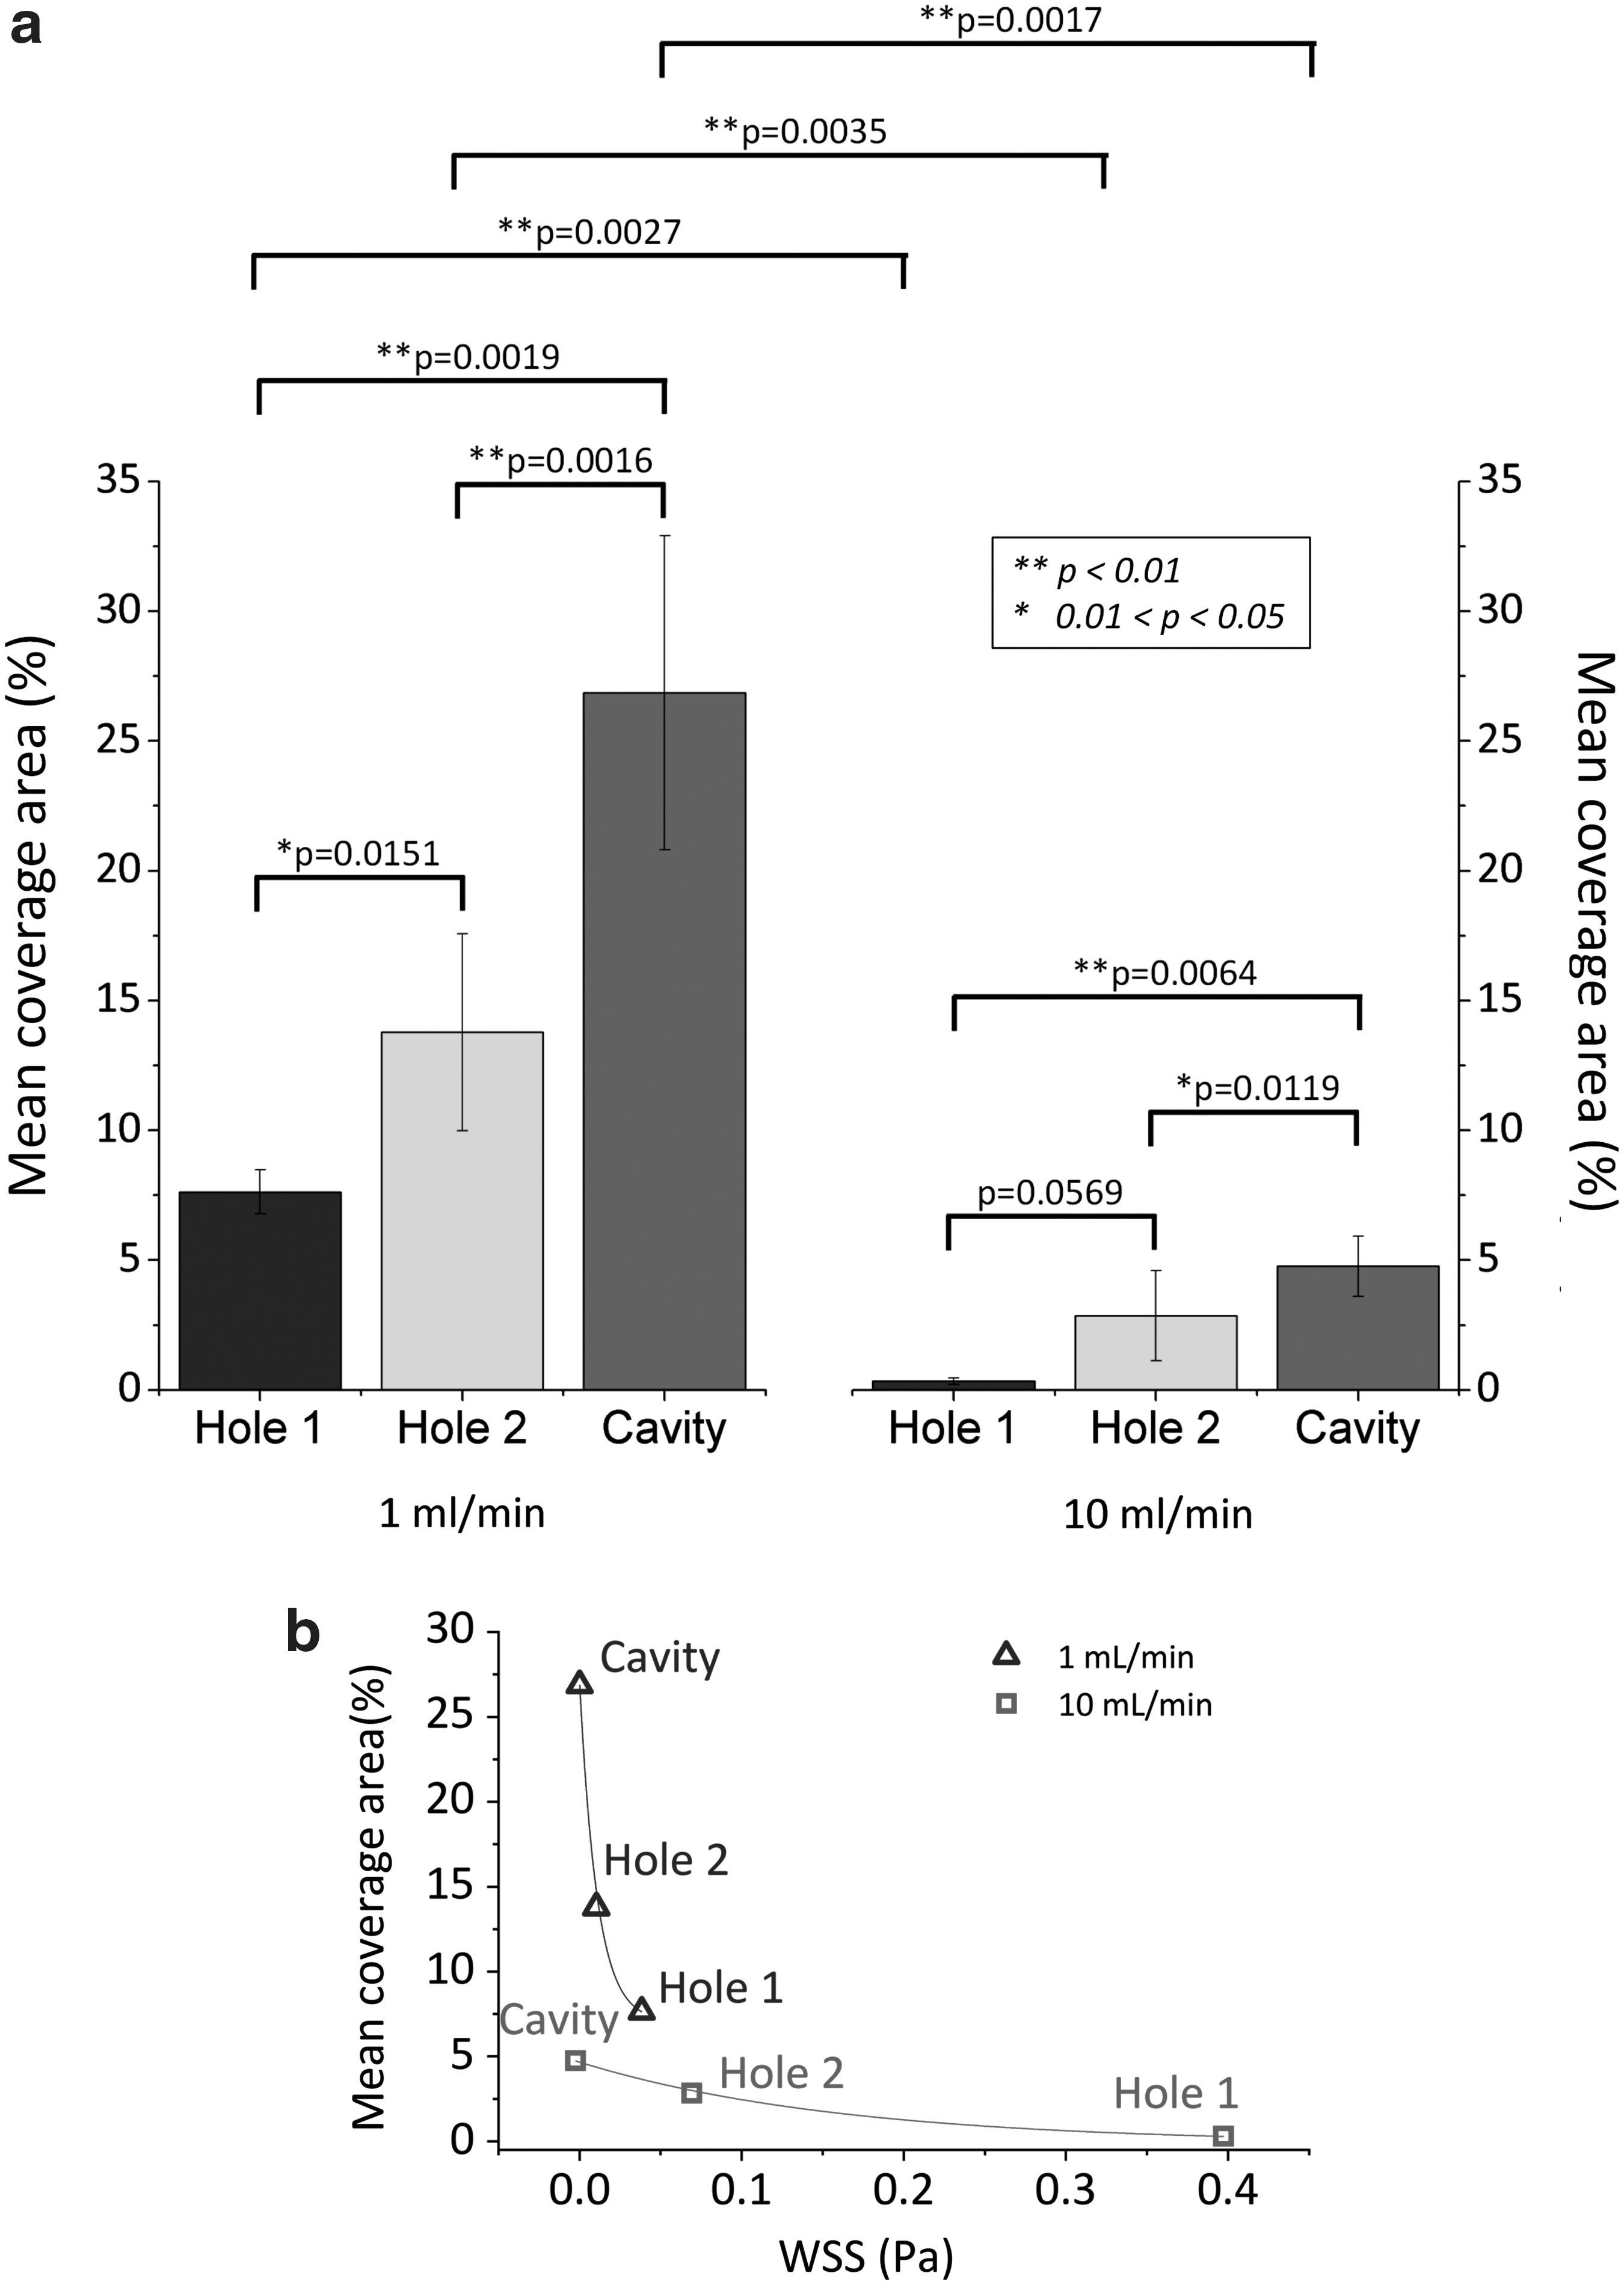
At 1 mL/min, hole 1 had a lower coverage area than hole 2 (Fig. 5a), which was characterized by lower WSS. The mean percentage coverage area after 90 minutes was equal to 7.6% ± 0.8% (hole 1) and 13.8% ± 3.8% (hole 2), respectively, and their difference was statistically significant (p < 0.05, Fig. 6a). The growth rate of encrustation in hole 1 (0.076/min) was also significantly lower than that in hole 2 (0.143/min). The cavity region was characterized by significantly high coverage area (Fig. 5a); the mean value after 90 minutes was 26.9% ± 6.0% and was statistically higher than both side holes (p < 0.01, Fig. 6a). It should be noted that these values may depend on the positioning of the region of interest used for analysis (Fig. 4c); therefore, encrustation rates in holes and cavity are not directly comparable.
Increasing the inlet flow rate up to 10 mL/min resulted in a significant (up to first-order of magnitude) decrease in the percentage coverage area (Fig. 5b). The difference between mean percentage coverage area at 10 and 1 mL/min (after 90 minutes) was statistically significant, for both side holes and the occluded cavity (p < 0.01, Fig. 6a). At 10 mL/min, the percentage coverage area in hole 1 and hole 2 (after 90 minutes) was equal to 0.34% ± 0.13% and 2.86% ± 1.74%, respectively, and their difference was not statistically significant (p > 0.05, Fig. 6a). It was instead equal to 4.77% ± 1.16% in the occluded cavity, which was statistically higher than both side holes (Fig. 6a).
Figure 6b shows the mean percentage coverage area (determined experimentally) vs mean WSS (determined computationally), measured over the three regions of interest within SOCs, at both 1 and 10 mL/min. Results demonstrate an inverse and nonlinear correlation between size of encrusting deposits and WSS.
Discussion
Ureteral stents are frequently used to restore drainage in the occluded ureter and form an essential tool for urologic armamentarium. Despite their clinical success, stents suffer from complications and side effects. Formation and deposition of encrustation over the stent surface is widely recognized as a primary cause of complications, and is likely to be affected by the flow distribution in the stented ureter.
Few experimental models have been developed and employed to investigate flow processes associated with ureteral stents, either in vitro or ex vivo. 15 –20 Using an artificial dynamic model, Gorman and coworkers measured lower levels of encrustation in stents exposed to dynamic flow conditions as opposed to static conditions, suggesting a significant “cleaning” action of the bulk flow. 17 Moreover, some studies revealed that side holes of the stent are often associated with higher deposition of encrustation, and suggested that holes may act as initial anchoring sites for encrustation. 20,21 This is also confirmed to some extent by the inspection of stents retrieved from patients, wherein it was observed that the majority of side holes were plugged with crystals. 22 It is also well known that proximal and distal coils of a ureteral stent often suffer from encrustation, as reported in clinical studies. 23,24 This is likely because of the stagnant nature of the flow in those regions, resulting in low WSS levels over the inner and outer surfaces of the coil.
Moreover, Clavica et al. 10 argued that laminar vortices forming in the vicinity of obstructions may also be considered as encrustation “hot spots,” as they are effective in entrapping particles suspended in the fluid and, therefore, in promoting their deposition.
Waters and coworkers 9,25 employed a theoretical model to study the flow field in a stented ureter and discussed its relation to stent encrustation. They concluded that differences in the crystal structure, chemical composition, and localization of encrustations could depend strongly on the local urine environment.
The studies already cited suggest that, despite the low flow regime (i.e., akin to almost static conditions) normally encountered in stented ureteral systems, flow processes may dictate where, and at which rate, encrustations can grow over the stent surface. This is extremely relevant because, if confirmed, it can open new avenues for improving the stent's design through fluid dynamic optimization. For instance, earlier computational studies have shown that increasing the number of side holes could increase the drainage flow rate, 26 although this effect was minimal in the absence of a ureteral occlusion. In a prospective randomized clinical study by Damiano et al., 27 no differences in quality of life, urinary symptoms, and pain were found when using stents with different diameter, suggesting that further efforts should be devoted to more effectively improve the flow dynamic performance of stents.
Unfortunately, the literature is inconclusive on this specific issue as it lacks systematic studies addressing the direct correlation between flow metrics and encrustation rates. The microfluidic-based models of a stented ureter developed in this study allowed to reveal, for the first time, a robust inverse correlation between deposition of encrusting bodies and the local WSS in a stented ureter model.
Importantly, the flow features in the SOC models were in agreement with previous studies wherein more accurate replicas of stented ureters were employed. 10,28 In the presence of a ureteral obstruction, intercompartmental fluid exchange occurred only in the first side hole post-obstruction, coherently with earlier numerical studies, 28 and a laminar vortex formed within the obstructed cavity as previously observed by Clavica and colleagues using a full-scale artificial ureter model. 10
Moreover, we identified critical regions susceptible to encrustation, which included “inactive” side holes (i.e., with minimal or absent flow exchange between stent and ureter) and the cavity formed by a ureteral occlusion. In the cavity, encrustation occurred because of the generally low WSS levels and perhaps the trapping effect caused by the laminar vortex. Increasing WSS resulted in a significant reduction in particle deposition rates in all regions of the model investigated. Increased WSS levels in these critical regions could be achieved by altering the architecture of the stent locally to promote fluid drainage through side holes.
In a full-scale stent, there are several factors than can potentially affect the flow and WSS distribution over a stent, including stent's thickness and inner diameter, and the number, size, and shape of its side holes. These parameters will be investigated in the future using both SOC and full-scale numerical models of the stent. The effect of patient's posture (i.e., orientation of the stent) on crystals' deposition will also be studied.
Moreover, stent encrustation is a complex process involving several physical, chemical, and microbiological factors, each acting over different temporal scales. In this study, we focused on the deposition of encrusting crystals—a process that is likely to play an important role in stent encrustation, given the low-flow regime encountered in a stented ureter. Future work will, however, investigate the effect of changing the fluid chemical composition and pH on the formation and growth of crystals. For this purpose, microfluidic devices could be integrated with micro-computed tomography or Raman scattering technologies to investigate crystals structure and chemical composition in situ.
Although they replicate relevant features of the flow field in a stented ureter, SOC models do not mimic some characteristic behaviors of a physiologic ureter, including distensibility of the ureteral wall, ureteral peristalsis, and ability to adapt to pyelic pressures in case of obstruction. Moreover, although different levels of ureteral occlusion may occur in vivo (encompassing total and partial obstruction), in this study we only replicated a complete occlusion of the lumen.
Conclusions
In this study, we developed microfluidic-based models of the stented and occluded ureter and demonstrated an inverse correlation between WSS and deposition of encrusting particles. Regions susceptible to encrustation were identified, which included “inactive” side holes and the cavity formed by a complete occlusion of the ureter lumen.
As a result of our study, it could be speculated that the majority of side holes in a real stented ureter system can act as stagnation sites and, therefore, represent potential “hot spots” for the anchoring and deposition of encrusting deposits. These hydrodynamic regions can then provide an environment for the growth of larger crystals and the entrapment of bacteria to form a complex biochemical layer, as described in previous studies. 29
In conclusion, the microfluidic models developed in this study provide a fast, cost-effective (in terms of fabrication costs), and reliable screening platform for investigating the interplay between flow processes and encrustation dynamics in stents.
Footnotes
Acknowledgments
The authors would like to thank the Faculty of Engineering and the Environment (FEE) at the University of Southampton, μ-VIS X-Ray Imaging Centre at Southampton, and the EPSRC-funded NAMRIP (Network on Antimicrobial Resistance and Infection Prevention, project reference: EP/M027260/1) for having financially supported the research outlined in this article.
Author Disclosure Statement
No competing financial interests exist.
Abbreviations Used
References
Supplementary Material
Please find the following supplemental material available below.
For Open Access articles published under a Creative Commons License, all supplemental material carries the same license as the article it is associated with.
For non-Open Access articles published, all supplemental material carries a non-exclusive license, and permission requests for re-use of supplemental material or any part of supplemental material shall be sent directly to the copyright owner as specified in the copyright notice associated with the article.