
Abstract
Introduction and Objectives:
Studies have demonstrated associations between nephrolithiasis and systemic conditions, including low bone mineral density (BMD), which may correlate with hypercalciuria in kidney stone formers (KSFs). Traditionally, low BMD is diagnosed with dual-energy X-ray absorptiometry. As a noncontrast CT (NCCT) scan is typically part of a stone evaluation, our objective was to evaluate the association of NCCT-based vertebral BMD with 24-hour urine parameters in KSF.
Materials and Methods:
This is a retrospective analysis of 99 KSFs who had CT imaging and 24-hour urine studies. For each patient, BMD was estimated at the L1 vertebral body and CT attenuation measured in HU. A threshold of 160 HU was chosen to distinguish normal from low BMD. Univariate and multivariate logistic regression analysis was performed to compare patients with low and normal BMD. Multivariate linear regression was performed to assess for variables associated with 24-hour urine parameters.
Results:
Patients with low BMD had higher 24-hour urine calcium (219 vs 147 mg/day, p < 0.0001) and larger stone volume (259 vs 78.4 mm3, p = 0.009). Multivariate analysis demonstrated age >60 years (odds ratio [OR] 9.3, p < 0.0001) and hypercalciuria (OR 4.34, p = 0.004) correlated with low BMD. Linear regression demonstrated that lower BMD was associated with higher urinary calcium (β-coefficient −0.268, p = 0.009) and lower urinary citrate (β-coefficient 0.332, p = 0.01).
Conclusions:
CT-based diagnosis of low mineral bone density is associated with derangement in 24-hour urine calcium and citrate in KSFs, as well as larger stone volumes.
Introduction
T
Bone loss is of concern to kidney stone formers (KSFs) as they have been shown to experience a nearly fourfold higher risk of bone fractures compared to non-KSF. 5,6 In KSF with idiopathic hypercalciuria, the degree of bone loss directly correlates with urine calcium excretion. 7 Several theories have been proposed regarding the association of bone loss with urinary stone formation, including genetic factors, increase in bone turnover markers, a result of a total body net negative calcium balance, dietary effects, hormonal influences, and cytokine effects. 8,9
Noncontrast CT (NCCT) imaging is the gold standard for detection of urinary calculi, and its utilization has increased to 71% in the work-up of renal colic in emergency rooms. 10 The American Urological Association (AUA) Surgical management of stones guidelines provide a strong recommendation for CT imaging before surgical intervention (strong recommendation for percutaneous nephrolithotomy [PCNL] and conditional recommendation for shockwave lithotripsy [SWL]/ureteroscopy [URS]). 11
As CT utilization increases and healthcare cost control becomes more critical, there are increased opportunities to capture additional clinically relevant information. For example, Pickhardt and associates 12 developed a method of opportunistic screening for osteoporosis using abdominal CT scans obtained for other indications by assessing HU at several vertebral body levels with acceptable sensitivity and specificity compared to gold standard dual-energy X-ray absorptiometry (DEXA) scan. Opportunistic CT imaging (1) provides retrieval of data on CT examinations ordered for other indications (urolithiasis), (2) carries no additional cost to the patient, (3) does not require additional equipment, and (4) carries no additional radiation exposure.
Prior studies have demonstrated that KSFs display a lower average bone mineral density (BMD) compared to non-KSFs. 13 In addition, urinary calcium excretion has been shown to inversely correlate with BMD assessed by DEXA. The aim of this study is to identify associations of low BMD diagnosed on NCCT scan performed for evaluation of nephrolithiasis with subsequent 24-hour urine metabolic studies.
Materials and Methods
After institutional review board approval was obtained for the Cleveland Clinic Kidney Stone Registry, 99 consecutive patients between the time period of 2013 and 2015 were identified meeting inclusion criteria of: noncontrast abdomen/pelvis CT imaging at the time of diagnosis of nephrolithiasis and at least one complete 24-hour urine study (urine volume, calcium, oxalate, citrate, sodium, uric acid, and pH). Exclusion criteria included 24-hour urine study done before stone surgery (as large stone burdens may result in inaccurate composition), patients on medical therapy for stone disease at time of CT imaging or 24-hour urine study (thiazide or citrate), and patients on medical therapy for osteoporosis (bisphosphonates, RANKL inhibitor).
Additional variables extracted from the registry included age, gender, body mass index (BMI), medical comorbidities (history of hypertension, diabetes, peripheral vascular disease, or coronary artery disease), alcohol history, tobacco history, ever receiving a stone surgery (URS, PCNL, or SWL), and predominant (>50%) stone analysis component if available (calcium oxalate, calcium phosphate, uric acid, or struvite). Serum chemistry studies were also collected, including parathyroid hormone, uric acid, vitamin D-25 hydroxy, calcium, sodium, potassium, chloride, and bicarbonate. Patients with hypercalciuria (>200 mg/day) and elevated parathyroid hormone (>65 pg/mL) and those with hypercalciuria and hypercalcemia (>10.2 mg/dL) were excluded to encompass only those patients with idiopathic hypercalciuria. 14
For each patient, BMD was estimated by placing an oval region of interest on an area of vertebral body trabecular bone at the L1 level with CT attenuation measured in HU–Figure 1. Stone volume was assessed with Siemens syngo®.via Calcium scoring software (Erlangen, Germany). Based on previously published data, a threshold for a balanced sensitivity (73.9%) and specificity (70.6%) of 160 HU was chosen to distinguish normal from low BMD (osteopenia/osteoporosis). 12

Estimation of BMD with oval region of interest on a vertebral body trabecular bone at the first lumbar vertebra. CT attenuation is measured in HU. BMD = bone mineral density.
Patients with low BMD (HU <160) and normal BMD (HU >160) were compared with independent samples t-test (for normally distributed continuous variables), Mann–Whitney U-test (for non-normal distributed continuous variables), and chi-square likelihood ratio or Fisher's exact test (for nominal and categorical variables). Multivariate logistic regression was performed by a backward conditional method to assess for variables associated with low BMD by including variables with significant differences on univariate analysis.
Linear regression models were constructed to assess for variables associated with 24-hour urine parameters. Correlations between BMD and 24-hour urine parameters were evaluated using Spearman's rank correlation coefficient. A two-sided p-value <0.05 was considered to represent a statistically significant difference. Receiver operating characteristic (ROC) curves were constructed for BMD (test variable) and 24-hour urine parameters (outcome). The area under the curve (AUC) was calculated to assess for the performance of BMD in identifying 24-hour urine derangements. Statistical analyses were performed with SPSS software (Version 25; SPSS Inc., Chicago, IL).
Results
Table 1 displays patient demographics. Of the total patients, 51.5% in the cohort underwent stone surgery. The mean age of the cohort was 59 ± 17 years (range 19–87), and mean BMI was 31.1 ± 8.3 kg/m2. The most common predominant stone composition was calcium oxalate (45.5%). Mean CT BMD was 157 ± 53 HU, and 55.6% of patients exhibited low BMD. Mean 24-hour urine calcium excretion was 188 mg/day, and mean stone volume was 175.3 mm3.
Continuous variables presented as mean (±standard deviation).
Bold values indicate p value < 0.05, significant.
BMD = bone mineral density; BMI = body mass index; PCNL = percutaneous nephrolithotomy; SWL = shockwave lithotripsy.
Table 1 also compares patients with normal (HU >160) and low BMD (HU <160). Compared to patients with normal BMD, patients with low BMD were older (67 vs 50 years, p < 0.0001), had a higher prevalence of hypertension (68.2% vs 31.8%, p < 0.0001), had higher mean 24-hour urine calcium (219 vs 147 mg/day, p < 0.0001), and harbored a larger stone volume (259 vs 78.4 mm3, p = 0.009). Low BMD was more prevalent in males vs females (71.7% vs 37.0%, p < 0.001) and in those who underwent PCNL (100% vs 0%, p < 0.0001). Of the 55 patients with low BMD, 7 (12.7%) had normal urine calcium and citrate, 26 (47.3%) had hypocitraturia (<320 mg/day), 32 patients (58.2%) had hypercalciuria, and 10 patients (18.2%) displayed both hypocitraturia and hypercalciuria.
Table 2 displays predictors of low BMD. While controlling for gender, BMI, hypertension, and stone volume, we found that age >60 years (odds ratio [OR] 9.3, 95% confidence interval [CI] 3.4–25.6, p < 0.0001) and hypercalciuria >200 mg/day (OR 4.34, 95% CI 1.6–11.9, p = 0.004) were associated with low BMD. Table 3 displays predictors of 24-hour urine calcium. Decreasing BMD was significantly inversely associated with urine calcium excretion (β-coefficient −0.268, p = 0.009). Figure 2 shows a scatter plot of CT BMD HU and 24-hour urine calcium, with a correlation coefficient of R = −0.271, p = 0.009. When comparing patients with and without hypocitraturia (<320 mg/day), a significantly lower BMD was observed in hypocitraturic patients (140 vs 164 HU, p = 0.032). Table 4 displays predictors of 24-hour urine citrate. Increasing BMD was significantly directly associated with urine citrate excretion (β-coefficient 0.332, p = 0.01). Figure 3 shows a scatter plot of CT BMD HU and 24-hour urine citrate, with a correlation coefficient of R = 0.217, p = 0.032. Correlation and linear regression models were constructed for the remaining 24-hour urine parameters (oxalate, sodium, uric acid, and pH); however, no significant associations with BMD were established. ROC curves were constructed for BMD (test variable) and 24-hour urine calcium and citrate (outcome variables). The AUC for decreasing BMD to identify hypercalciuria (>200 mg/day) and hypocitraturia (<320 mg/day) on a subsequent 24-hour urine study was 0.646 (p = 0.013) and 0.634 (p = 0.026), respectively (Supplementary Figs. S1 and S2; Supplementary Data are available online at

Scatter plot of 24-hour urine calcium and CT BMD HU.
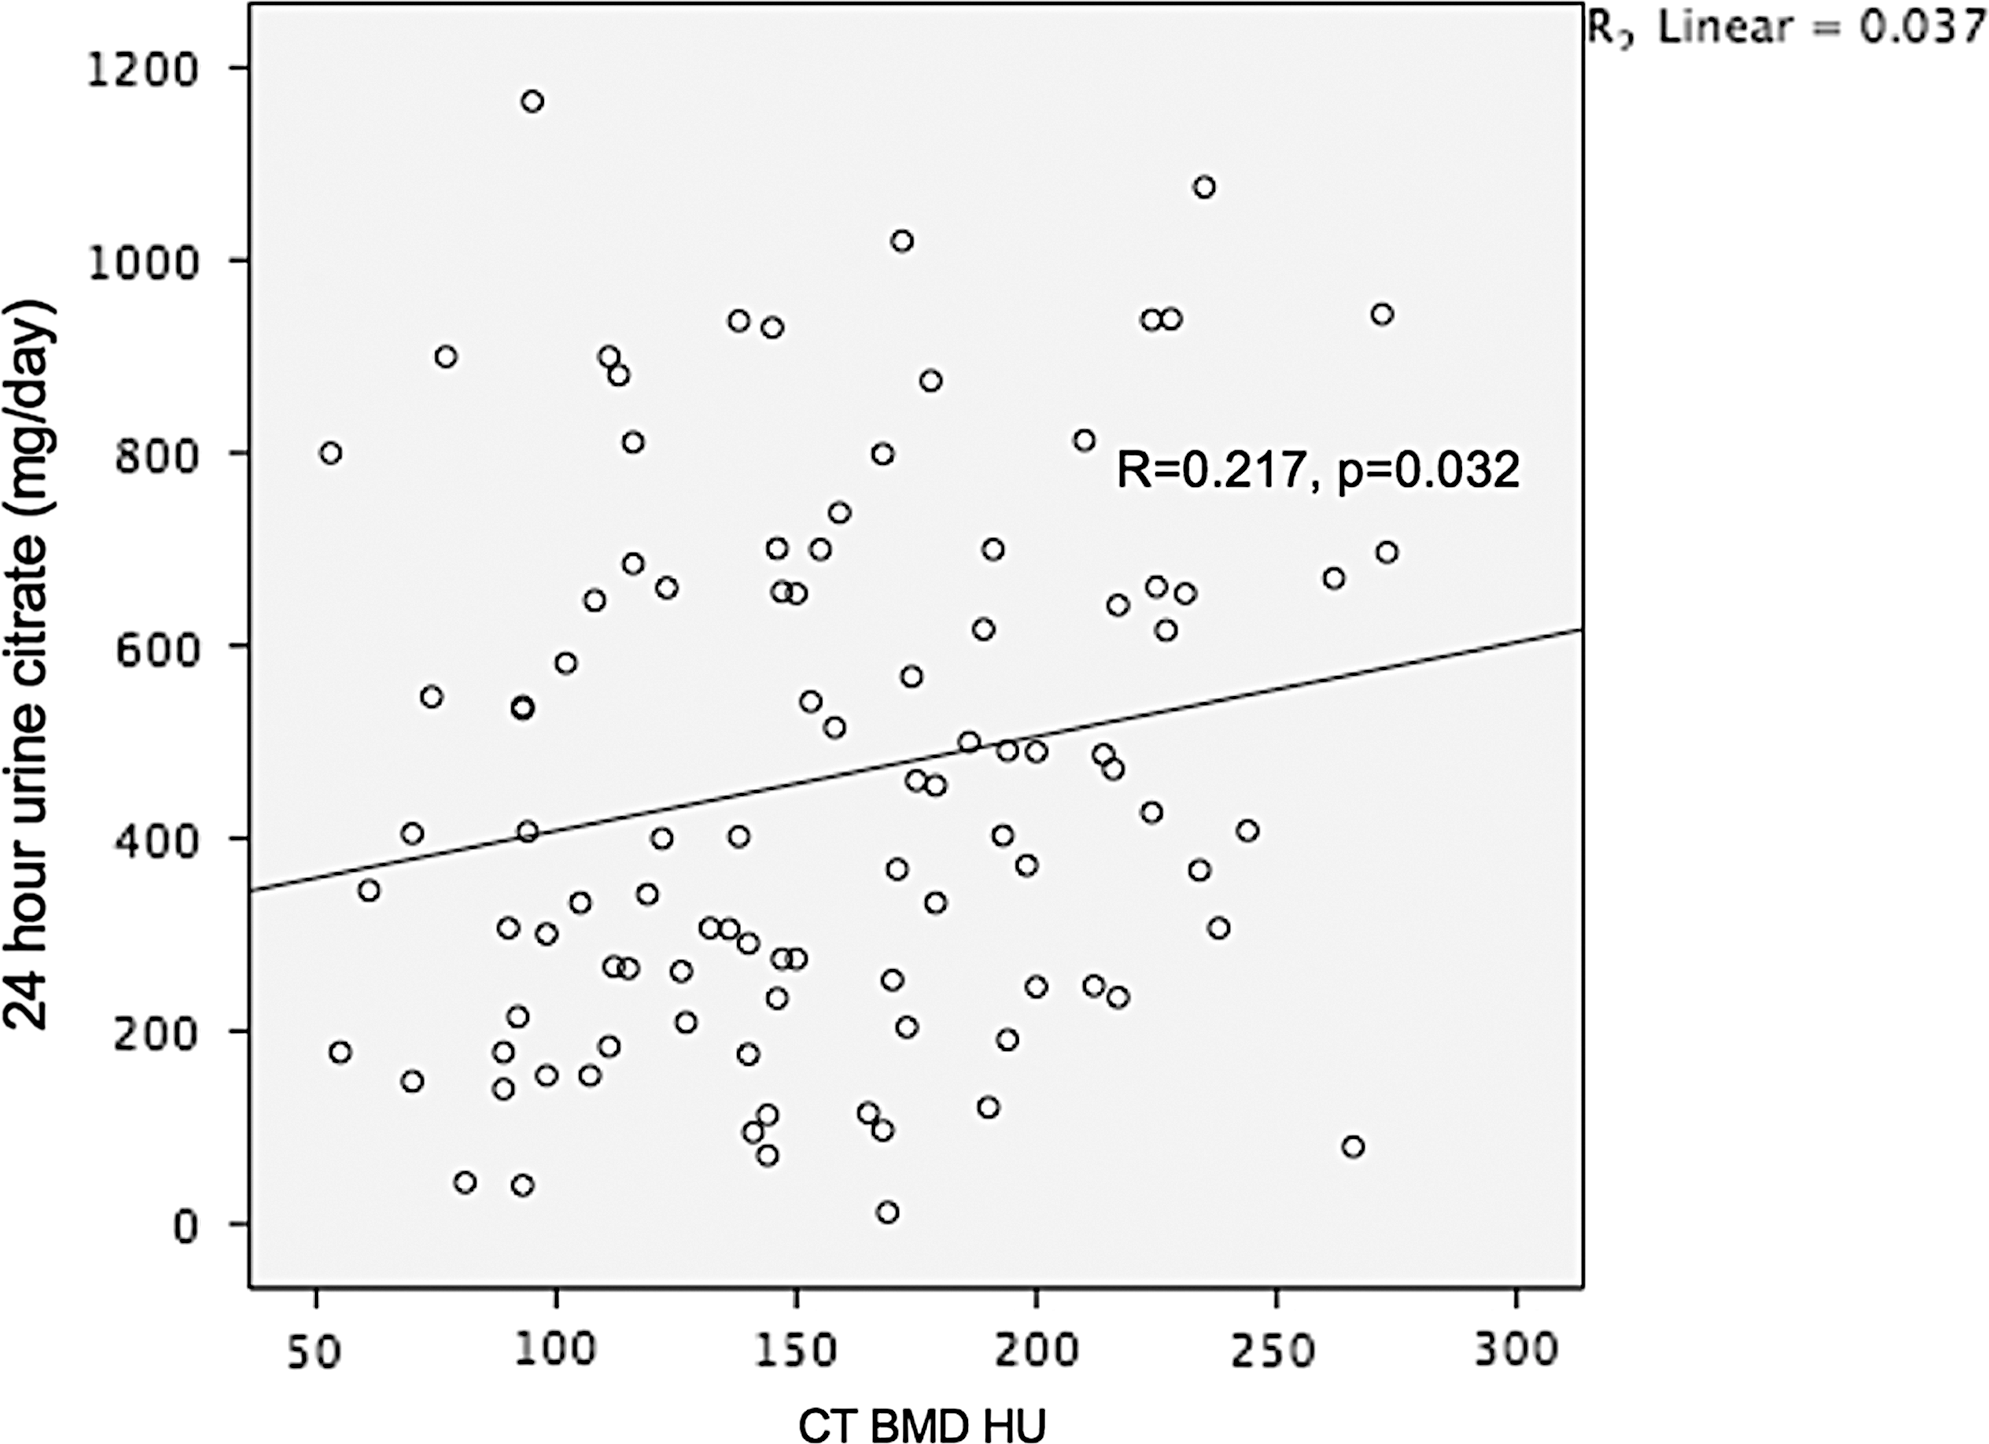
Scatter plot of 24-hour urine citrate and CT BMD HU.
Bold values indicate p value < 0.05, significant.
CI = confidence interval; OR = odds ratio.
Bold values indicate p value < 0.05, significant.
SE = standard error.
Bold values indicate p value < 0.05, significant.
Discussion
Our study highlights several important findings relevant to KSF. Foremost, KSF with low BMD per CT criteria demonstrated higher urinary calcium excretion (219 vs 147 mg/day, p < 0.0001), and the degree of bone mineral loss was associated with higher urinary calcium excretion. KSFs with low BMD also exhibited larger stone volumes on CT (259 vs 78.4 mm3, p = 0.009). Finally, the degree of bone loss in KSF was associated with lower urinary citrate excretion.
As much as 80% of urinary calculi contain a majority calcium component coupled with oxalate or phosphate. 15 Among calcium KSFs, hypercalciuria is the most common finding on further metabolic work-up. 16 The association of increased fracture risk and osteoporosis with nephrolithiasis has been emphasized by previous studies. 5,6,17 –19 Asplin and colleagues 7 demonstrated that urine calcium excretion was inversely correlated with changes in femoral neck and spine BMD z-scores on DEXA imaging over 3 years. Data against this relationship have recently been published demonstrating no significant relationship between urinary calcium and BMD in calcium KSFs; however, a subset analysis did reveal a significant inverse association in nonestrogen-treated postmenopausal females. 20
Controversy exists whether hypercalciuria in KSFs is the result of a primary disorder in the bone milieu, decreased BMD is the consequence of a net loss of total-body calcium, or a combination of these factors. 21 A common misconception in calcium KSFs is the need to decrease calcium intake to prevent further stone formation, which may alter bone response and lead to worsening BMD. 4 Idiopathic hypercalciuria has been associated with markers of increased bone turnover in KSFs, including bone alkaline phosphatase, C-terminal telopeptide, pyridinolines, serum osteocalcin, RANKL, and sclerostin, and may explain decreased BMD in KSFs. 4,22,23 Cytokines associated with increased bone resorption have also been implicated in hypercalciuric KSFs, including interleukin (IL)-1, 19 IL-6, 24 and tumor necrosis factor α. 24
Regardless of the etiology of the association between low BMD and hypercalciuria in KSFs, screening for elevated fracture risk is critical, and our study provides an opportunistic screening method utilizing existing NCCT scans. A limitation of our study is that patients found to have low BMD on CT were not confirmed with the gold-standard DEXA scanning; however, HU parameters were used based on prior studies that confirmed a good balance of sensitivity and specificity compared to DEXA scan. Screening for low BMD is important, as directed treatment strategies based on screening findings may improve bone health, decrease risk of pathologic fracture, and decrease further kidney stone recurrence. Standard therapies for hypercalciuria in recurrent KSFs may consist of thiazide drugs (hydrochlorothiazide, chlorthalidone, or indapamide) and alkali drugs (potassium citrate, sodium bicarbonate, or sodium citrate); however, these drugs may also reduce bone resorption and promote bone formation. The addition of hydrochlorothiazide therapy to aminobisphosphonates in patients with low BMD, hypercalciuria, and recurring calcium stone disease has been shown to improve urine calcium excretion and hip/femur/lumbar BMD T-score more than bisphosphonate therapy alone. 25
Prolonged systemic acidosis leads to bone demineralization as a protective mechanism to help maintain systemic pH by acting as an acid buffer. 26 Metabolic acidosis may increase stone risk through increased urinary calcium, increased urine phosphate, and decreased urinary citrate. Our linear regression urinary citrate model demonstrated that decreasing BMD was significantly directly associated with decreased urinary citrate. When recurrent KSFs present with findings of hypocitraturia and low BMD, potassium directed therapy and its subsequent alkali load reduce bone resorption by buffering acid production and improve urinary pH and citrate to decrease stone risk. 27
Our ROC curve analysis demonstrated that decreasing BMD correlated with hypercalciuria and hypocitraturia on a subsequent 24-hour urine study with AUC of 0.646 and 0.634, respectively. This finding is relevant during the decision-making process as to which patients would benefit from further work-up with a 24-hour urine study. The AUA Guidelines on the Medical Management of Kidney Stones recommend additional testing for high risk or interested first-time stone formers and recurrent stone formers. 28 However, since as much as 35% of 24-hour urine studies may show no abnormality, 29 judicious and appropriate ordering of this study may avoid unnecessary testing. High-risk KSFs are generally categorized by having a large stone burden, uncommon composition (cystine), comorbid system conditions (gout, Crohn's disease, or sarcoidosis), or urogenital abnormalities (solitary kidney or ureteropelvic junction obstruction). We propose that patients demonstrating low BMD (HU <160 at L1 vertebra) on CT imaging can also be considered high risk and benefit with additional 24-hour urine studies that may reveal high urinary calcium or low citrate. The assessment of HU of L1 trabecular bone on CT imaging can easily be performed by practicing urologists in clinical practice and help guide medical decision-making.
This is the first study to our knowledge to demonstrate an association of CT-based diagnosis of low BMD and findings of hypercalciuria and hypocitraturia on subsequent 24-hour urine study. However, several limitations regarding our study warrant discussion. First, clinical data were collected in a retrospective manner and inferences regarding the ability of CT-assessed BMD to predict 24-hour urine findings may be limited by unknown confounding factors. Second, our diagnosis of low BMD was based solely on CT findings, and although our threshold of 160 HU has been validated compared to DEXA by prior studies, 12 our cohort did not have the gold-standard DEXA available. In addition, we only assessed vertebral trabecular bone, and cortical bone was not evaluated. In addition, while femoral neck anatomy is often included in CT of the abdomen/pelvis and BMD of the femoral neck is often obtained by DEXA, our study did not assess HU of the femoral neck. Our selected HU cut point for low BMD was 160 (cutoff for osteopenia), and thus, a subset of patients with normal BMD may have been included in our analysis. However, we performed an analysis of lower HU thresholds (135 and 110), and 24-hour calcium levels remained significantly elevated in the lower BMD groups (HU 135, p = 0.013; HU 110, p = 0.037). Third, several continuous variables were converted to categorical variables for statistical analyses, and the cut points may influence our results. Fourth, the percentage of men with low BMD was 71.7% compared to females, 37.0%, which is unexpected since BMD declines more rapidly in women than in men secondary to bone protective estrogen effects that are lost in the postmenopausal period. 30 Men have a higher prevalence of nephrolithiasis compared to women 1 (10.6% vs 7.1%), and previous studies have reported a greater magnitude of urinary calcium in male KSFs compared to women. 31 In our cohort, a higher prevalence of males demonstrated hypercalciuria compared to females (61.4% vs 38.6%) which may explain the male preponderance of low BMD.
Conclusion
Low BMD diagnosed on NCCT scan performed for nephrolithiasis is associated with hypercalciuria and hypocitraturia on subsequent 24-hour urine studies. This information can provide valuable screening mechanisms as to which KSFs may be at risk for osteoporosis and fracture and those at risk for exhibiting abnormalities on 24-hour urine evaluations. Our findings may also guide treatment decisions to prevent future stone recurrences and improve bone health.
Footnotes
Author Disclosure Statement
No competing financial interests exist.
Abbreviations Used
References
Supplementary Material
Please find the following supplemental material available below.
For Open Access articles published under a Creative Commons License, all supplemental material carries the same license as the article it is associated with.
For non-Open Access articles published, all supplemental material carries a non-exclusive license, and permission requests for re-use of supplemental material or any part of supplemental material shall be sent directly to the copyright owner as specified in the copyright notice associated with the article.