
Abstract
Objective:
To assess the diagnostic value of transrectal shear wave elastography (SWE) for detecting prostate cancer (PCa) in peripheral zone and compare it with magnetic resonance imaging (MRI).
Materials and Methods:
Two hundred twenty-one patients suspected of PCa were enrolled, in which 172 patients of them underwent both SWE and MRI. Elastic value was measured in the area prepared for systematic biopsy and suspicious lesion detected on B-mode or SWE, histopathological result was compared for each biopsy. The sensitivity, specificity, positive predictive value (PPV), negative predictive value (NPV), and accuracy were derived by obtaining optimal threshold from receiver operating characteristic (ROC) curve. The correlation between the stiffness of PCa and Gleason scores, prognostic grades, and percentage of cancer in biopsy were evaluated by Spearman rank correlation. Multivariate logistic regression analysis was performed to determine predictors for diagnosing PCa. The diagnostic capacity of MRI and SWE for detecting PCa and clinically significant PCa in the peripheral zone were assessed by comparing area under curve of ROC curve.
Results:
A value of 42 kPa was used as the cutoff for differentiating benign from malignant prostatic tissue; the sensitivity, specificity, PPV, NPV, and accuracy were 78.97%, 90.67%, 71.30%, 93.66% and 88.03%, respectively. Rank correlation analysis revealed that the stiffness of PCa had a correlation with Gleason score, prognostic grade, and percentage of cancer in biopsy. On multivariate analysis, the age, free prostate-specific antigen (PSA), PSA density, SWE, and MRI were independent predictors for diagnosing PCa. There was no statistical difference for diagnosing PCa between SWE and MRI (p = 0.259). However, for clinically significant PCa, the diagnostic capacity of SWE was a little higher than MRI (p = 0.013).
Conclusions:
SWE may provide additional information for PCa detection, which could increase the positive rate of PCa in targeted biopsy and reduce unnecessary biopsy. SWE is compatible with MRI for detecting PCa in the peripheral zone.
Introduction
Prostate cancer (PCa) is the most common malignant tumor and the second-leading cause of cancer death in men in the United States. 1 It is also the second most frequently diagnosed cancer in males worldwide, 2 and the incidence rate of PCa increased rapidly in China over the past 10 years. 3 The screening of PCa is relied on serum prostate-specific antigen (PSA) and/or digital rectal examination (DRE). Transrectal ultrasound (TRUS)-guided 12-core systematic biopsy is still the golden standard when PCa is suspected in clinical practice. However, PCa is not usually visualized on the imaging, the random biopsies may miss significant PCa and lead to high false-negative rate. 4,5 On the other hand, microscopic indolent tumors are incidentally detected that may not require prompt treatment. 6 To reduce false-negative results, investigators have tried to increase the number of systematic biopsies, but associated increased procedural risk cannot be disregarded. 7,8
Currently, the main image modalities for diagnosing PCa include TRUS and multiparametric magnetic resonance imaging (MRI). A standard gray-scale TRUS is the most common imaging method for direct visualization of the prostate because it is real time, no radiation, and low cost, but it has limited sensitivity and specificity (40%–50%) in the diagnosis of PCa. It is difficult to detect prostatic lesions accurately by using TRUS because nearly 58% of PCa are multifocal and progress along the capsule of the prostate and may not appear as well-defined nodules like other malignant tumors. 9 In addition, the suspicious hypoechoic areas represent PCa in only 9%–53% of cases. 10 –12
MRI has become a promising tool in detecting, localizing, staging, and monitoring PCa. Suspicious lesions in MRI, which are not visible in TRUS, can be guided by MRI–TRUS fusion imaging. However, the results of MRI–TRUS fusion-guided targeted biopsy of the prostate are mixed. In some studies, MRI–TRUS fusion-guided targeted biopsy of the prostate has higher detection rates of PCa compared with the systematic biopsy. 13,14 Additionally, some studies could not show superiority of MRI–TRUS fusion-guided targeted biopsy in the detection of PCa compared with the systematic biopsy. 15,16 Anyway, MRI is increasingly used to help diagnose PCa, especially clinically significant PCa, but it also has limitations, such as contraindications (claustrophobia, pacemaker), high cost, time requirement, and how to best integrate MRI and fusion-guided biopsy into the diagnostic pathway is still needed in the future study. 17 Therefore, it is urgent to find a new, efficacious PCa detection modality which may improve the detection of PCa, decrease the unnecessary biopsies, and reduce overtreatment.
PCa has higher cell and vessel density, which is discernibly stiffer than both benign and normal tissues, 18 and it could be occasionally felt during DRE. However, DRE is examiner dependent and limited to the posterior part of the prostate, up to 80% PCa cases cannot be detected by DRE. 19 Shear wave elastography (SWE) is a new noninvasive technique which provides quantitative stiffness information, which has been applied to differentiate diffuse diseases and local lesions in different organs according to their stiffness. 20 –22 Several studies have investigated the diagnostic accuracy of SWE in PCa detection with limited number of patients, 23 –26 but there are few studies comparing SWE with MRI. About 70%–80% PCa arise in the peripheral zone of prostate, 27 so the aim of this article is to assess the diagnostic value of SWE for detecting PCa in peripheral zone and compare it with MRI.
Materials and Methods
Patients
From March 2017 to December 2018, a total of 221 consecutive patients who were suspected of having PCa and scheduled for prostate biopsy were enrolled in this prospective study. Inclusion criteria were elevated serum PSA level (>4 ng/mL), palpable nodular lesion in DRE, abnormal TRUS, or MRI finding. Exclusion criteria were acute urinary infection; prostate endocrine, or surgical treatment; SWE imaging was not performed; or the elastic value was not acquired according to the study protocol. All patients were given written informed consent for using their medical data for scientific purposes in this study, which was approved by the Ethics and Scientific Review Board of our institution.
TRUS and SWE
All patients were scanned in the left decubitus position. TRUS was performed on an Aixplorer ultrasound diagnostic system (SuperSonic Imagine, Aix en Provence, France) with a transrectal SE12-3 (3–12 MHz) probe, including B-mode, color Doppler, and SWE imaging. Once the lesion in the peripheral zone of prostate was found on B-mode, the position, size, boundary, internal echo, and blood flow were recorded. SWE was activated after conventional ultrasound, then the color-coded SWE imaging was displayed over a B-mode image in real time. The SWE scale was set to a maximum value of 90 kPa and the SWE penetration mode was chosen. The least amount of pressure on the prostate as possible while maintaining contact with the probe was used. The red color code indicated hard, the blue represented soft.
Systematic stiffness measurement was performed by placing a region of interest (ROI) on the areas in the paramedial and lateral aspects at the level of base, mid-gland, and apex of prostate peripheral zone, which corresponds to the estimated path for 12-core systematic biopsy, as shown in Figure 1. In addition, in cases the lesion or suspicious area was detected on B-mode, both the imaging of SWE and biopsy encompassing the lesions were obtained, as shown in Figures 2 and 3A. Furthermore, we identified the areas stiffer than the background prostate gland on SWE, but it had negative findings on B-mode, hence additional biopsy was made once it was presented, as shown in Figure 3B. The ROI used for measurement was circle, and its diameter was adapted to enclose the areas of higher stiffness ranging from 3 to 7 mm. Then the maximum, the mean, and the minimum elastic value of every ROI was displayed. In our study, the maximum value was used for further assessment. The elastic value and histopathological result of biopsy were compared for each biopsy.
The measurement of ROI in the area of systematic biopsy. A 78-year-old patient with a PSA of 3.340 ng/mL, free PSA of 1.119 ng/mL, and fPSA/PSA of 0.34. Elastic values were measured by placing two round ROIs in the paramedian and lateral biopsies at the level of mid gland. The peripheral zone was homogeneous and the elastic value was low. Biopsies revealed as benign prostate tissue. PSA = prostate-specific antigen; ROI = region of interest.

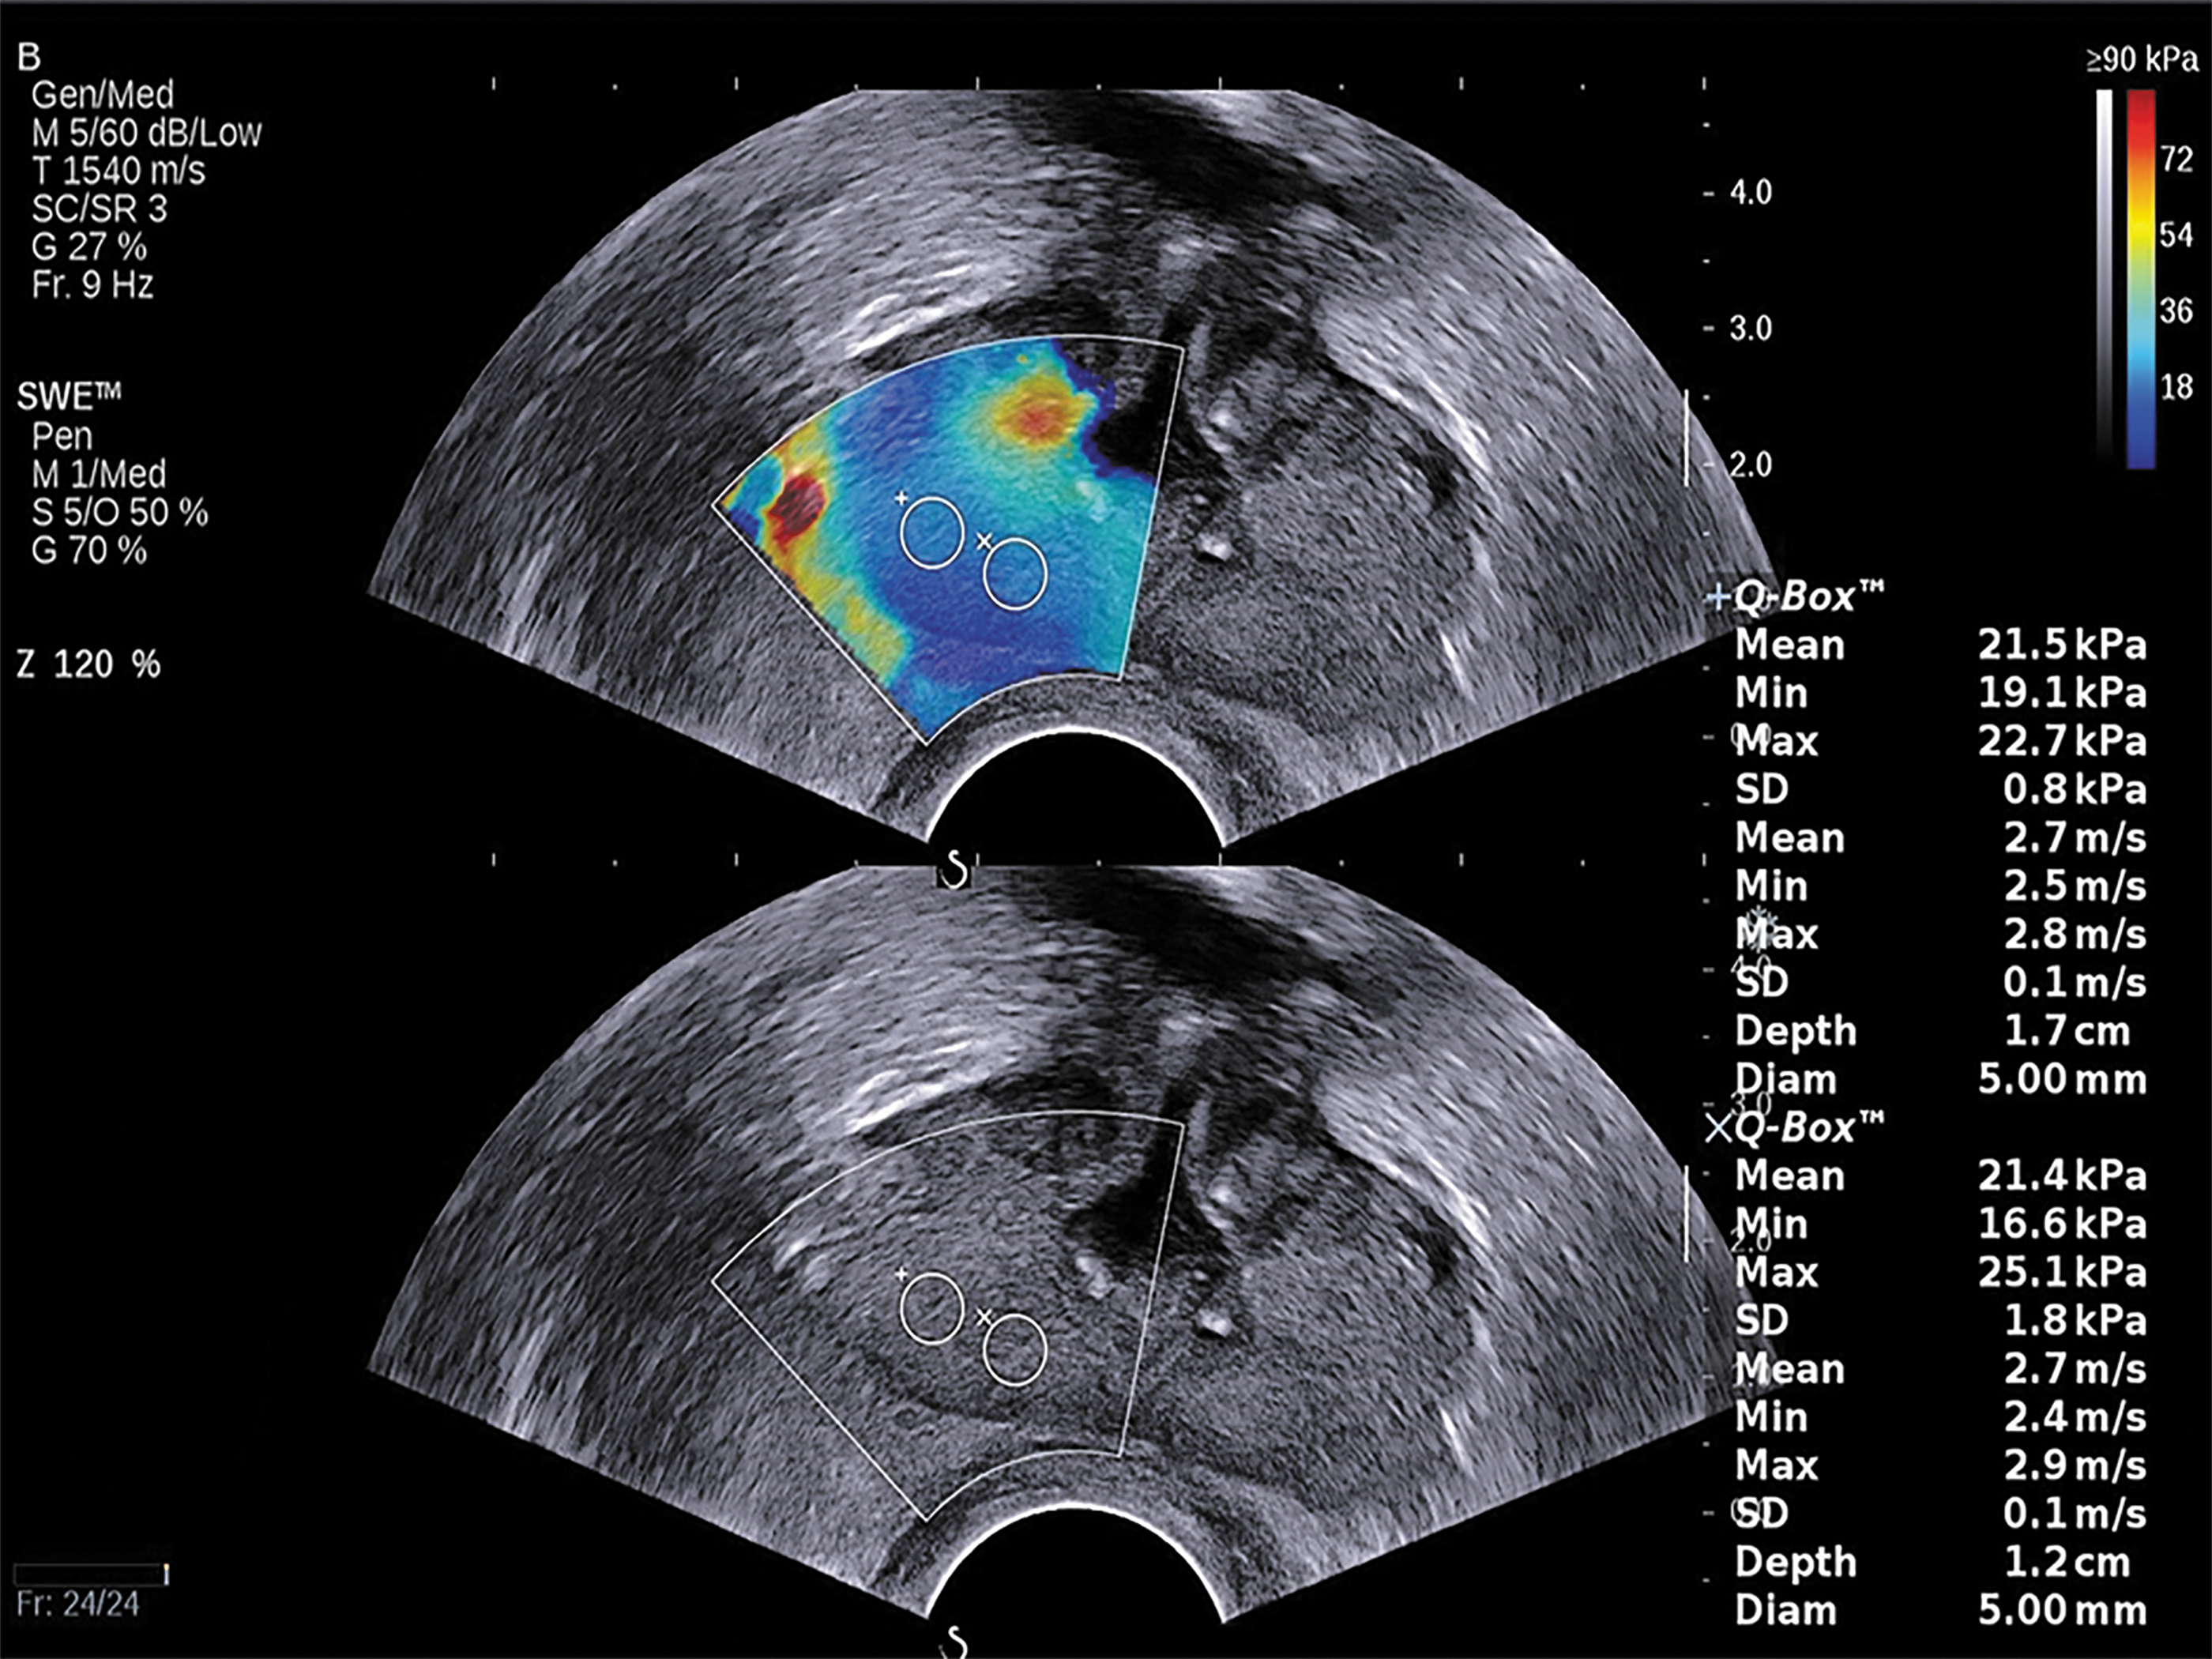
Malignant lesion. A 67-year-old patient with a PSA of 8.939 ng/mL, fPSA of 5.132 ng/mL, and fPSA/PSA of 0.57. There was a hypoechoic lesion in the left peripheral zone of prostate on B-mode, and the SWE showed a red-coded area in the same area on the top image. The ROI was placed and the maximum value was 157.9 kPa, the biopsy performed in the stiffest area revealed as PCa with Gleason score 5 + 5 = 10, prognostic grade V, percentage of cancer with 70%. PCa = prostate cancer; SWE = shear wave elastography.
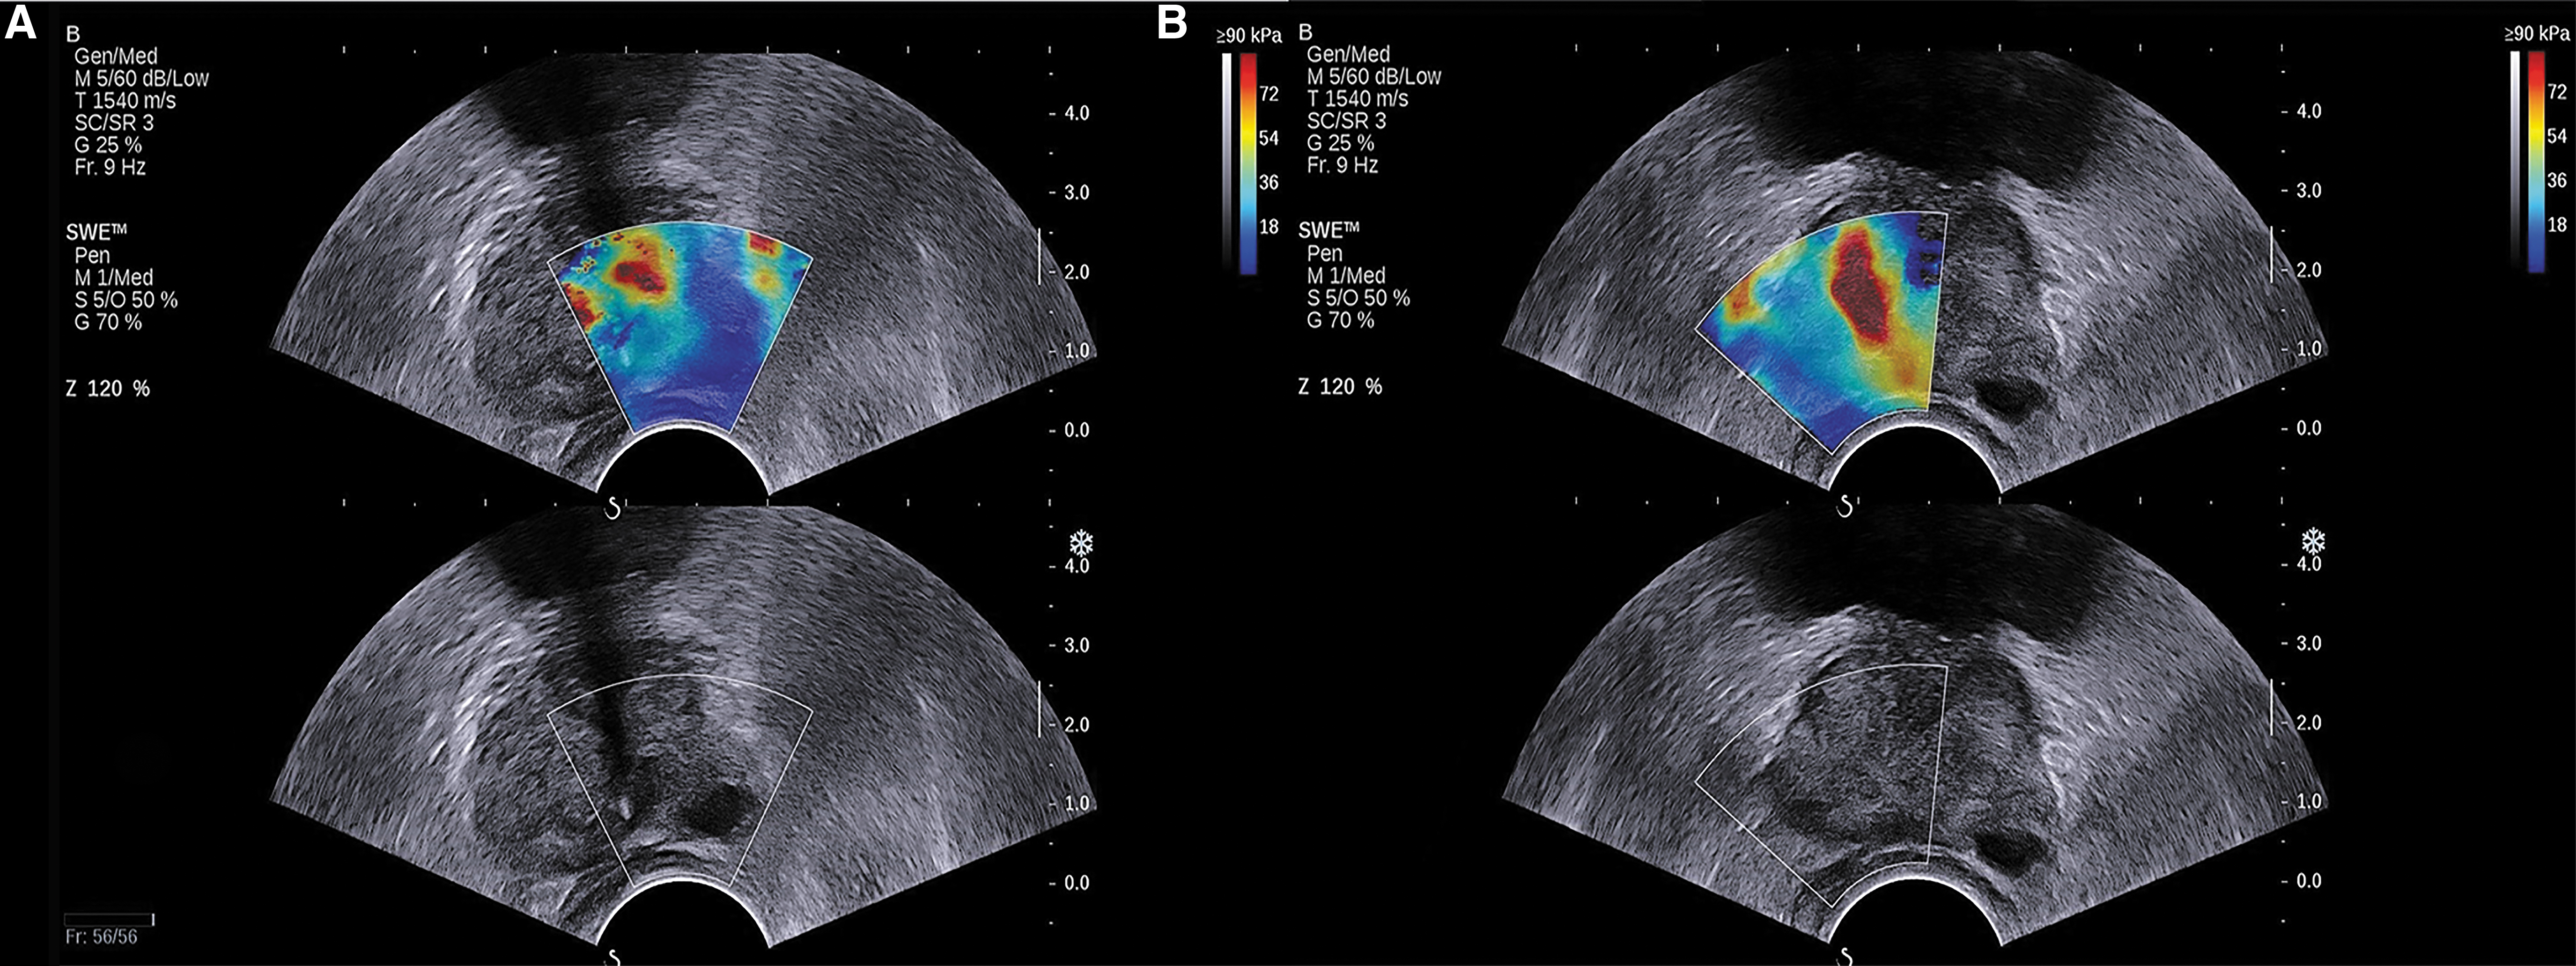
Benign lesion and invisible lesion on B-mode. An 82-year-old patient with a PSA of 8.911 ng/mL, fPSA of 0.884 ng/mL, and fPSA/PSA of 0.1.
Magnetic resonance imaging
MRI was performed on a 3.0 T scanner (Magnetom Trio; Siemens Healthcare, Erlangen, Germany) with a pelvic phased-array coil. Three different MRI modalities were used: T1-weighted imaging, T2-weighted imaging (T2WI), diffusion-weighted imaging (DWI), including an apparent diffusion coefficient (ADC) map and high b-value images. The Prostate Imaging-Reporting and Data System (PI-RADS) 28 was used as the diagnostic criteria.
PI-RADS assessment for T2WI for peripheral zone was: (1) Uniform hyperintense signal intensity (normal); (2) Linear or wedge-shaped hypointensity or diffuse mild hypointensity, usually indistinct margin; (3) Heterogeneous signal intensity or noncircumscribed, rounded, moderate hypointensity, includes others that do not qualify as 2, 4, or 5; (4) Circumscribed, homogenous, moderate hypointense focus/mass confined to prostate and <1.5 cm in greatest dimension; and (5) Same as 4 but ≥1.5 cm in greatest dimension or definite extra prostatic extension/invasive behavior.
PI-RADS assessment for DWI for peripheral zone was: (1) No abnormality on ADC and high b-value DWI; (2) Indistinct hypointense on ADC; (3) Focal mildly/moderately hypointense on ADC and isointense/mildly hyperintense on high b-value DWI; (4) Focal markedly hypointense on ADC and markedly hyperintense on high b-value DWI; <1.5 cm in greatest dimension; and (5) Same as 4 but ≥1.5 cm in greatest dimension or definite extraprostatic extension/invasive behavior. In addition, lesions with overall score ≥4 were diagnosed as malignant.
MRI was read by two radiologists with more than 10 years' experience, who were blinded to ultrasound and histopathological findings. Not all patients underwent MRI, and MRI was performed according to clinical needs and patient conditions.
TRUS-guided biopsy
After performing the routine B-mode, color Doppler, and SWE imaging, the prostate biopsies were performed by the same ultrasound physicians. An 18-gauge, 20-cm biopsy needle (Biopty; Bard, Covington, GA) powered by an automatic biopsy device was used to obtain biopsy cores. The systematic biopsy protocol included 12 biopsies, where the ROIs were placed on SWE unless there was a contraindication for biopsy such as blood or severely uncomfortable. In cases where focal lesions were detected on TRUS or SWE, additional biopsies encompassing the lesions were obtained. If the lesion could be detected by both TRUS and MRI, the biopsy was performed by TRUS guided. If the lesion was detected only in MRI but invisible in TRUS, the biopsy was performed by MRI–TRUS fusion guided.
Pathological analysis
The specimens were marked and sent for histopathological examination. They were processed and examined independently by the pathologists with 10 years' experience, who were blinded to ultrasound and MRI. If the specimens were considered as PCa, the Gleason score, prognostic grade, and percentage of cancer in biopsy were recorded. Clinically significant PCa was defined as Gleason score ≥3 + 4 and/or percentage of cancer in biopsy >50%, whereas others were defined as clinically insignificant PCa.
Statistical analysis
The elastic values of benign and malignant prostate tissue were compared by using unpaired Student t test. Receiver operating characteristic (ROC) curve analysis was performed for elastic value of prostate tissue at biopsy. Optimal cutoff of elastic value was determined by using the maximum Youden index (sensitivity + specificity −1). The sensitivity, specificity, positive predictive value (PPV), negative predictive value (NPV), and accuracy were then derived according to the threshold. Analysis of variance (ANOVA) was used to analyze the elastic values of different histopathological results, Gleason scores, prognostic grades, and percentage of cancer in biopsy. Subgroup comparisons were analyzed by a post hoc Student/Newman/Keuls test.
The correlation analysis of the stiffness of PCa with Gleason score, prognostic grade, and percentage of cancer in biopsy was evaluated by Spearman rank correlation. To identify predictors of diagnosing PCa, univariate logistic regression was performed initially to obtain unadjusted odds ratios for several variables. Subsequently, all the variables were put into a multivariate model to obtain adjusted odds ratios and control for confounding. Variables of interest for logistic regression were: age, total PSA, free PSA, free/total(F/T) PSA, PSA density, SWE (elastic value), and MRI (PI-RADS score). The diagnostic capacity of MRI and SWE for detecting PCa and clinically significant PCa in peripheral zone was assessed by comparing the area under curve (AUC) of ROC curve.
Results
Totally, 221 patients suspected of having PCa with a mean age of 68.79 ± 9.54 years (range, 35–88 years) were enrolled in the study. The mean total and free PSA level was 46.85 ± 339.60 ng/mL (range, 0.371–4836.700 ng/mL) and 4.99 ± 13.80 ng/mL (range, 0.065–144.950 ng/mL), and the mean F/T PSA was 0.17 ± 0.11 (range, 0.03–0.64). The mean prostate volume was 52.42 ± 32.39 cc (range, 11.0–197.0 cc). The mean PSA density was 0.67 ± 1.61 ng/mL 2 (range, 0.01–12.21 ng/mL 2 ). A total of 2749 biopsies (2603 biopsies with systematic biopsies and 146 biopsies with lesion biopsy) participated in our study, and a mean of 12.44 biopsies was performed per patient (a range from 3 to 15 biopsies). 623 positive biopsies (22.67%) for PCa were detected in 102 patients (46.15%), of which 537 biopsies (19.53%) were clinically significant PCa in 85 patients (38.46%). Histopathological results also included 2036 biopsies (77.33%) with benign prostate tissue, 15 biopsies with prostatic intraepithelial neoplasia (PIN) in 6 patients, 51 biopsies with nonspecific granulomatous inflammation in 5 patients, 12 biopsies with tuberculosis in 1 patient, and 12 biopsies with chronic suppurative inflammation in 1 patient.
The elastic values of benign and malignant biopsies were 31.79 ± 16.17 (ranged from 8.1 to 289.10 kPa) and 114.96 ± 85.25 kPa (ranged from 13.5 to 300.0 kPa), respectively. The stiffness of PCa was markedly higher than benign tissues, which had a statistically significant difference (p < 0.001). The elastic values of different histopathological results were summarized in Table 1, which revealed statistically significant differences in different groups using ANOVA (p < 0.001). Except for the comparison of benign prostate tissue vs PIN (p = 0.695), the other subgroups showed statistically significant differences (p < 0.05).
The Elastic Values of Different Histopathological Results
p < 0.05 compare to inflammation.
p < 0.05 compare to prostatic intraepithelial neoplasia.
p < 0.05 compare to benign prostate tissue.
The ROC curve of elastic value for differentiating benign and malignant prostatic tissue was presented in Figure 4. On basis of the ROC curve with an AUC of 89.5%, a value of 42 kPa was used as the cutoff for differentiating benign from malignant prostatic tissue. At the biopsy level, this produced a sensitivity of 78.97%, specificity of 90.67%, PPV of 71.30%, NPV of 93.66%, and accuracy of 88.03%. For the systematic biopsy (2603 biopsies), this corresponded to a sensitivity of 79.93%, specificity of 90.90%, PPV of 70.57%, NPV of 94.32%, and accuracy of 88.55%. For the lesion biopsy (146 biopsies), this yielded a sensitivity of 70.77%, specificity of 85.19%, PPV of 79.31%, NPV of 78.41%, and accuracy of 78.77%. For clinically significant PCa, it yielded a sensitivity of 66.23%, specificity of 96.11%, PPV of 85.10%, NPV of 89.47%, and accuracy of 88.61%.
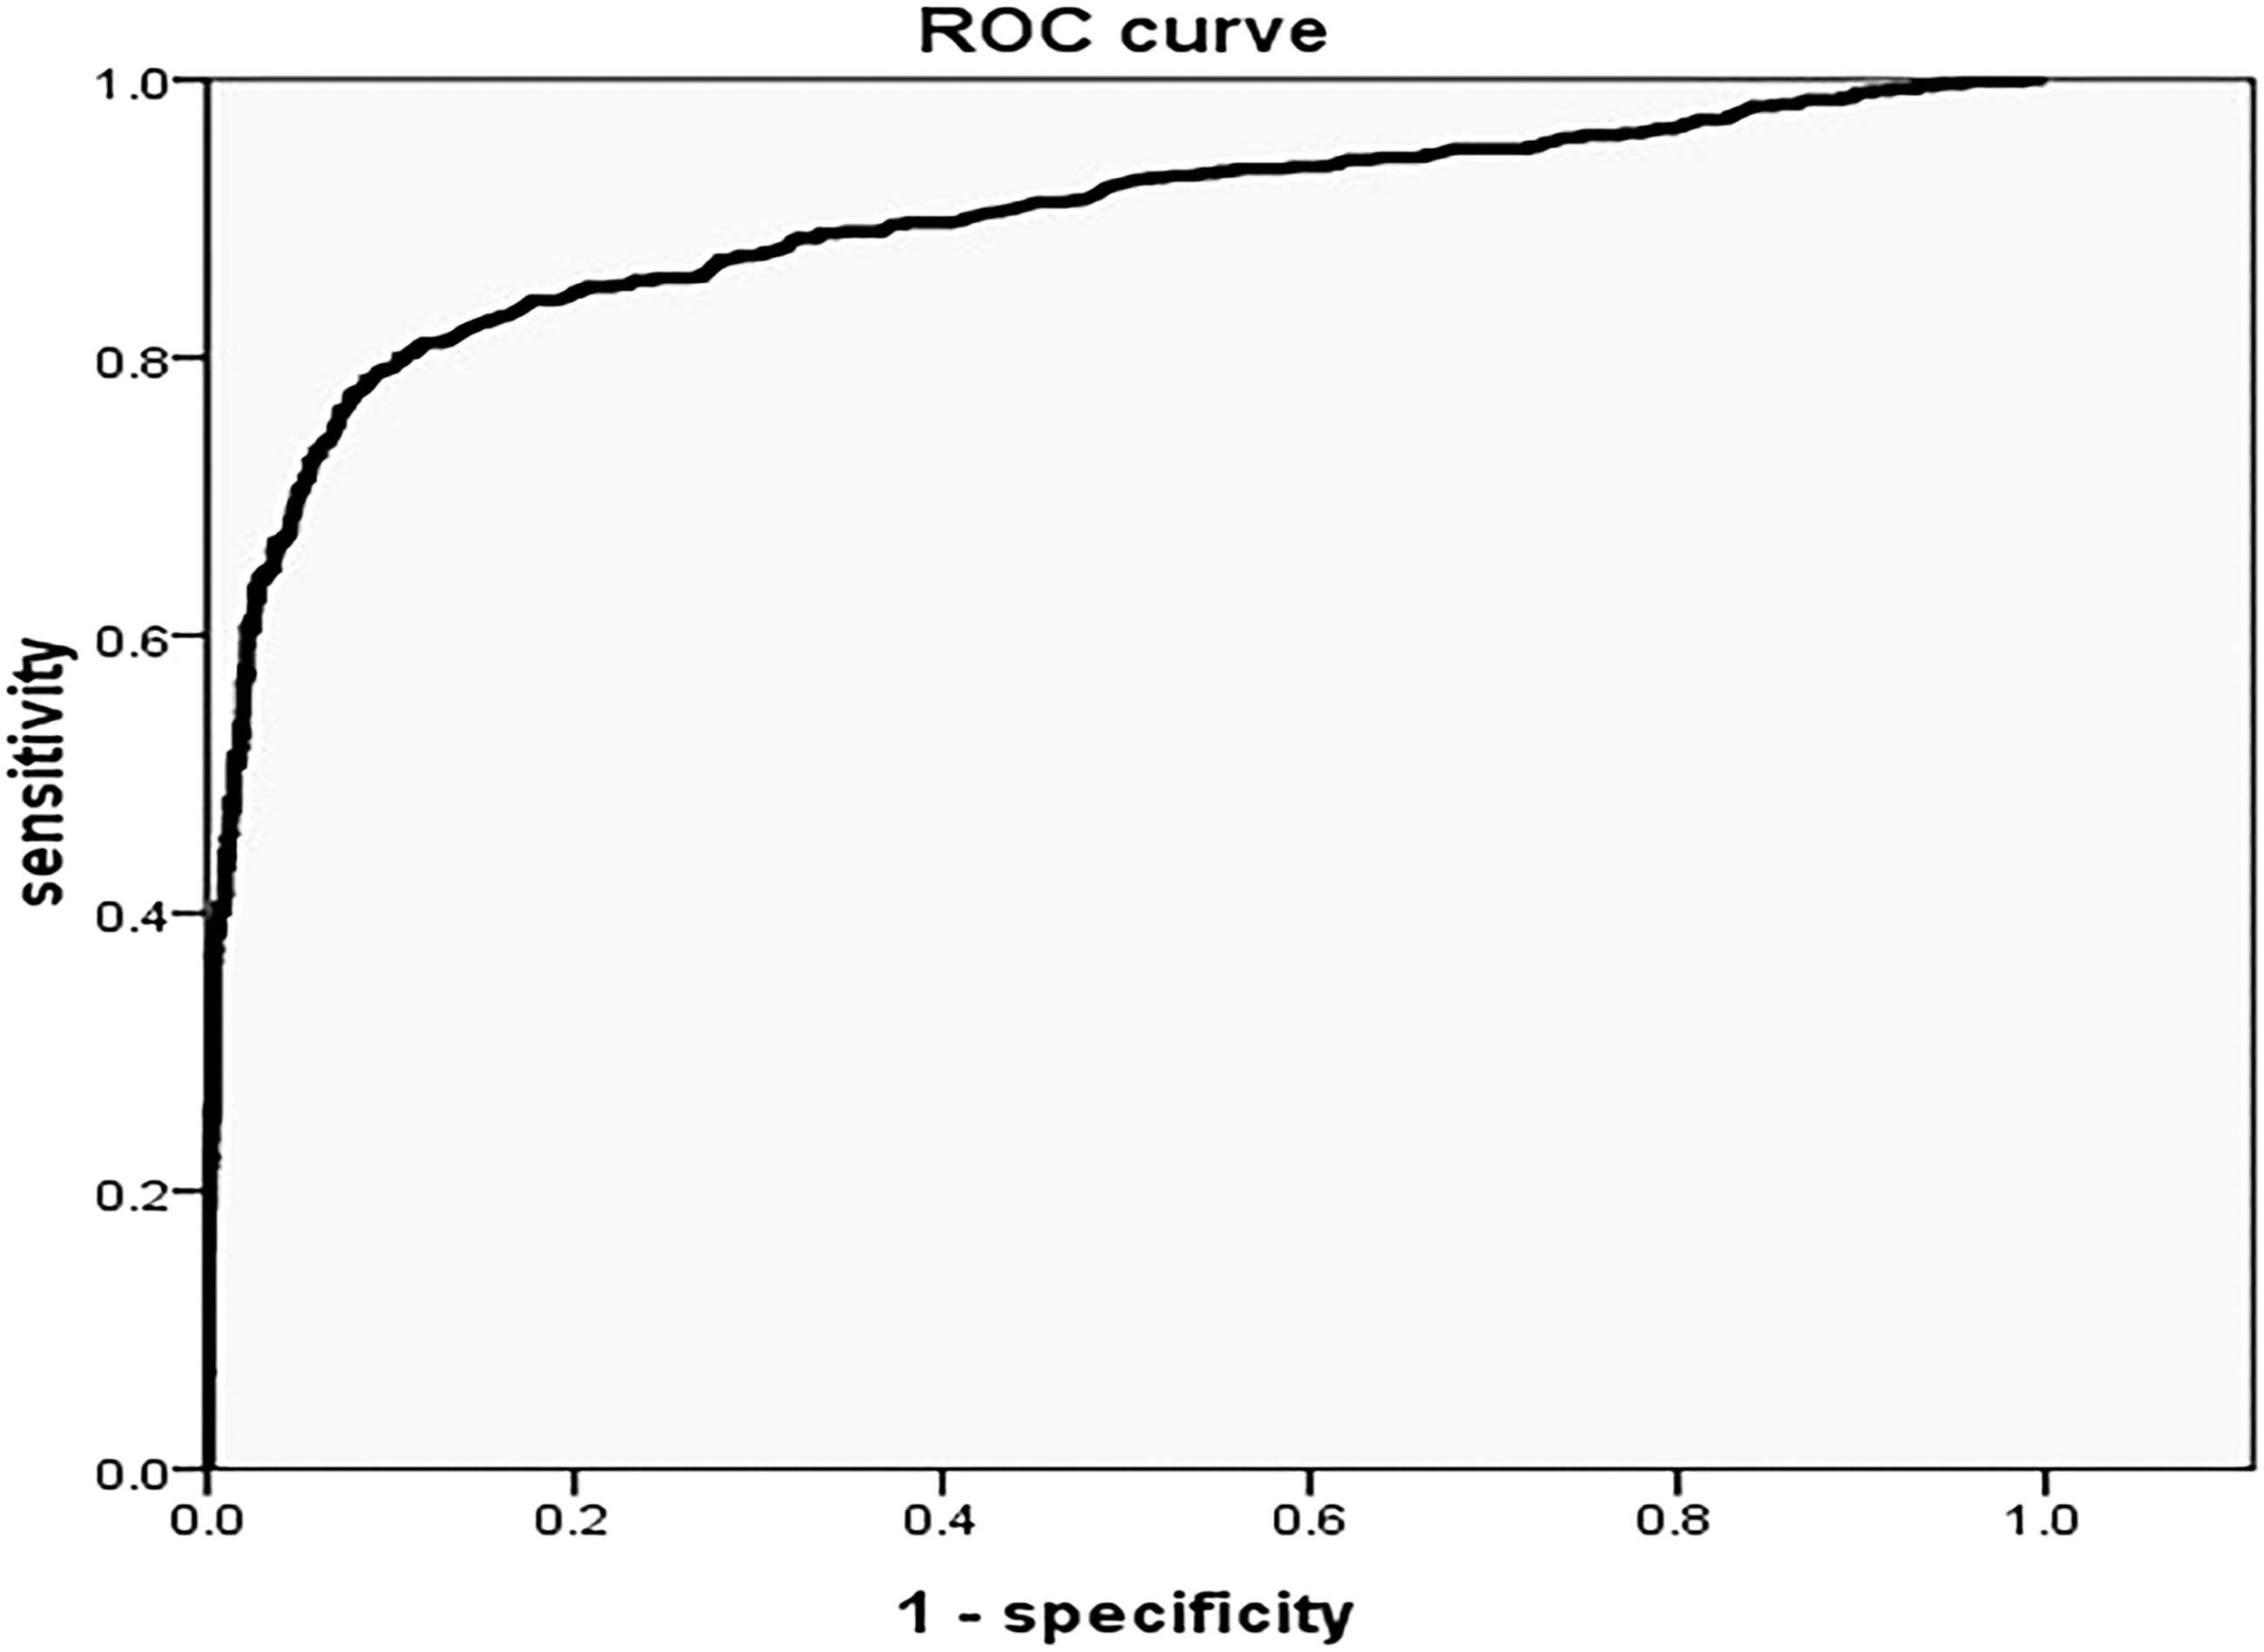
ROC curve for SWE differentiating benign and malignant at biopsy level, AUC was 0.895. With a value of 42 kPa as cutoff, the sensitivity, specificity, positive predictive value, and negative predictive value was 78.97%, 90.67%, 71.30%, and 93.66%, respectively. ROC = receiver operating characteristic.
At the patient level, the elastic value of any biopsy higher than 42 kPa was considered as PCa, the analysis also showed the sensitivity, specificity, PPV, NPV, and accuracy, which were 78.43%, 83.19%, 80.00%, 81.82%, and 81.00%.
The elastic values of different Gleason score, prognostic grade, and percentage of cancer in biopsy were listed in Table 2. The stiffness of PCa increased gradually with the increase of Gleason score, prognostic grade, and percentage of cancer in biopsy, which had statistically significant differences in different groups using ANOVA (p < 0.05). Except for less marked difference between Gleason 8 vs 9 (p = 0.686), there were statistically significant differences in stiffness between the other Gleason score subgroups (p < 0.05). Statistically significant differences in stiffness were found between all the subgroups of prognostic grade (p < 0.05), except for prognostic grade IV vs V (p = 0.847) and prognostic grade I vs II (p = 0.107). The difference of elastic value on the percentage of cancer between 0% and 20% vs 21% and 40% was not obvious (p = 0.154), and the other subgroups of percentage of cancer in biopsy had a statistically significant difference (p < 0.05).
The Elastic Values of Different Gleason Score, Prognostic Grade, and Percentage of Cancer in Biopsy
Gleason score: * p < 0.05 compare to Gleason score 10; # p < 0.05 compare to Gleason score 9; † p < 0.05 compare to Gleason score 8; ‡ p < 0.05 compare to Gleason score 7.
Prognostic grade: * p < 0.05 compare to prognostic grade V; # p < 0.05 compare to prognostic grade IV; † p < 0.05 compare to compare to prognostic grade III; ‡ p < 0.05 compare to prognostic grade II.
Percentage of cancer: * p < 0.05 compare to percentage of cancer 81%–100%; # p < 0.05 compare to percentage of cancer 61%–80%; † p < 0.05 compare to percentage of cancer 41%–60%; ‡ p < 0.05 compare to percentage of cancer 21%–40%.
Rank correlation analysis revealed that the stiffness of PCa had a correlation with Gleason score, prognostic grade, and percentage of cancer in biopsy. The correlation coefficients were r Gleason score = 0.508 (p < 0.001), r Prognostic grade = 0.515 (p < 0.001), and r Percentage of cancer = 0.492 (p < 0.001), respectively.
There were 172 patients who underwent SWE and MRI simultaneously in our study, in which 80 patients were PCa and 66 patients were clinically significant PCa. The results of the univariable and multivariable analyses for each variable for predicting PCa were listed in Table 3. At multivariate binary logistic regression analysis, older age(1.08 [1.03–1.13], p = 0.002), lower free PSA (0.58 [0.34–1.00], p = 0.049), higher PSA density (100.25 [2.26–4454.4], p = 0.017), higher elastic values value (1.02 [1.01–1.04], p = 0.009) and higher PI-RADS score(1.49 [1.04–2.11], p = 0.028) remained independent predictors for diagnosing PCa. No significant interaction was observed on total PSA (p = 0.518) and F/T PSA (p = 0.646).
Multivariate Logistic Regression for Predicting Prostrate Cancer in Peripheral Zone
CI = confidence interval; MRI = magnetic resonance imaging; PI-RADS = Prostate Imaging-Reporting and Data System; F/T = free/total; PSA = prostate-specific antigen; SWE = shear wave elastography; OR = odds ratio.
Following these analyses, the AUC of ROC curve of age, free PSA, PSA density, SWE and MRI for detecting PCa were 0.702, 0.619, 0.766, 0.796 and 0.759, respectively. The AUC of ROC curve of SWE was a little higher than MRI for detecting PCa in peripheral zone, but there was no statistically significant difference by comparing the AUC of ROC curve (p = 0.351). Among these patients, the sensitivity, specificity, PPV, NPV, and accuracy of SWE for predicting PCa in peripheral zone were 73.75%, 78.26%, 74.68%, 77.41%, and 76.16% at the patient level, with the cutoff as 42 kPa. The sensitivity, specificity, PPV, NPV, and accuracy of MRI for detecting PCa in peripheral zone were 75.00%, 70.65%, 68.97%, 76.47%, and 72.67% with PI-RADS score ≥4.
However, for clinically significant PCa, the AUC of ROC curve of SWE and MRI were 0.868 and 0.780, respectively. There was statistically significant difference for diagnosing clinically significant PCa between SWE and MRI by comparing the AUC of ROC curve (p = 0.013). With the cutoff as 42 kPa, the sensitivity, specificity, PPV, NPV, and accuracy of SWE for diagnosing clinically significant PCa in peripheral zone were 84.84%, 66.98%, 61.53%, 87.65%, and 73.83%. The sensitivity, specificity, PPV, NPV, and accuracy of MRI for detecting clinically significant PCa in peripheral zone were 80.30%, 67.92%, 60.92%, 67.92%, and 72.67%.
Discussion
SWE was a very promising technique for detecting and guiding biopsy of PCa, especially for the patients who were suspected of PCa but related image examination was negative. Consistent with most studies reported, the stiffness of PCa is significantly higher than benign tissues with corresponding elastic value of 114.96 ± 85.25 kPa vs 31.79 ± 16.17 kPa, respectively. There was increasing trend in stiffness with elevated Gleason score, prognostic grade, and percentage of cancer in biopsy, all of which had a correlation with the stiffness of PCa, the correlation coefficients were r Gleason score = 0.508 (p < 0.05), r Prognostic grade = 0.515 (p < 0.05), and r Proportion of cancer = 0.492 (p < 0.05), respectively. For PCa, this may be explained by larger lesion, higher cellular density and microvascularization, more stromal reaction, and collagen deposition resulting in stiffer tissue which is more aggressive. 9,29,30
Several studies have reported the capability of SWE for differentiating PCa from benign prostate tissue, making the cutoff from 35 to 50 kPa. 23,25,26,31 Some studies detected PCa using SWE with a nearly perfect sensitivity (90%–96.2%) and specificity (85%–96.2%), 24 –26 and the other studies showed the sensitivity (43%–80.9%) and specificity (69.1%–80.8%) was relatively lower. 23,31 In our study, it yielded a sensitivity of 78.97%, specificity of 90.67%, PPV of 71.30%, NPV of 93.66%, accuracy of 88.03% with the cutoff as 42 kPa. The difference between these studies could be explained due to the difference in patient samples, which had different PSA level, Gleason score, prognostic grade, and size of lesions. Another reason may be due to the different pressure on the prostate by the probe, even if the least amount of pressure was used.
Currently, the positive rate of systematic biopsy only ranges from 25% to 30%, and its false-negative rate varies from 17% to 21% in patients after initially negative biopsies. 32,33 The biopsies guided by elastography could improve the detection rate of PCa than the random systematic biopsy. 29 In our study, there was a 22.67% (623 of 2749 biopsies) positive rate for biopsies at the biopsy level and a 46.15% (102 of 221 biopsies) positive rate at the patient level. If SWE had been used with an elasticity threshold of 42 kPa, the number of biopsies could have been reduced by 72.17% (1789 of the 2479 biopsies), yielding a positive biopsy rate of 62.90% (434 of 690 biopsies).
The high NPV of SWE might reduce the unnecessary invasive procedures, such as systematic biopsy and suspicious lesion with lower elastic value, which could avoid the relative complications and reduce the pain of the patients. Indeed, this analysis showed that 44.80% of the patients (99 of 221) enrolled in this study could have avoided systematic biopsy if SWE had been used for screening patients. For the false-negative biopsies (131 biopsies), there were 51 biopsies(38.93%) with clinically insignificant PCa, 100 biopsies (76.34%) with Gleason score 6 and 7, 79 biopsies (60.31%) with prognostic grade I and II, and 93 biopsies (70.99%) with the percentage of cancer between 0% and 40%. All of these indicated that the stiffness of prostate changed less in clinically insignificant PCa or in PCa with lower Gleason score, prognostic grade, and smaller size.
Since the PROMIS study delivered high-level evidence supporting the use of multiparametric MRI before prostate biopsy, 34 MRI can be used as an upfront screening test. 17 With MRI becoming more common and more widely available, the use of MRI–TRUS fusion-guided biopsy has also increased and shown to yield good results. In the case of previous negative biopsy and continuing suspicion of PCa the use of MRI–TRUS fusion-guided targeted biopsy was recommended. However, some studies did not show significant difference between MRI–TRUS fusion-guided targeted biopsy and systematic biopsy for detecting PCa. 13,14 The potential reason for the failure of MRI–TRUS fusion-guided targeted biopsy included: MRI reader oversight, MRI invisible cancer, inaccurate sampling, and intralesional Gleason Score heterogeneity. 35 Although MRI–TRUS fusion-targeted biopsy is increasingly used to diagnose PCa, further discussion on how to best integrate MRI and fusion-guided biopsy into the diagnostic pathway is still needed. 17
SWE enabled to provide additional information for the PCa detection and biopsy guidance, and it seemed comparable to other imaging modalities like MRI. 31 However, a direct comparison between SWE and MRI for PCa detection was missing at the present time . Only Junker et al. 11 compared real-time elastography with MRI and found that both of them depicted high-risk PCa with high sensitivity. In our study, 172 patients underwent both SWE and MRI simultaneously. As expected, older age, lower free PSA, higher PSA density, higher elastic values, and higher PI-RADS score were independent predictors for diagnosing PCa. There was no statistically diagnostic difference for PCa detection in peripheral zone between them. But for clinically significant PCa, the diagnostic capacity of SWE was a little higher than MRI. It demonstrated that SWE was reliable to MRI for PCa detection in the peripheral zone of prostate. However, our study only focused on the peripheral zone of prostate, not including the transitional zone. There was no denying that MRI had advantages in tumor stage assessment and the detection of PCa in the transitional zone compared with elastography. 11
There were several limitations in our study. First, the peripheral zone of prostate was focused in our study, not including the transitional zone and central zone, which were complex and deep. 26 In young patients without prostatic disorders, the peripheral zone, transition zone, and central zones were all coded in blue with a very homogeneous pattern. With the development of benign prostatic hyperplasia, the peripheral zone remains soft, whereas the transition zone becomes heterogeneous and hard, with a heterogeneous color pattern and elasticity values ranging from 30 to 180 kPa. 9 In addition, the transition zone often contains calcifications, all of which make it difficult for differential diagnosis from PCa. In addition, with the development of benign prostatic hyperplasia, the transitional zone and central zone became relatively deep, the SWE technology restricted the penetrated depth of shear wave pulse in the tissue only 3–4 cm, and the accurate SWE data in the anterior of prostate could not be obtained if the volume was larger. Nevertheless, 70%–80% of PCa arise in the peripheral zone, 27 and the systematic biopsies are performed mainly in the peripheral zone for PCa detection. Therefore, we limited our interpretation to the peripheral zone.
Second, there was a small proportion of patients with PIN and inflammation diseases, and this may have led to insufficient statistical power. Third, the MRI of prostate only included T2W1 and DWI, not including dynamic contrast enhanced. Fourth, the histopathological results obtained from biopsy were used as the golden standard for PCa detection in our study. There might be a risk that it was false negative in patients confirmed as benign prostatic tissue or underestimated in terms of Gleason score, prognostic grade in patients diagnosed as PCa.
Conclusion
SWE could provide an additional characterization of abnormal area detected on conventional ultrasound and detect the lesions invisible on other imaging. It also could increase the diagnostic positive rate of PCa in targeted biopsy and reduce unnecessary biopsies. The stiffness of PCa in peripheral zone correlates with the Gleason score, prognostic grade, and percentage of cancer in biopsy. There was no statistically significant difference for diagnosing PCa in the peripheral zone between SWE and MRI. However, for clinically significant PCa, the diagnostic capacity of SWE was a little better than MRI.
Footnotes
Author Disclosure Statement
No competing financial interests exist.
Funding Information
This study did not receive any specific grant from funding agencies in the public, commercial, or not-for-profit sectors.