
Abstract
Purpose:
Robotic partial nephrectomies (RPNs) by their nature are associated with renal volume loss. Our goal of this study is to examine renal volume loss over time post partial nephrectomy.
Materials and Methods:
Fifty patients were followed for 1-year post-RPN with two-layer renorrhaphy and the sliding clip technique. This was done with a preoperative CT scan to assess renal mass and location. Patients post-RPN were imaged at time points 3 days, 6 months, and 12 months.
Results:
Patient demographics were 82% men with a median (interquartile range [IQR]) age of 57 (45–67) years and all were of Japanese descent. The medians (IQR) for warm ischemia time were 18 minutes (14–22), total operative time was 181.5 minutes (169.3–218.5), and estimated blood loss was 20 mL (10–50). The tumor characteristics had a median (IQR) diameter of 2.8 cm (2.5–3.4) with a RENAL score of 7 (6–8). The renal CT showed median (IQR) volume losses at 3 days of −1% (−7.1, 1.8), at 6 months of −15.3% (−20.6, −11.2), and at 12 months of −16.3% (−19.0, −12.8). Significance was seen at the 3 days to 6 months comparison for volume loss (p < 0.0001). Mean (standard deviation) estimated glomerular filtration rate (GFR) losses were as follows: at discharge 0.5% (12.9), 1 month −6.4% (11.8), 6 months −4.6% (9.8), and 12 months −3.6% (11.9). Statistical analysis showed significance for GFR loss at the comparison between discharge to 1 and 6 months (p = 0.01, p = 0.04).
Conclusion:
The initial volume loss seen postsurgery from resected healthy tissue was not significant and only became relevant at longer time points, suggesting that loss could be from atrophy. Volume loss over time supports the hypothesis that suture renorrhaphy is a primary cause of volume loss when warm ischemia time is <25 minutes.
Introduction
Robotic partial nephrectomies (RPNs) are the standard treatment for small renal masses. Emphasis is placed on minimizing renal volume loss in an attempt to retain as much renal functionality as possible while removing the tumor. But even with minimizing healthy tissue margins (<5 mm) and ischemia time (<25 minutes), renal volume losses are near 20% in some surgical series. 1,2 Most of the research in this field has been in probing the relationship between hilar clamping/enucleation and volume loss postsurgery, but consequently, there have been fewer articles investigating suture renorrhaphy as a possible cause. 3 Base layer plus sliding clip cortical renorrhaphy was the reconstruction techniques used on these patients.
In a previous matched retrospective study, we saw that in a comparison between cortical plus base layer renorrhaphy vs base layer only, it was found that base layer only renorrhaphy led to a smaller volume loss (17% vs. 9%, p = 0.003). 3 –5 In addition, atrophy from hilar clamping was not suspected because of the median warm ischemia time was <20 minutes and minimal resection volumes. 2 The focus of this study is to examine how renal volume is lost with respect to time, as this is not well understood. In this study, we utilize CT images at three time points (3 days, 6 months, and 12 months) postsurgery over 1 year to monitor renal volume loss. Our hypothesis is that volume loss from resection would be immediate and volume loss from suture renorrhaphy would require a longer time for the tissue to atrophy.
Materials and Methods
Population
The population used for this data set was collected between April 2013 and March 2015 by the Department of Urology at Tokyo Women's Medical University. The sample was similar to other published studies regarding age and gender. Tumors <2 cm or patients with postoperative pseudoaneurysms, which could be another cause of renal volume loss, were excluded from the data set. 4,6 The margins from surgical resection were ∼5 mm. The reconstruction technique used was base layer and sliding clip cortical renorrhaphy. This study was approved by the institutional review board.
CT volume calculations
CT scans were done at 3 days to evaluate for subclinical bleeding and followed up by two additional times 6 and 12 months post-RPN. Three-dimensional (3D) models of kidneys were formed through the Philips Intellispace Portal or OsiriX MD software. Slice-by-slice semiautomatic segmentation was used to determine the presurgical tumor volumes and renal parenchymal volumes. The algorithm settings were adjusted to detect the enhancing mass and the postoperative scarring from surgery. Thus, we were able to quantify the volumes of healthy renal tissue lost at multiple time points and calculate relative volume loss over time. Figure 1 shows the selection of the renal parenchyma that is used to create the 3D models for calculations of volume loss.
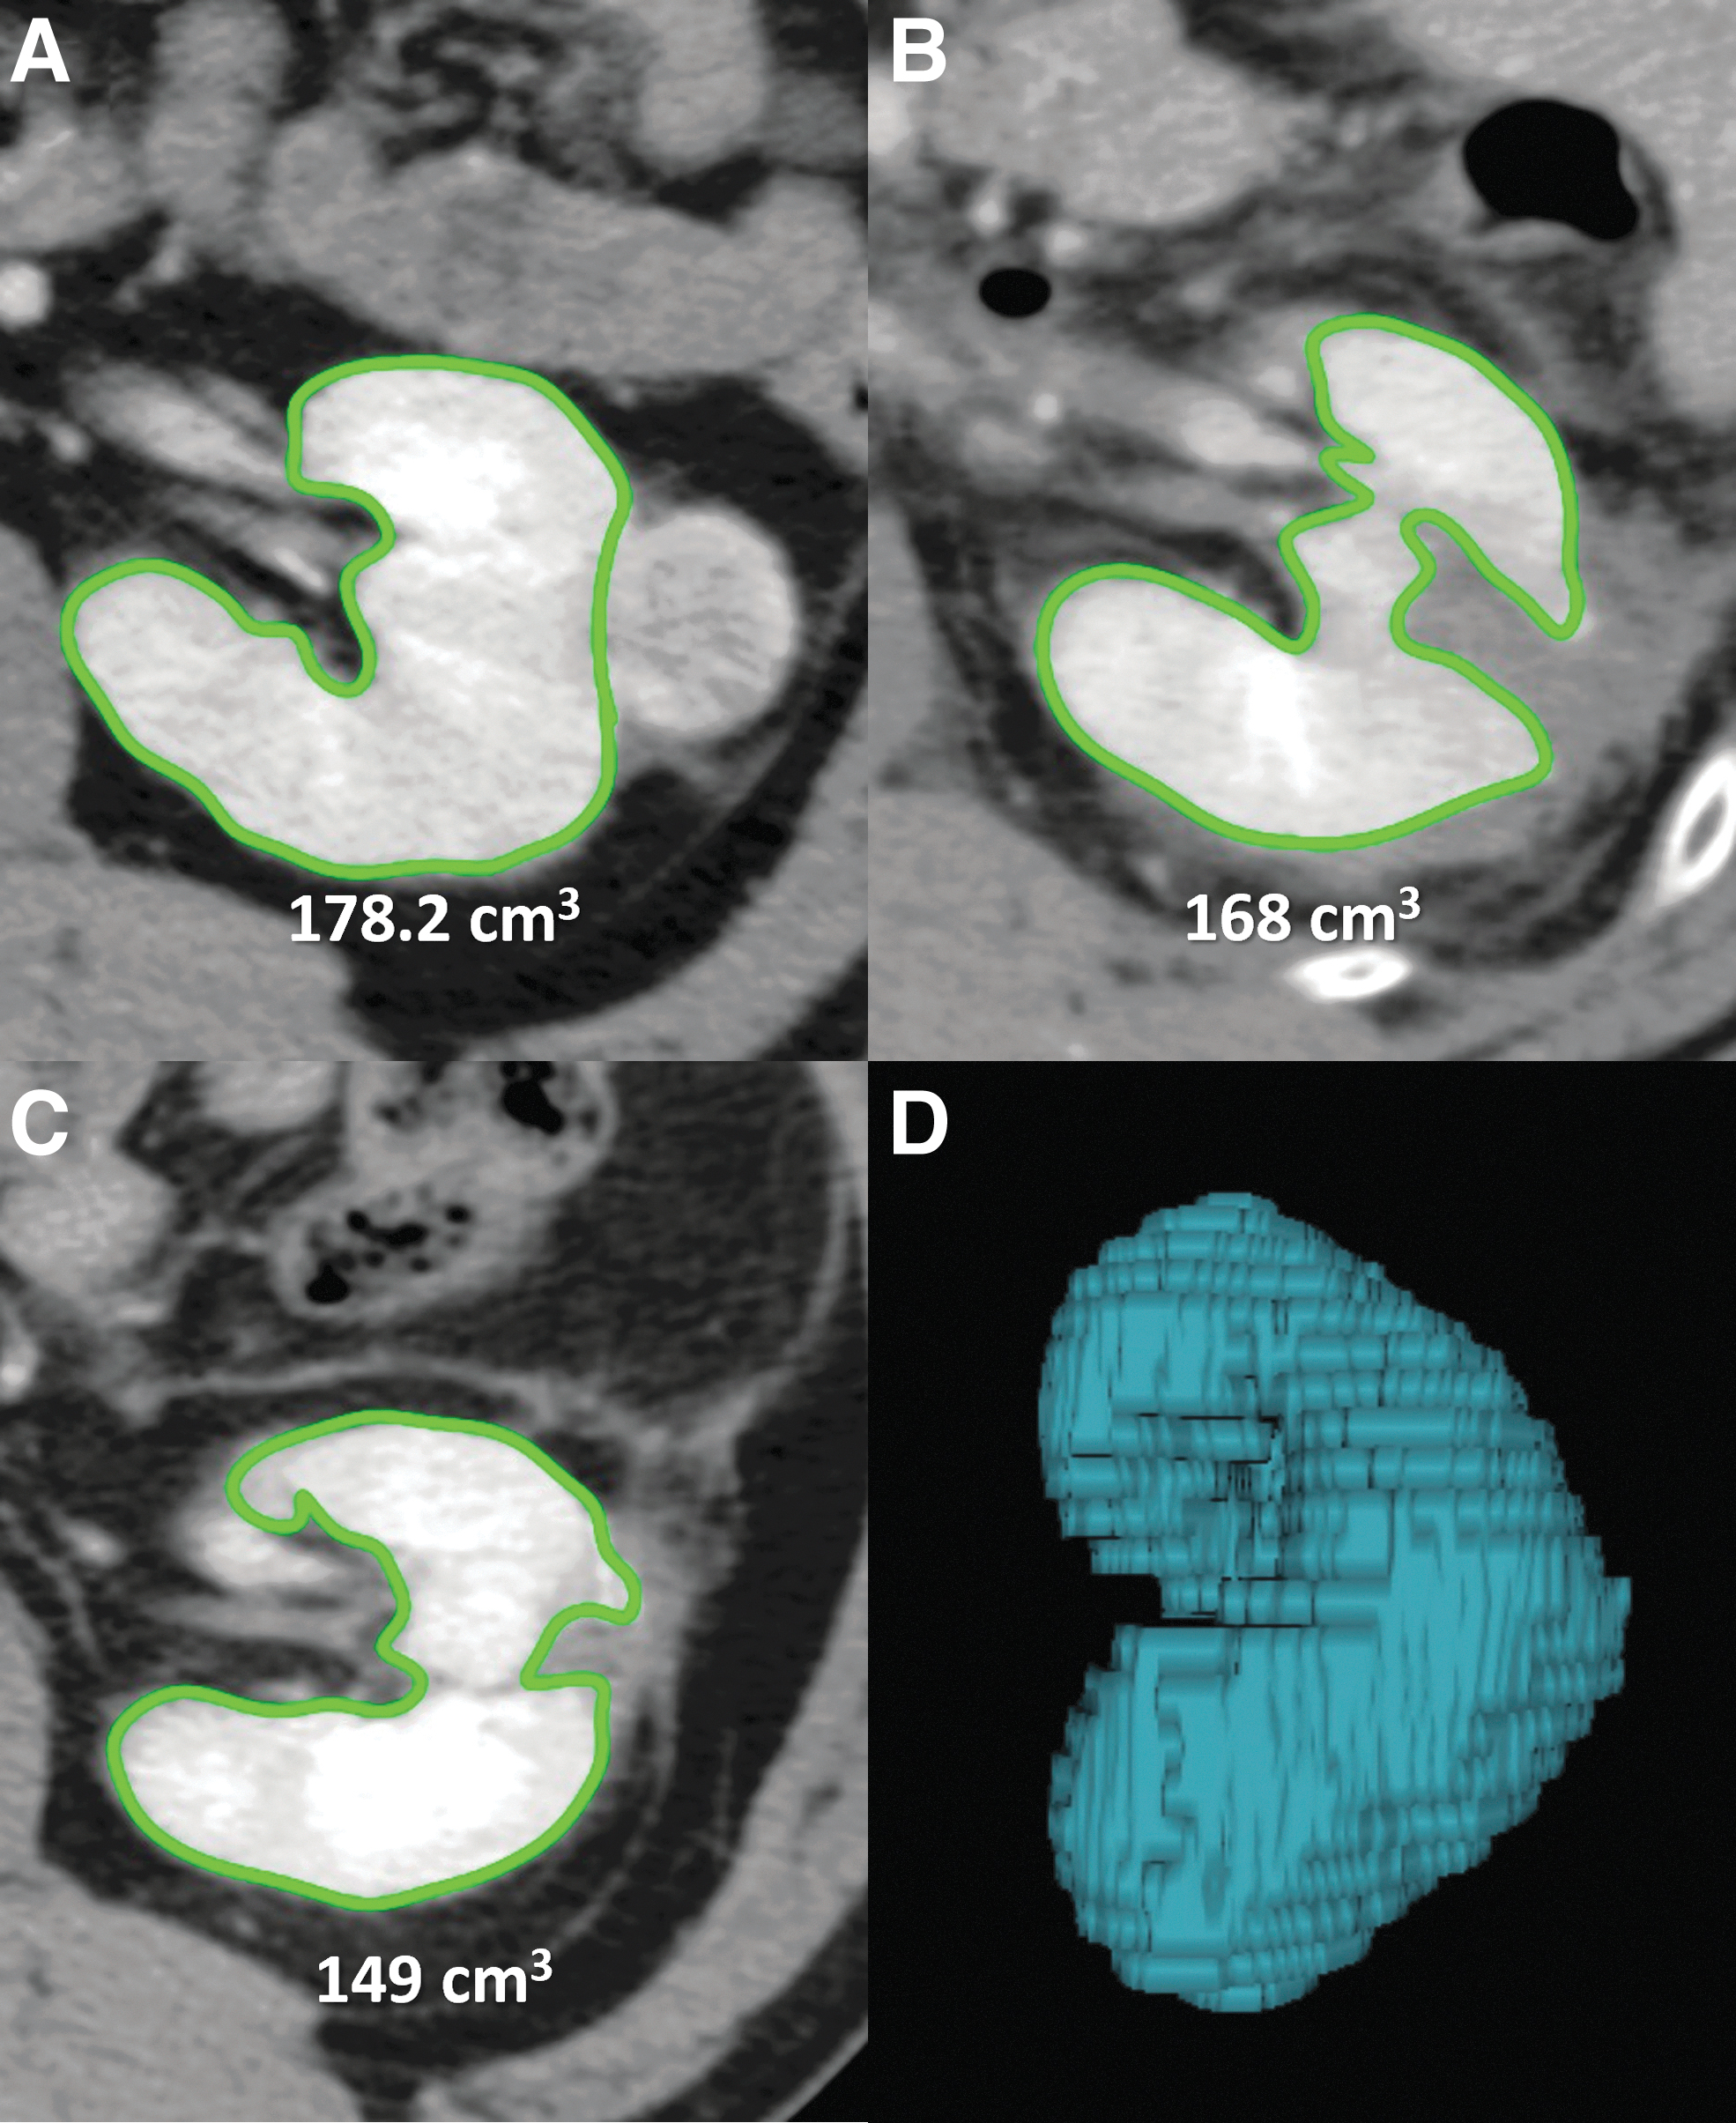
CT imaging of the abdomen. The selected sections indicate the renal parenchyma during contrast infusion at three timepoints with estimated renal volumes.
Surgical procedure and perioperative care
The RPN procedure used for these patients was previously described in Takagi et al. 7 For all cases in this study, all known arteries were clamped under warm ischemia, followed by tumor excision and reconstruction through two-layer renorrhaphy. Barbed sutures were used to place the inner running suture. Earlier in the studies, renorrhaphy was done before unclamping of renal arteries, but from November 2013 onward, the renal arteries were unclamped after the placement of inner sutures to ensure arterial hemostasis.
This was followed by the second layer cortical renorrhaphy. 8,9 In both cases, TachoSil® (CSL Behring, King of Prussia, PA) bolsters were used to fill the large parenchymal defects. The surgical approach (transperitoneal or retroperitoneal) was chosen based on the tumor location. All surgeries were performed by board-certified robotic surgeons and the enhanced recovery after surgery protocol was used for postoperative care. 10,11
Estimated glomerular filtration rate calculations
Serum creatinine measurements were taken at discharge, 1, 6, and 12 months follow-ups. From these measurements, estimated glomerular filtration rate (eGFR) was estimated using the modified diet renal disease equation for Japanese patients as proposed by the Japanese Society of Nephrology (Equation 1).
12
The relative GFR loss calculations were done comparing the eGFR in question (i.e., 3 days) with the original preoperative eGFR for that patient.
Statistical analysis
GraphPad Prism 9 was used to perform descriptive statistics, normality tests, Mann−Whitney U-tests for volume loss, and paired t-tests for GFR loss.
Results
Patient demographics and pathology analysis
Table 1 gives the demographics of the 50 patients pre and post-RPN. These patients were mostly men (82%) of Japanese descent with the median age being 57 (interquartile range [IQR]: 45–67) years. Table 2 represents the operative outcomes including urine leakage (2%), drains placed (52%). The following are the median values for surgical factors: estimated blood loss 20 mL (IQR: 10–50), total operating time 181.5 minutes (IQR: 169.3–218.5), and warm ischemia time 18 minutes (IQR: 14–22).
Demographics
IQR = interquartile range.
Surgical Intervention Results for Robotic Partial Nephrectomies
eGFR = estimated glomerular filtration rate.
The tumor characteristics showed a median diameter of 2.8 cm (IQR: 2.5–3.4) with a median RENAL score of 7 (IQR: 6–8). The Fuhrman grades for the data set were mostly grades 2 (80%) and 1 (12%) with a small set of grades 3 (6%) and 4 (2%). In addition, pathology analysis of the tumors was mostly renal cell carcinoma clear cell (88%) with a majority being staged at pT1a (90%) and a small minority of pT1b (10%), no nodal or distal metastasis.
Volume and GFR loss over time
Normality tests for the 50 patients post-RPN showed that the volume loss data were skewed and the GFR loss data were normal. Accordingly, analysis was done using the Mann−Whitney U-test for the non-normal volume loss data and a standard t-test for the normal GFR loss data. Figure 2 and Table 3 summarize the findings from this analysis. Figure 1A shows volume loss for 3 days (n = 50), 6 months (n = 50), and 12 months (n = 20). Mann−Whitney U-test shows a significant volume loss between the 3 days and 6 months timepoints (p < 0.0001).

Volumetric and Functional Losses
Limited to 20 with available CT scan.
GFR = glomerular filtration rate.
There is a 14.3% change in volume loss between the data points. Further analysis shows no significance in the 6- and 12-month times (p = 0.7109). Figure 1B shows GFR loss for discharge (n = 48), 1 month (n = 45), 6 months (n = 47), and 12 months (n = 45). Analysis shows statistical significance from the unpaired t-test at the 1 and 6 months timepoints in comparison with discharge values (p = 0.01, p = 0.04).
Discussion
The main hypothesis tested in this analysis was that the majority of renal volume loss would be measured over time because of delayed tissue atrophy. 13 Many possible causes of volume loss have been investigated in prior studies such as warm ischemia time, reconstruction type, and healthy resection quantity. In the proposed study, we hypothesized that the sutures from the two-layer renorrhaphy could be a cause of delayed volume loss.
The 3-day postsurgery CT scan gave information on possible aneurysms and provided data on volume loss caused by excision. The initial volume loss seen at 3 days was 1.0% loss compared with the original volume. This supports the hypothesis that there was a minimal loss from excision, which should be immediately detected on postoperative imaging. Although information on healthy margins was not recorded, the attempted margin of healthy kidney removed with the tumor was 5 mm. 14
The median overall warm ischemia time given in Table 2 was 18 minutes (IQR: 14–22), well within published recommendations for warm ischemia time <22.5 minutes. 5,15 Further analysis of the data demonstrated a highly significant (14.3%, p < 0.0001) volume loss when comparing between 3 days and 6 months postoperatively, see Figure 1A. In addition, there is a stabilization of volume loss after 6 months as the median value stays relatively constant between the 6 and 12 months postoperatively (p = 0.71).
Since volume loss from devascularization is associated with parenchymal loss, it would also be of interest to examine how GFR changes over time. 13,16 Analysis of average relative GFRs for patients post-RPN shows a negligible loss at discharge. This is likely because of renal compensation from the other kidney and intravenous hydration. 17 As time progressed at the 6-month time point, we saw a drop in GFR (3.1%) relative to the preoperative GFR. The discharge and 6-month time points were tested and they showed statistical significance (p = 0.01). Similar to the volumetric loss, there is a stabilization of GFR loss as time progresses. The follow-up t-test comparing the 6- and 12-month time points shows no significance (p = 0.71).
In a study by Dong and colleagues., they reported on an analysis of 168 partial nephrectomy cases and their comparison showed that parenchymal loss was associated with excision and delayed loss was because of devascularization (9 cm3 vs. 16 cm3, p < 0.001). 5 Devascularization from renorrhaphy was strongly associated with functional outcomes and would be seen at later time points vs excision that would present earlier. The results from the study by Dong et al. correlate well with those of the current study. There was minimal immediate volume loss followed by significant devascularized volume loss over time likely caused by cortical renorrhaphy. 5
In studies done by Simmons, Fergany, and Campbell, they concluded that the GFR is transient in the postoperative time, but the overall long-term function is based on presurgical function and volume of renal tissue preserved. 13,15 This coincides well with what was seen in this study. As renal parenchymal volume atrophies, functional capacities decrease, which is followed by stabilization and improvement in GFR.
Limitations included that these data were only for two-layer renorrhaphy utilizing the sliding clip technique. Enucleation or interrupted suture renorrhaphy techniques were not studied. 19 There is the possibility of postoperative renal hyperemia or edema that could artificially elevate the 3- to 4-day volume measurement, although it appears to be minimal. Precise measurement of the healthy resected margin was not available for these procedures. However, the surgeons approximate this to be 5 mm. 14 In addition, the data were taken from a single tertiary medical center and not randomized.
For the 12-month post-RPN time point, there were 20 scans completed. Ideally, a method that could produce more time points would allow for a more specific model and more patient sources would increase the normality of data. 20 In future studies, it may be beneficial to do additional studies examining temporal renal volume loss without suture renorrhaphy or with different suture renorrhaphy techniques.
Conclusion
In conclusion from the analysis of these retrospective data, we found that volume loss after RPN is not seen immediately after surgery but is measurable by 6 months. This supports the hypothesis that cortical renorrhaphy with delayed atrophy causes renal volume loss. When evaluating renal function after RPN, it is important to control for warm ischemia time, healthy resection volume, and reconstruction type.
Footnotes
Authors’ Contributions
R.P. oversaw data analysis and writing of the article. C.P.S. edited the article. T.K. edited the article and collected data. C.D.B. carried out editing of the article, hypothesis conceptualization, and data analysis.
Author Disclosure Statement
No competing financial interest exist.
Funding Information
No funding was received for this article.