
Abstract
Purpose:
To evaluate whether computer program-estimated urolith stone volume (SV) was a better predictor of spontaneous passage (SP) compared with program-estimated stone diameter (PD) or manually measured stone diameter (MD), and whether utilizing SV and MD together provided additional value in SP prediction compared with MD alone.
Materials and Methods:
Retrospective analysis of patients with acute renal colic and single renal/ureteral stone on CT from July 2017 to April 2020. Diameter obtained from radiology reports or manually measured when report not available. Semiautomated stone analysis software (qSAS) was used to estimate SV and PD. ROC analysis was performed to compare accuracy of SV vs MD vs PD in predicting SP by 2, 4, and 6 weeks. Subgroup analysis was performed by stone size (</≥6 mm) and location (proximal/distal).
Results:
Among 172 patients analyzed, SP occurred in 71 (41%). Patient age (mean 53), gender (38%F), and stone history/side did not differ significantly by SP. Average MD, PD, and SV were significantly smaller among SP stones vs stones requiring surgery (MD 4.3 mm vs 8.0 mm, PD 5.5 mm vs 9.4 mm, and SV 40 mm3 vs 312 mm3; p < 0.001). ROC analysis showed significantly higher area under curve (AUC) for SV for predicting SP by 4 and 6 weeks compared with MD and PD (AUC 0.93 vs 0.86 vs 0.85 4 weeks, p < 0.001; 0.92 vs 0.85 vs 0.86 6 weeks, p < 0.003). AUC difference between SV vs MD was much greater among stones ≥6 mm or proximal stones. Utilizing SV and MD together yielded improved positive predictive value and negative predictive value for SP prediction.
Conclusions:
SV is a more accurate predictor of SP compared with linear stone dimensions, especially in the setting of larger and/or more proximal stones. Utilizing SV and diameter together yielded improved SP predictions compared with using either metric alone. Prospective studies are indicated to investigate the clinical utility of SV for SP prediction.
Introduction
Nephrolithiasis is a common urologic condition with significant prevalence and morbidity that is routinely diagnosed through noncontrast CT. 1 –4 Among measurable parameters on CT, stone size is important in guiding management discussions, especially that of surgery vs observation. 3 –5 The majority of stones ≤5 mm have been shown to pass spontaneously within 40 days, whereas those >5 mm often require urologic intervention. 3,6,7
Despite the importance of stone size in guiding clinical management, there remains little consensus on technical measurement. Most commonly, stone sizes are manually measured by the interpreting physician as one-/two-dimensional measurements such as width, greatest diameter, or surface area. 7 –10 However, these approaches are limited by significant variability in manual measurements across different reader/software settings 8,11 and inadequate anatomic representation because of stones' irregular three-dimensional nature. 9,11 Computer program-estimated stone volume (SV) has recently been implemented as an alternative metric for guiding nephrolithiasis management. 8,9,11 –13 Several studies have suggested that three-dimensional SV is a better predictor of spontaneous stone passage (SP) than linear measurements such as stone diameter, and that the combination of diameter and volume further improves SP prediction. 8,9,12
In this study, we performed a retrospective review of clinical data to evaluate whether computer program-estimated urolith SV was a better predictor of SP compared with linear program-estimated stone diameter (PD) or manually measured stone diameter (MD). Specifically, we hypothesized that the comparative advantage of SV would be more pronounced in the context of larger stones.
Materials and Methods
Patient population
After approval by the local Institutional Review Board No. 800869, we retrospectively reviewed patients in our urology clinic with a diagnosis of nephrolithiasis between June 2017 and April 2020 who had recently presented to the emergency department (ED) with acute symptomatic renal colic (such as flank or abdominal pain, nausea or vomiting) and a single renal or ureteral stone seen on CT imaging with subsequent follow-up to manage the stone. Among the 386 patients who met initial criteria, 172 patients were identified who had solitary stones with CT imaging suitable for computer measurement.
SP and time to passage
Stone passage was defined by symptom resolution and (1) no stone seen on follow-up CT scan or resolution of hydronephrosis in a patient with previously obstructing stone with hydronephrosis; or (2) patient observation of stone passage. Time to passage was counted from initial ED presentation to date of either stone passage per patient report (as noted in the chart) or symptom resolution and negative follow-up imaging. If patient could not recall a specific date, then the time until negative imaging study was used. Time to passage was evaluated as a categorical variable indicating passage by 2, 4, and 6 weeks. Patients were excluded from analysis at a specific time point if they underwent surgical intervention or passage before the time point.
Image review
Radiology reports associated with each CT scan were queried to obtain the MD. Of the available reports, 107 (78%) reported one-dimensional stone diameters, 23 (17%) provided two dimensions, 4 (3%) reported three dimensions, and 4 (3%) made no mention of stone size. For reports of two- or three-dimensional stone sizes, the greatest dimension was taken as the stone diameter. For CT images with no existing stone size measurements or no radiology reports available (n = 38), longest stone diameter was manually measured.
SV was objectively measured using quantitative Stone Analysis Software (qSAS) developed by the CT Clinical Innovation Center. 14,15 qSAS is a semiautomated software system that generates standardized reports on kidney stone diameter, location, and volume. It employs an adaptive threshold method for stone measurement that enables accurate identification of both pure and mixed stones with varying densities (Fig. 1). All stones within a region of interest identified by the user are automatically found and measured (Fig. 1). 16
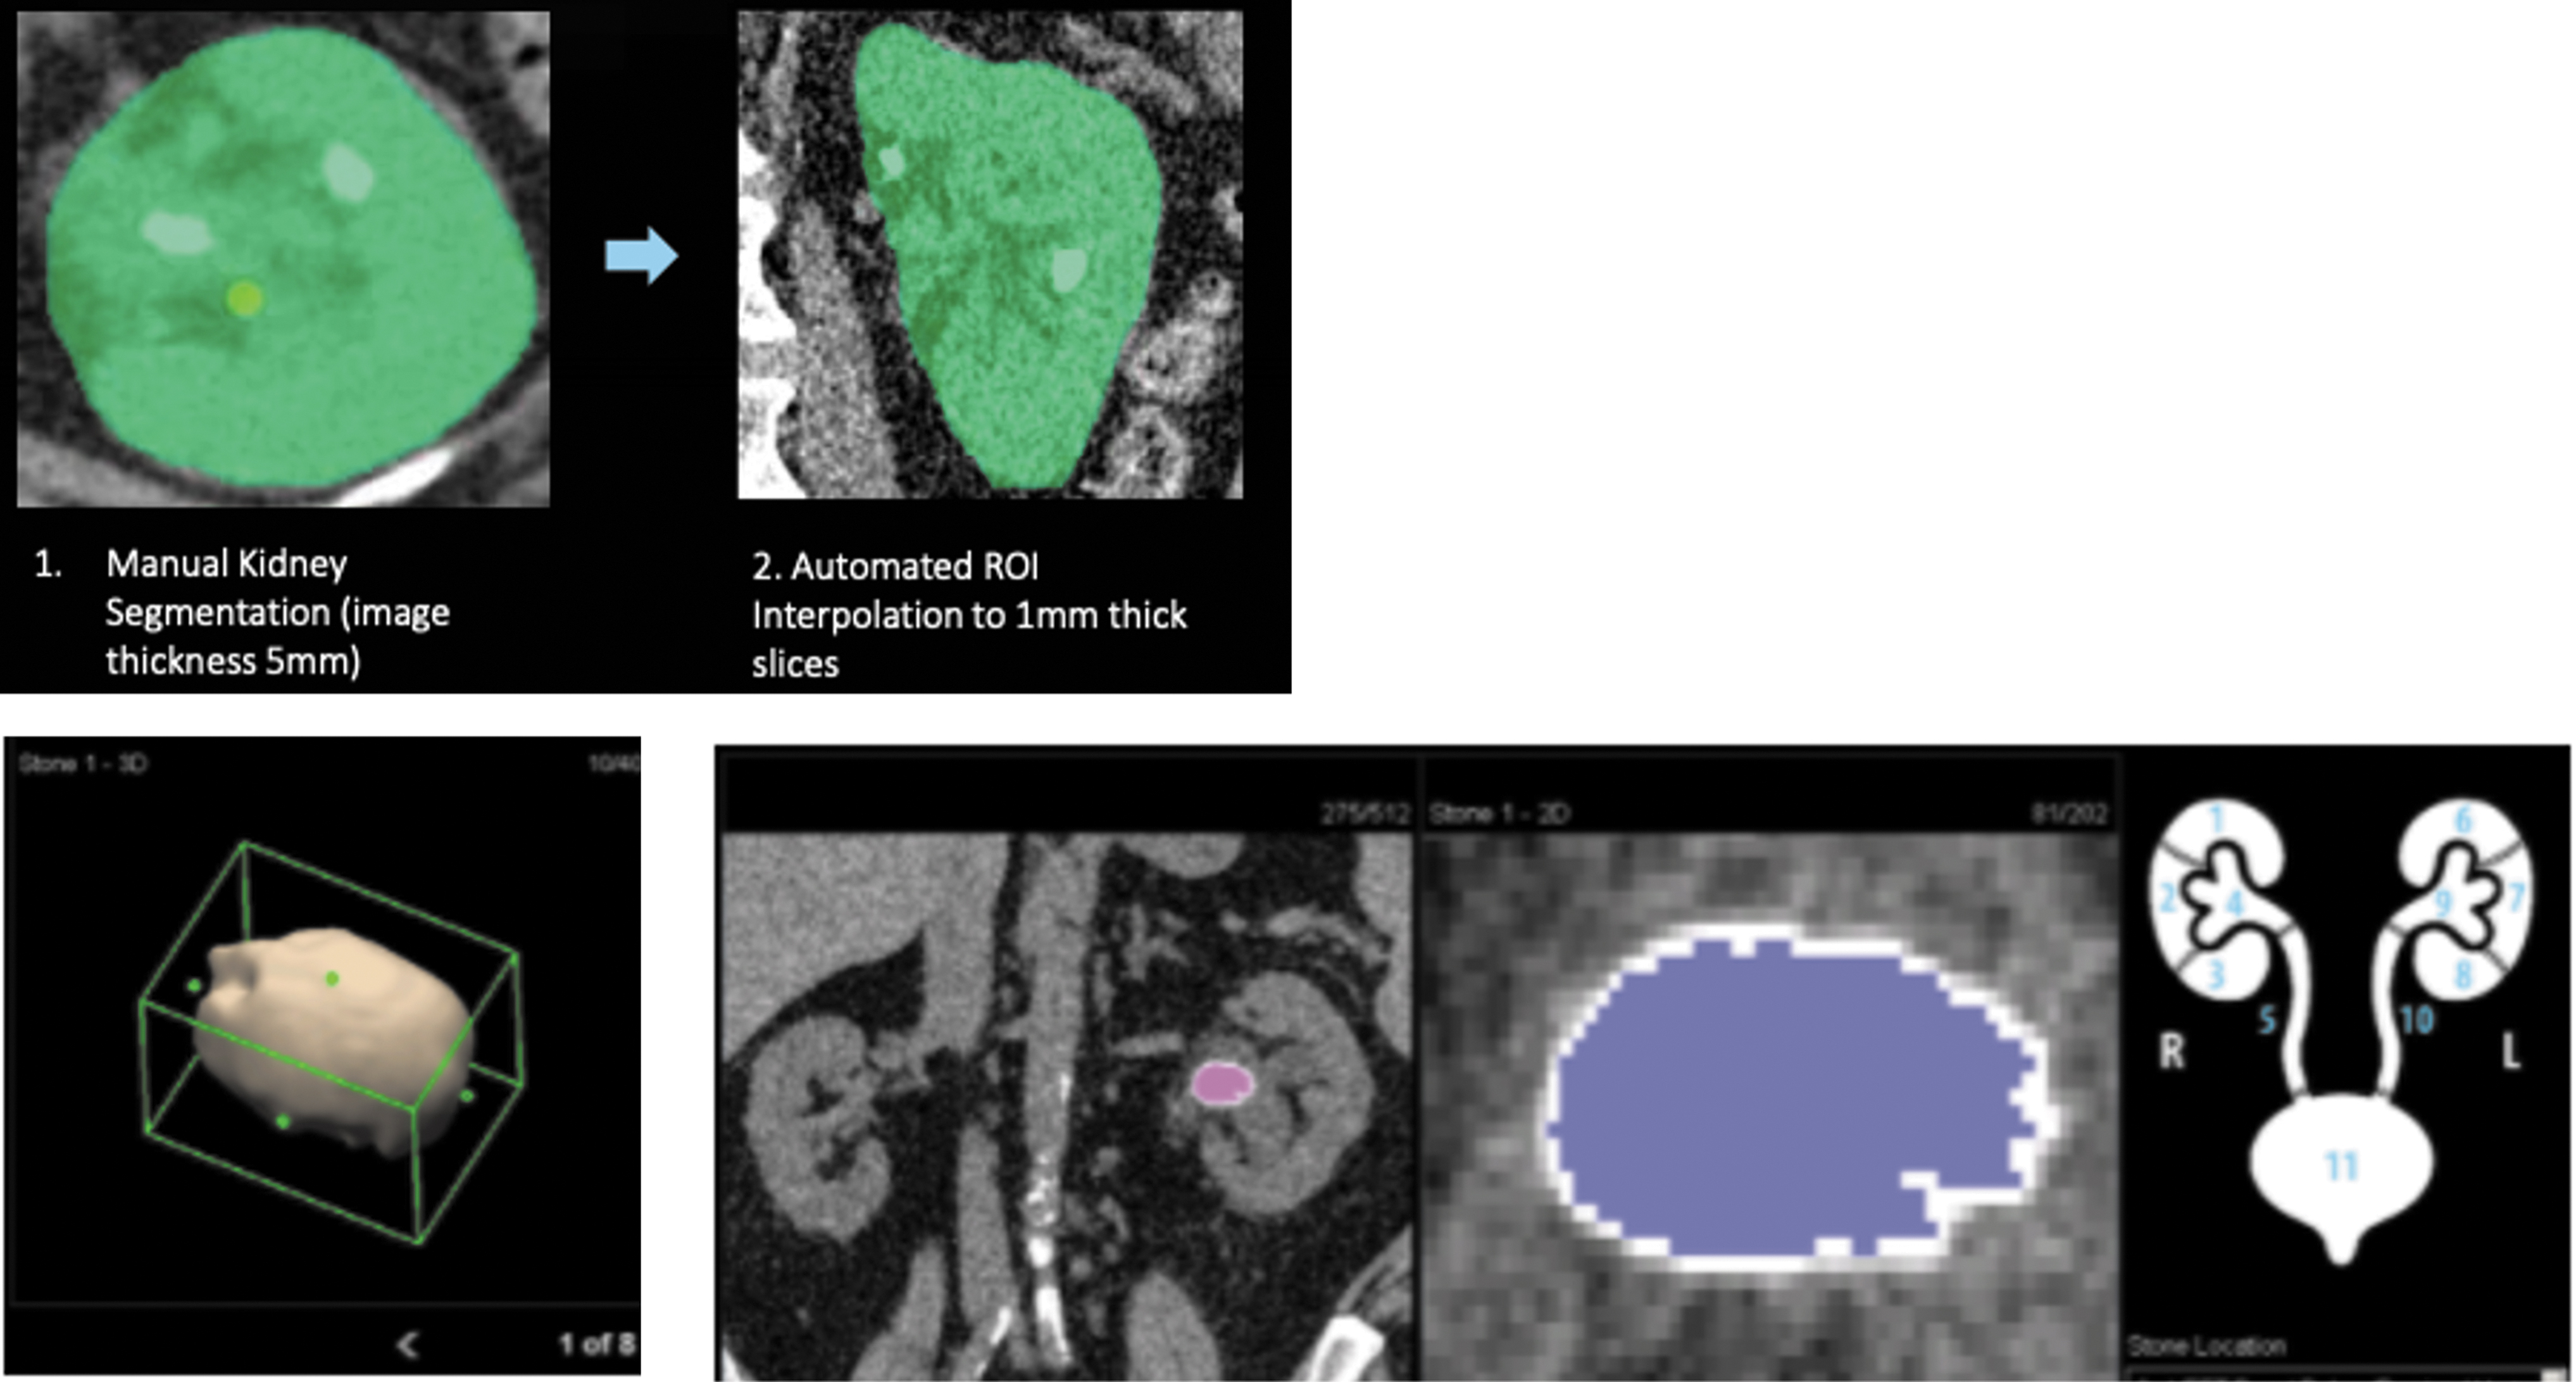
qSAS program interface and methodology. qSAS = quantitative Stone Analysis Software. Color images are available online.
Statistical analysis
Statistical analysis was performed in STATA, version 14.1 (StataCorp., 2019). Comparisons between patients used Wilcoxon rank sum test (continuous) and Fisher's exact test (categorical).
Main explanatory variables were MD, PD, and SV, and outcomes include SP by 2, 4, and 6 weeks. To identify predictors of SP, stepwise backward logistic regressions were performed using predefined covariates, including patient age, gender, stone location (proximal or distal), density, and hydronephrosis status (none, mild, or moderate–severe based on available imaging). Stones in the kidney, ureteropelvic junction, or ureter above the pelvic brim were labeled proximal, whereas ureteral stones in below the pelvic brim were labeled distal. The average Hounsfield unit as estimated by qSAS was used as a measure of stone density. Finally, hydronephrosis status was obtained from the radiology reports.
Receiver operating characteristics (ROC) were calculated, and a subgroup analysis was performed by stone location (proximal, distal) and size (<6 mm, ≥6 mm). 6 mm was determined to be the optimal cut point using the Youden index method. 17,18 Finally, continuous net reclassification analysis was performed to characterize the incremental value of SV to an existing MD-based SP prediction model. 19
Results
Between July 2017 and February 2020, 172 eligible patients presented with an acute symptomatic kidney stone episode. SP occurred in 71 (41%) patients, with a mean time to passage of 12 (±14, range 0–75) days. Intervention for stone removal was performed for 101 (59%) patients, with mean time to procedure of 61 (±42; range 2–165) days. There was no statistically significant difference in age, gender, stone history, and laterality between patients who experienced SP and those who underwent surgical stone removal (Table 1).
Baseline Patient and Stone Characteristics
Bold indicates statistical significance p < 0.05.
Values are mean ± SD or n (%).
PCNL = percutaneous nephrolithotomy; SV = stone volume; SWL = extracorporeal shockwave lithotripsy; URS = ureteroscopy.
Patients who experienced SP had significantly smaller stones by all stone size measurements and were more likely to have distal stones with lower stone density and any degree of hydronephrosis (Table 1). Compared with proximal stones, distal stones had a significantly smaller MD (4.3 mm vs 8.0 mm), PD (5.5 mm vs 9.4 mm), and SV (40 mm3 vs 312 mm3; all p > 0.001).
In univariate logistic regression analysis, all stone size measurements (PD, MD, and SV) were found to be significant predictors of SP by 2, 4, and 6 weeks. After controlling for patient age, gender, stone location, history, and density, as well as hydronephrosis status, stepwise multivariate regression found the MD, PD, and SV remained significant predictors of SP with the exception of MD for predicting SP by 6 weeks (Supplementary Table S1).
For predicting SP by 2, 4, or 6 weeks, SV consistently had the highest area under curve (AUC; 0.88, 0.93, and 0.92, respectively) compared with MD and PD (Fig. 2). These differences were statistically significant for comparison of SV vs MD for prediction of SP by 4 and 6 weeks, and for SV vs PD at 2, 4, and 6 weeks.

ROC comparison of SP prediction by stone size measurement method at 2, 4, or 6 weeks. SP = spontaneous passage. Color images are available online.
For smaller stones <6 mm, SV yielded a higher AUC compared with MD and PD for prediction of SP by 4 and 6 weeks, whereas no differences were seen comparing MD vs PD across all weeks (Table 2 and Fig. 3). Among larger stones ≥6 mm, SV remained significantly greater compared with MD at 4 and 6 weeks, with a much larger AUC difference between SV vs MD compared with stones <6 mm (Table 2). PD also yielded a significantly greater AUC vs MD at 6 weeks, and there was no significant AUC difference between PD vs SV across all weeks in this cohort.
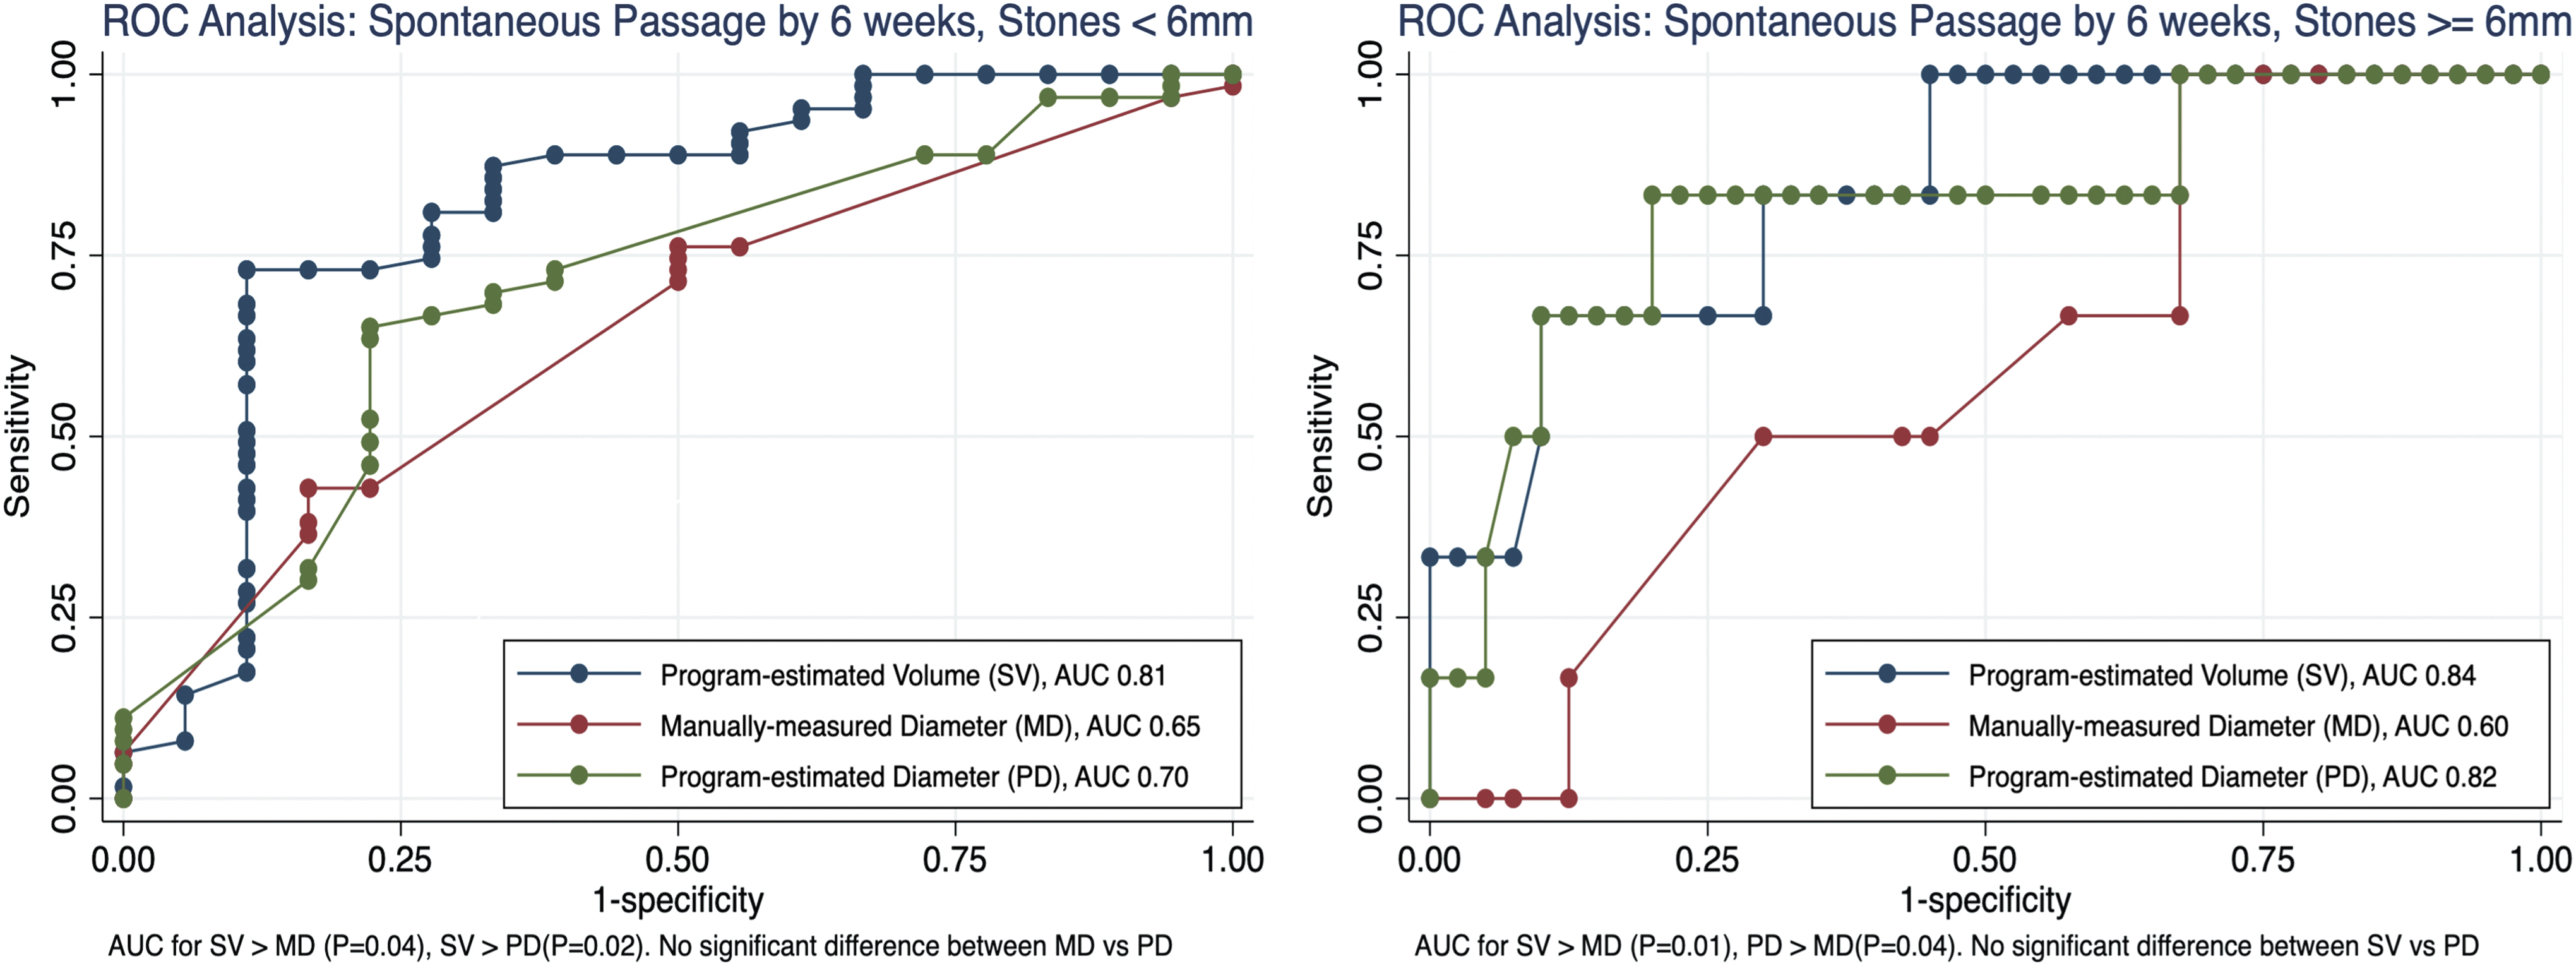
AUC for SP prediction by 6 weeks, among stones <6 mm (Left) and ≥6 mm (Right). Color images are available online.
Area Under Curve for Prediction of Spontaneous Passage by Stone Size Subgroup
AUC = area under curve; MD = manually measured stone diameter; PD = program-estimated stone diameter; SP = spontaneous passage.
When analyzing by stone location, SV yielded significantly better SP predictions for proximal stones compared with MD at all time points and PD at 4 and 6 weeks (Table 3). There was no statistically significant difference in AUC between MD and PD across all weeks. In contrast, among distal stones, no statistically significant differences were found comparing SV vs MD vs PD across all weeks.
Area Under Curve for Prediction of Spontaneous Passage by Stone Location Subgroup
p-Values use AUC:SV as referent.
We next sought to characterize the incremental value of adding SV to the existing standard of MD-only SP predictions. Optimal cut points generated through Youden method revealed a positive and negative predictive value (PPV and NPV) of 90.5% and 81.3%, respectively, for prediction of SP by 6 weeks when using SV cut point (58 mm3) alone, compared with 77.8% and 87.0% for MD cut point (6 mm) alone. When combining both SV and MD for SP prediction, there was an improvement in PPV and NPV to 90.2% and 90.1%, respectively.
After stratifying stones by MD cut point (< or ≥6 mm), SV was able to further differentiate passed vs non-passed stones, especially in context of larger stones. For SP by 6 weeks, non-SP stones ≥6 mm were more than five times larger in SV compared with SP stones ≥6 mm, whereas non-SP stones <6 mm were more than two times larger in SV vs SP stones <6 mm (Fig. 4). Finally, we performed a continuous net reclassification analysis and found that incorporating SV to an MD-only model yielded a statistically significant improvement in SP prediction (event net reclassification improvement [NRI] 0.652, confidence interval [95% CI] 0.17–0.86; nonevent NRI 0.414, 95% CI 0.08–0.70) (Fig. 5). This improvement was maintained for the subgroup of proximal stones (event NRI 0.800, 95% CI 0.29–1.00; nonevent NRI 0.362, 95% CI 0.15–0.84) but not distal stones (event NRI 0.458, 95% CI −0.39 to 0.85; nonevent NRI 0.455, 95% CI −0.33 to 1.00).
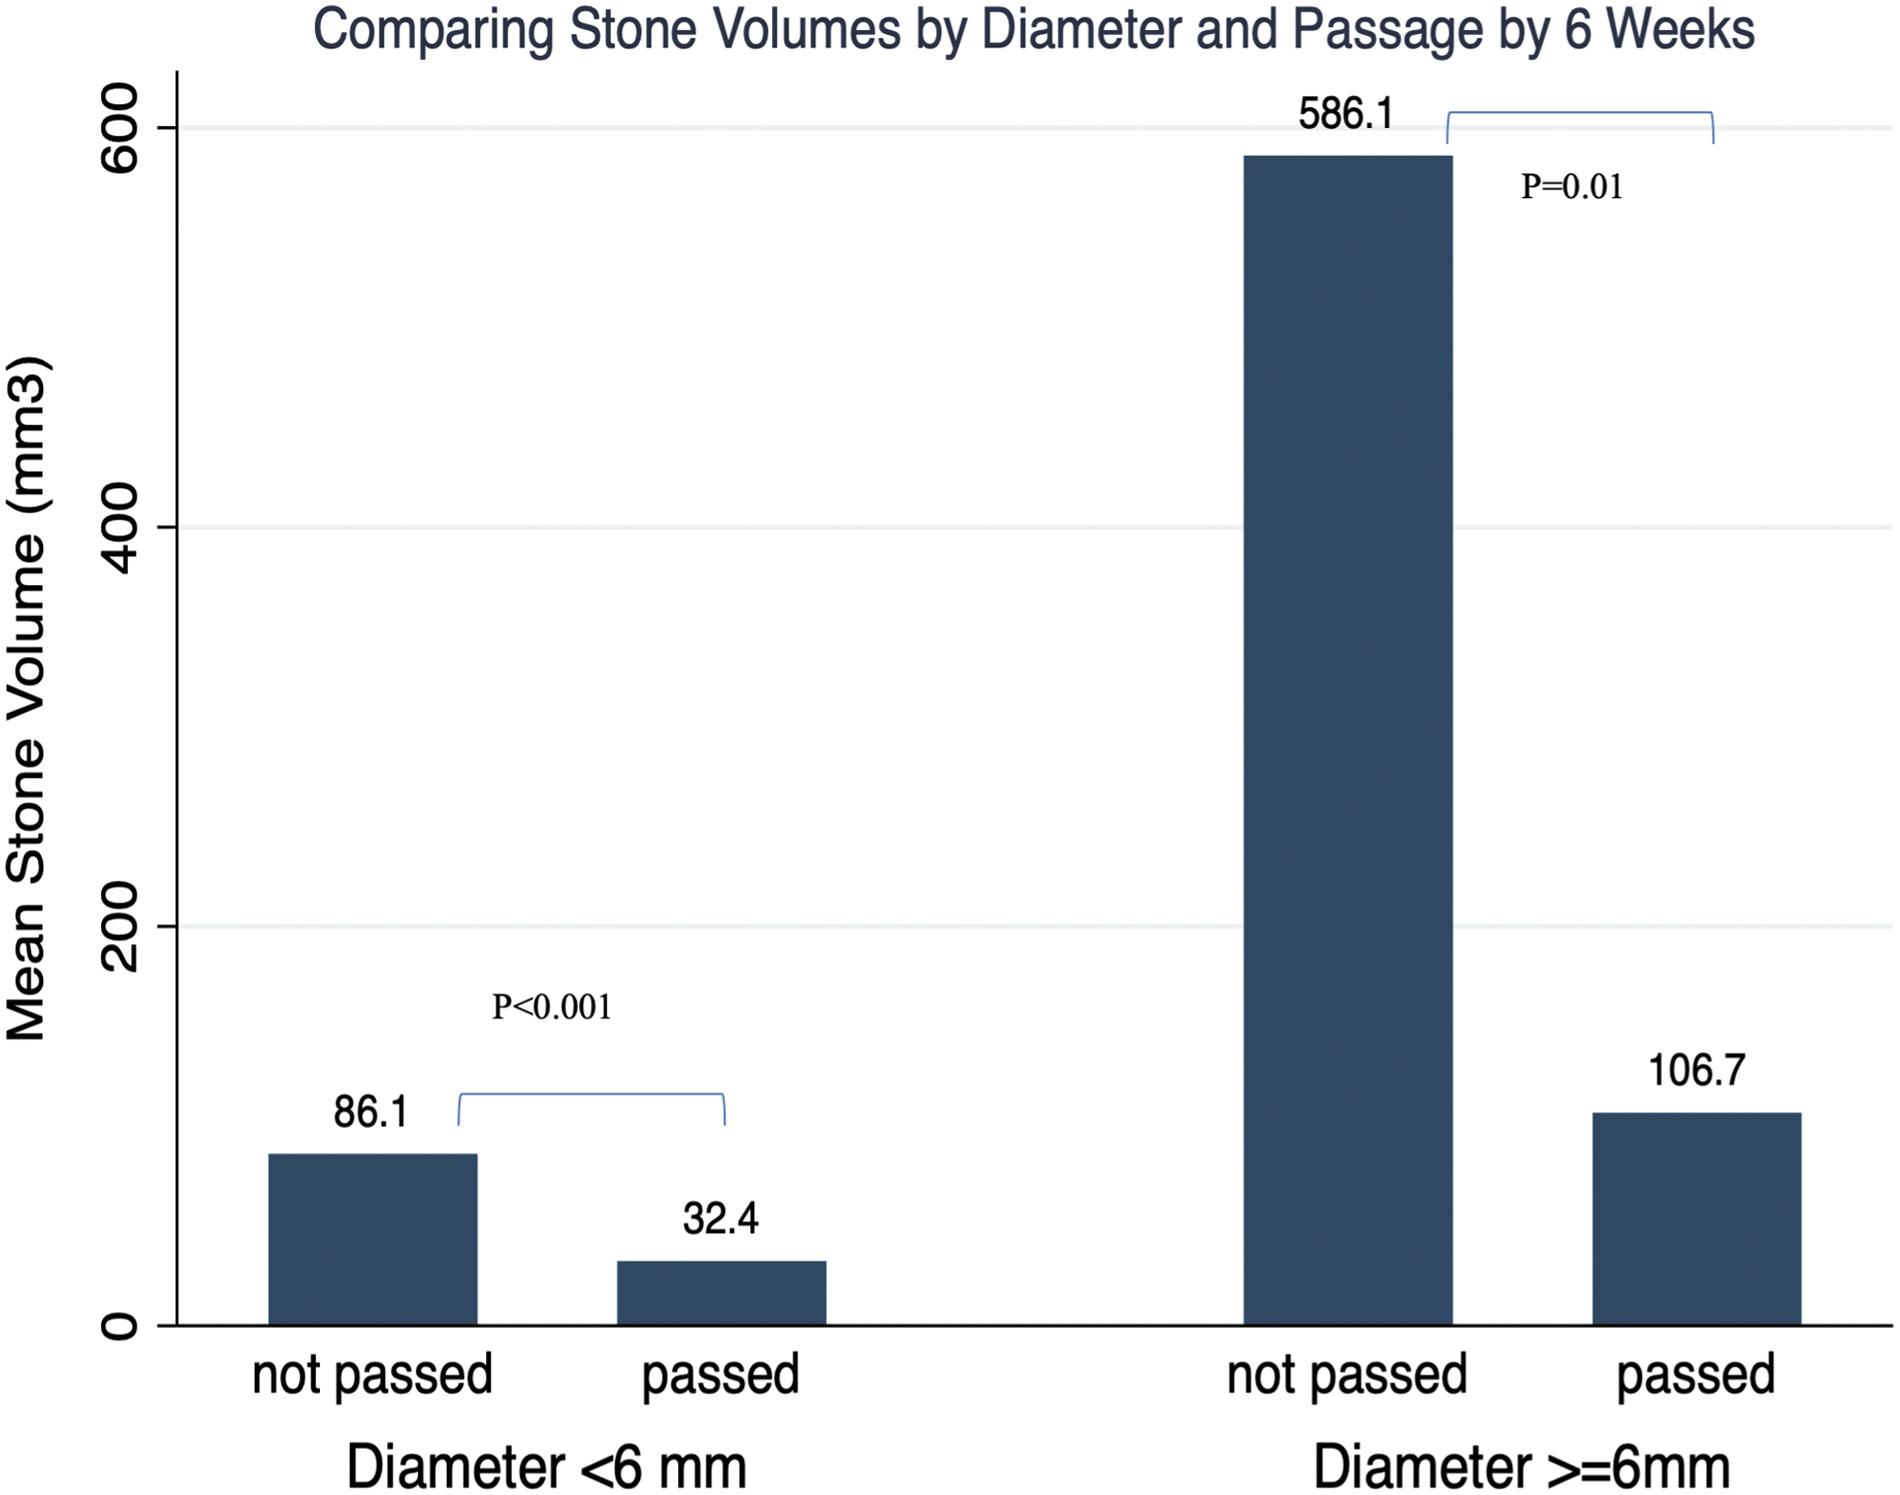
Comparing stone volumes based on linear measurement and stone passage by 6 weeks. Color images are available online.
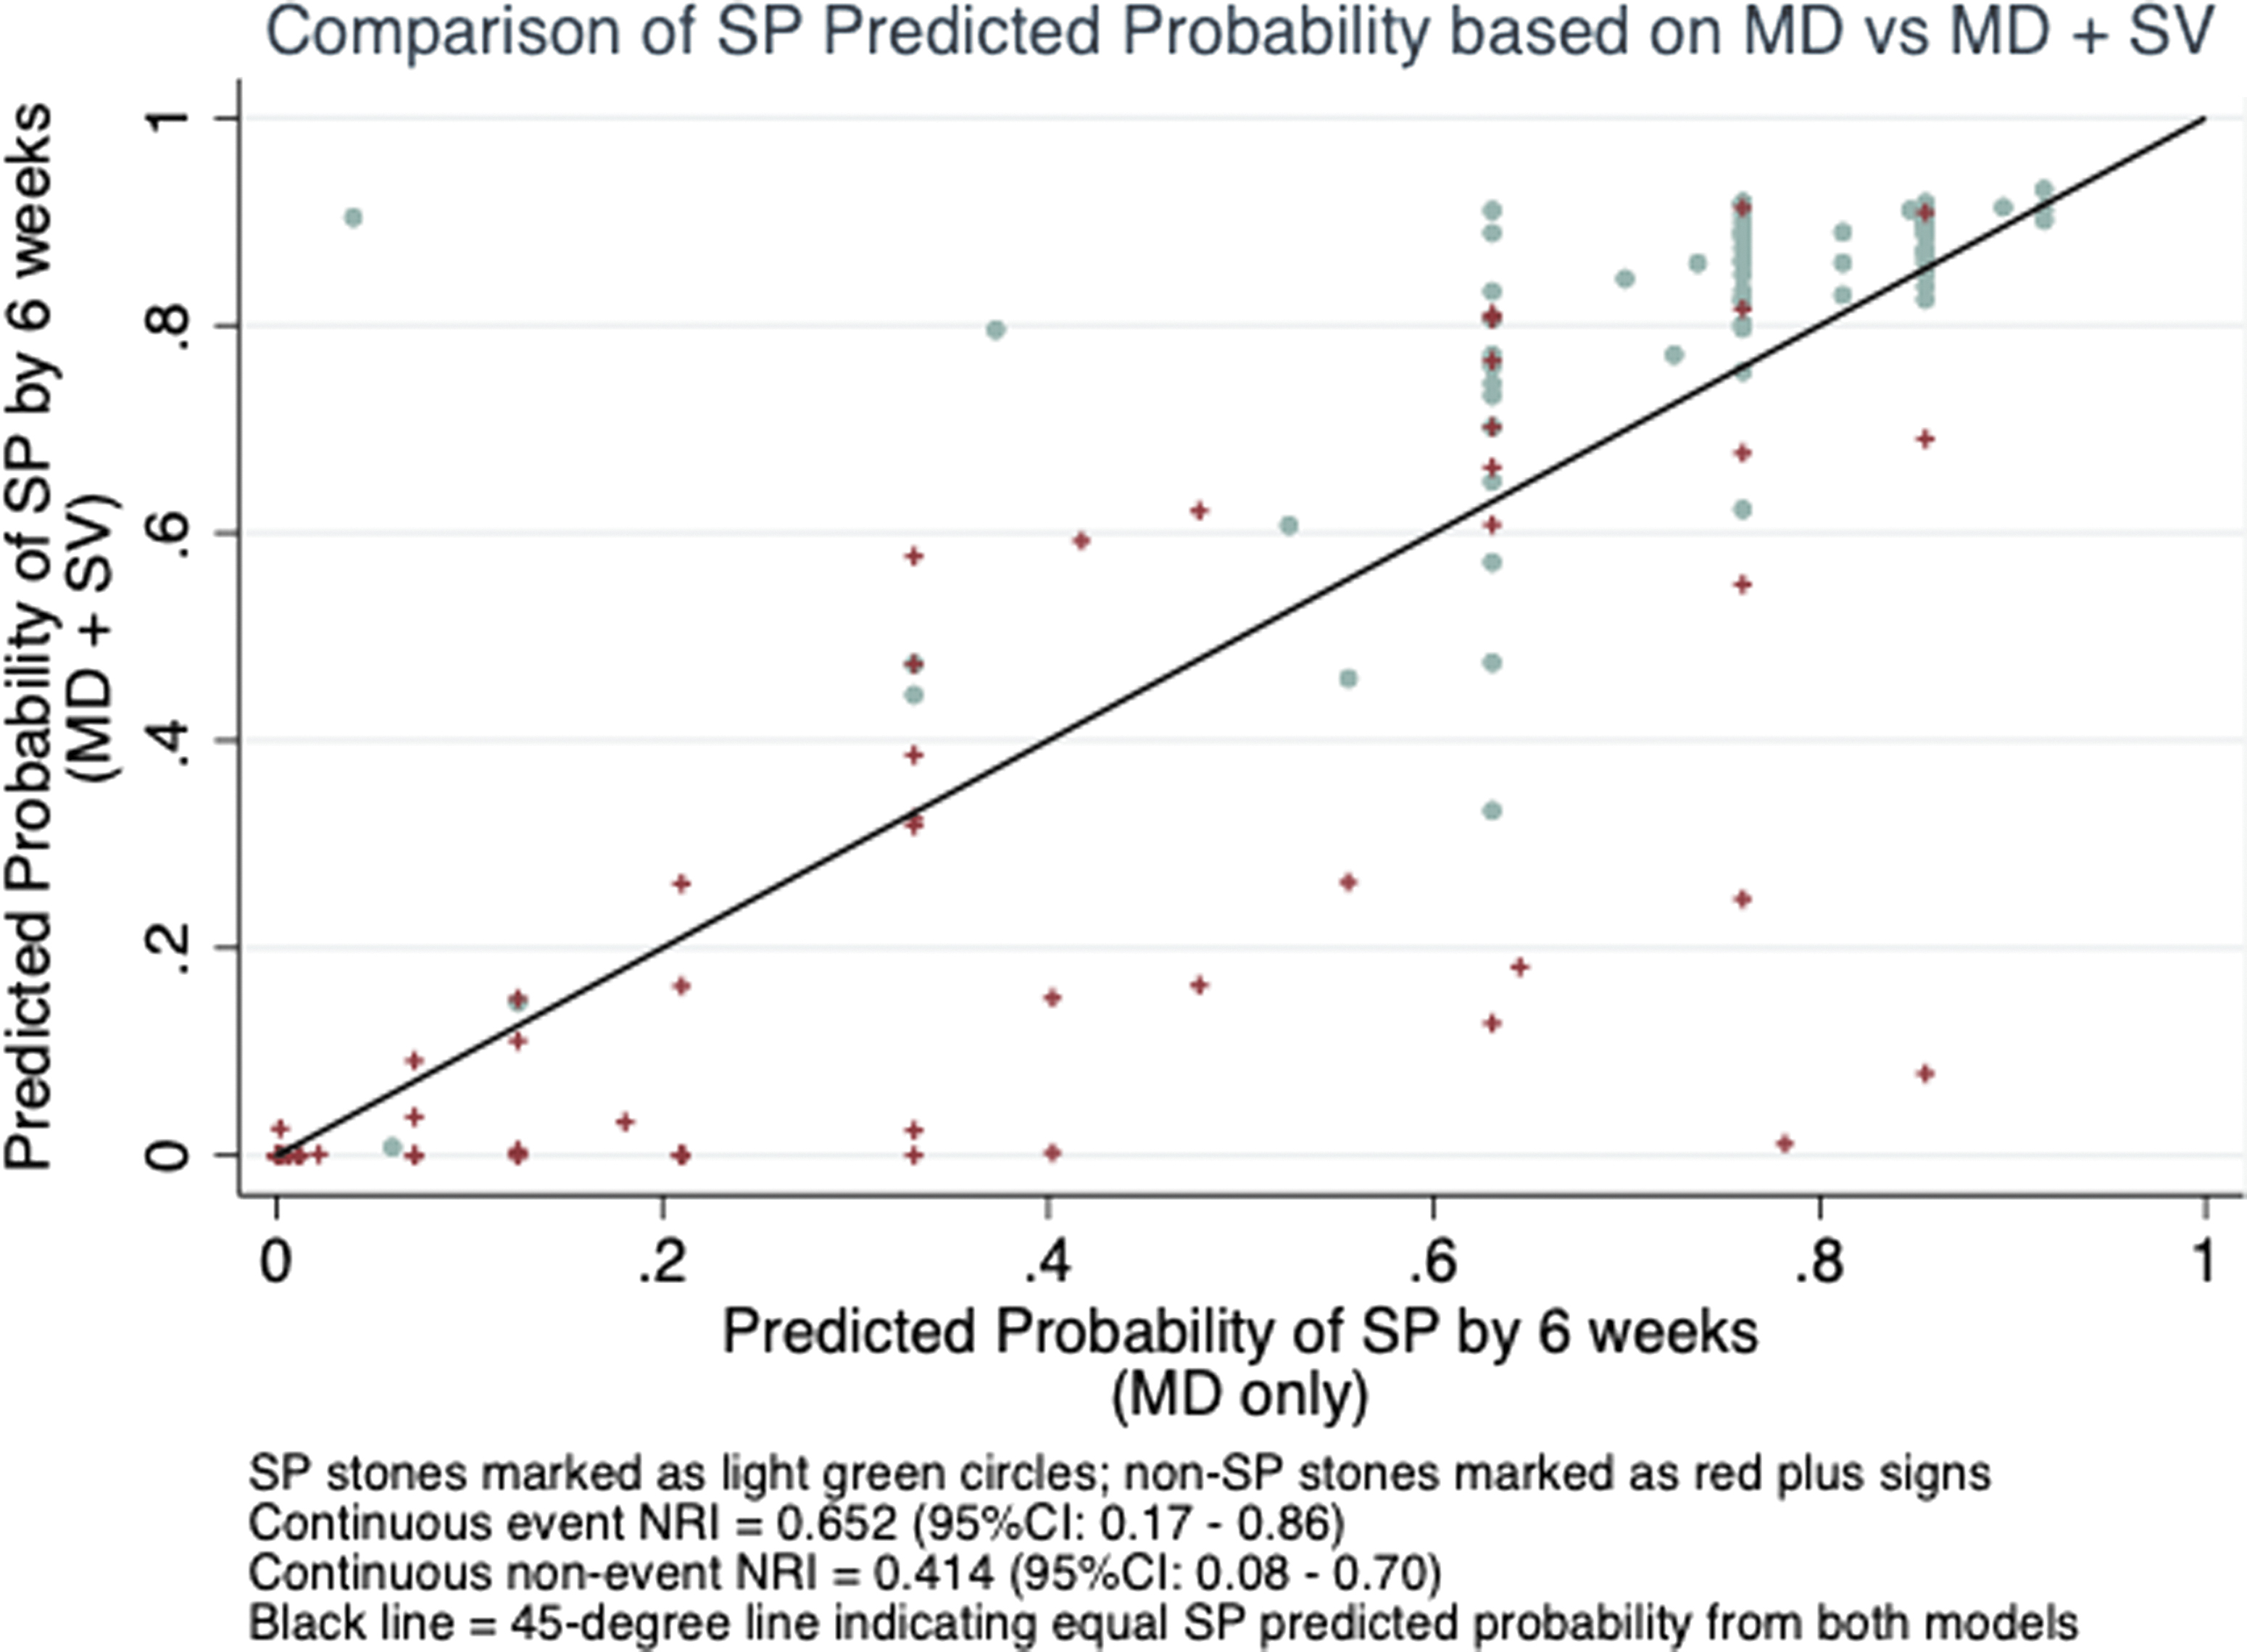
Net reclassification analysis. Color images are available online.
Discussion
Stone burden is an important predictor of spontaneous passage (SP) in patients presenting with acute nephrolithiasis. 5,7,10 To date, there has not been consensus on the optimal metric for quantifying stone size. Although manually measured stone diameter has historically been used to guide management, software-generated SV was recently proposed as a potentially superior metric. Zorba et al showed that formula-derived SV was more accurate in predicting SP compared with maximal stone diameter. 9 Jendeberg et al demonstrated significant inter-reader variability in manual stone size measurements and found automated algorithm-derived SV to yield more precise SP predictions compared with radiologist-measured maximal diameters. 8 More recently, Heidar et al re-demonstrated superiority of formula-derived volume in SP prediction compared with using axial stone diameter. 12 In contrast, Patel et al analyzed a cohort of 70 patients with ureteral stones and found no significant difference in SP prediction accuracy between software-estimated SV and axial diameter. 13
Several factors may underlie the heterogeneity of findings and associated conclusions regarding SV and SP prediction. For one, there is significant variability in the techniques used for SV estimation. Indeed, no two studies on software-generated SV to date have employed the same algorithm or computer program. In addition, there has been little attention paid to analyzing which subgroups of stones may potentially be more accurately represented by volume compared with diameter.
In this study, we sought to assess the utility of a novel software-generated SV in SP prediction, with particular focus on its comparative advantage against manually measured diameter among different subgroups of stone size and location. We found that SV predicted SP by 4 and 6 weeks with greater accuracy compared with MD, especially in the context of larger (≥6 mm) and proximally located stones. We also demonstrated that SV, when used in conjunction with MD, led to improvements in SP prediction accuracy compared with using either metric alone.
Our study has several contributions. First, our extensive subgroup analysis by stone size and location demonstrated that larger and proximal stones are much more accurately quantified by volume as opposed to diameter. As stones get larger, it is reasonable to expect a two-dimensional metric to become less adequate in capturing the true irregular three-dimensional stone burden. Given the strong association between stone size and location in our sample, the comparative advantage of SV among proximal stones is likely also mediated by this size effect. In addition, there may be a component of increased inter-reader variability from manual measurements with increased stone size. 8 This may contribute to our finding of improved predictive accuracy of automated PD measurements compared with manual MD for larger stones. Altogether, our subgroup findings suggest that implementation of SV in aiding SP prediction can be more purposefully targeted toward stones ≥6 mm.
Second, our study contributes to the technical literature on SV estimation by introducing an adaptive threshold-based methodology unique to the qSAS software, which offers several practical advantages. 15 First, the software analysis can be applied to CT scans with 2 to 3 mm cuts, which is more commonly performed in most hospitals than the 1 mm cuts required by the software employed in Jendeberg et al. 8 In addition, whereas many programs require manual review and selecting through each CT slice to mark the stone as in Patel et al, qSAS allows for more rapid identification of the stone by selecting it from only one or several compounded CT slices (Fig. 1). 13 These differences may facilitate ease of implementation in a large-scale format.
Finally, our study took the first steps in assessing the clinical implications of incorporating SV into SP prediction, which has not been investigated to date. We demonstrated an improvement in the positive and negative predictive value for SP when using SV and MD cut points together compared with using either one alone. Our analysis revealed that SV offered additional differentiation among SP vs non-SP stones after stratifying stones by diameter. Net reclassification analysis further showed that an SV+MD model yielded improved predictions compared with an MD-only model. Although the retrospective nature of our study precludes more concrete assessment of clinical benefit, these preliminary findings suggest that additional studies are indicated for further investigation.
Our study has several limitations. First, a portion of our SP data was derived from patient self-report, which may be susceptible to recall bias. A previous study suggested that self-reports of stone passage are more reliable if patients were able to capture their stone or otherwise view passage. 20 We attempted to account for this by including patients who passed stones while voiding. In addition, although SP data were obtained through follow-up imaging, there was no standard imaging modality or follow-up interval. To reduce bias stemming from the inconsistent follow-up interval, we assessed SP at specific time points (2, 4, and 6 weeks) instead of using days to SP as an outcome variable, in line with prior studies without standard follow-up intervals. 5,8 Finally, there were a number of patients whose stones could not be recognized by qSAS (n = 44) because of imaging incompatibility with the software.
Conclusion
Compared with manual measurements or automated measurements, computer-aided calculations of urolith volume measurement appear to aid in the prediction of outcome of urolith events with particular value in larger and/or more proximally located ureteral calculi. Combining computer-aided urolith measurement with “traditional” manual measurement of greatest dimension appears to offer even stronger predictive capabilities. Prospective studies are warranted to validate these findings.
Footnotes
Acknowledgments
The authors would like to acknowledge the O'Brien Urology Research Center, funded by the National Institutes of Health (DK100277), and the CT Clinical Innovation Center at the Mayo Clinic for providing the quantitative stone analysis software used in this work.
Authors' Contributions
Conceptualization, methodology, data curation, writing—original draft preparation, reviewing, and editing by T.Chi Data curation and investigation by M.F.M. Writing—reviewing and editing by J.H.B. and T.T.Che. Software and validation by A.F. Supervision by R.L.S. Conceptualization, methodology, supervision, and writing—reviewing and editing by S.K.B.
Author Disclosure Statement
No competing financial interests exist.
Funding Information
No funding was received for this article.
Supplementary Material
Supplementary Table S1
Abbreviations Used
References
Supplementary Material
Please find the following supplemental material available below.
For Open Access articles published under a Creative Commons License, all supplemental material carries the same license as the article it is associated with.
For non-Open Access articles published, all supplemental material carries a non-exclusive license, and permission requests for re-use of supplemental material or any part of supplemental material shall be sent directly to the copyright owner as specified in the copyright notice associated with the article.