
Abstract
Objectives:
To assess the ideal interval between repeated extracorporeal shockwave lithotripsy (SWL) for renal stones.
Patient and Methods:
Eligible patients with a single renal stone ≤20 mm who required SWL were randomly assigned to one of three groups based on intervals between first and second sessions. Patients underwent the second session after 3, 7, and 14 days in Groups 1, 2, and 3, respectively. Tubular functions were assessed through comparisons of urinary execration of kidney injury molecule-1 (KIM-1), neutrophil gelatinase associated lipocalin (NGAL), and interleukin-18 (IL-18) with pre-SWL values, whereas glomerular function was assessed by comparisons of protein/creatinine ratio with pre-SWL and changes in ipsilateral renal function on isotope scans. Treatment success was assessed by noncontrast CT after 3 months.
Results:
All demographics of the 166 patients included in the study were comparable between the three groups. There were significant elevations of tubular biomarkers and protein/creatinine ratio after first and second SWL sessions compared with pre-SWL values (p < 0.0001). All tubular biomarkers returned to pre-SWL values at 7 and 14 days after second session, whereas they remained significantly elevated 3 days after second session (p = 0.027, < 0.001 and <0.001 for KIM-1, NGAL, and IL-18, respectively). SWL success was 73.6% in Group 1, 83.7% in Group 2, and 81% in Group 3. A significant decrease in ipsilateral renal split function was observed in Group 1 at the 3-month follow-up.
Conclusions:
An interval of 7 days is required between SWL sessions when treating renal stones to allow for complete recovery of kidney functions.
Clinical Trial Registration:
ID: NCT04575480.
Introduction
Extracorporeal Shockwave lithotripsy (SWL) is an effective means of breaking uncomplicated stone burdens of ≤20 mm located in the upper urinary tract. 1 Shockwaves are high-pressure waves consisting of a sharp peak in positive pressure then a trailing negative wave generated outside the body and passed through it to fragment stones. 2 When shockwaves encounter the kidney stone, the generated force produces stress within the stone, thus resulting in compression-induced tensile cracking. In addition, shockwaves cause microbubble formation on the surface of the stone. These bubbles collapse releasing microjets colliding against the stone that result in stone destruction. These mechanisms may also be responsible for kidney injury.
Detailed morphologic studies in a variety of animals have shown that SWL ruptures blood vessels and can damage surrounding renal tubules. 3 –5 A transitory decrease in renal function has been reported in patients with normal renal function, which returns to normal after a couple of days from the application of SWL. However, such alterations may last longer in patients with an already compromised renal function. The presence of multiple renal stones or stones that fail to respond well to a single application of shockwaves demands SWL retreatment. In such cases, the harmful effects may persist and continue to affect tubular and glomerular function. 6
There is no consensus about the required time intervals between repeated SWL sessions applied for renal stones with some centers waiting for 3 days, others for 1 week, and others up to 1 month to repeat lithotripsy.
7
According to the 2022 EUA guidelines, there are no conclusive data on the intervals required between repeated SWL sessions. However, clinical experience indicates that repeat sessions are feasible within 1 day for ureteral stones.
8
Fortes et al. reported that SWL re-application within a 24-hour interval did not cause a significant increase in urinary N-acetyl-beta-
The search for more reliable biomarkers for evaluation of renal damage has identified a variety of potential candidates, such as interleukin-18 (IL-18), neutrophil gelatinase–associated lipocalin (NGAL), and kidney injury molecule-1 (KIM-1). 11 KIM-1 is a transmembrane glycoprotein released in response to renal proximal tubule damage, and it is a sensitive and specific biomarker of renal damage. 12 Vaidya et al. discovered a correlation between increased KIM-1 levels and the severity of renal damage. 13 Aydin et al. evaluated the role of KIM-1 in determining the intervals between SWL sessions when they examined urinary levels of KIM-1 before SWL and 1 hour, 1 day, 1 week, and 1 month after single session application. They reported that after 1 week and 1 month urinary values were not significantly different from the preprocedural values. 14
Lack of evidence about the adequate intervals between SWL sessions that allow recoverability of both tubular and glomerular functions stimulated us to search for a precise answer to the question, “What should be the ideal interval between SWL sessions in the treatment of renal stones?”
Patient and Methods
Study design
This randomized controlled trial (RCT) protocol was registered on
Pre-SWL evaluation
Before SWL, all patients were evaluated by medical history, physical examination, urine analysis, serum creatinine, complete blood count, and prothrombin time. Additional midstream urine samples were collected for baseline evaluation of the urinary markers used in the study (baseline sample). Noncontrast CT (NCCT) was performed in all patients to identify stone criteria such as length, site, location, and density. Stone length represents the largest dimension of the stone. Technetium-99 diethylene triamine penta acetic acid (Tc99 DTPA) renal scan was performed to assess ipsilateral renal split function.
The technique of SWL
SWL was performed in a dedicated SWL unit consisting of a group of well-trained urologists and radiographers under the supervision of an expert endourologist using Electromagnetic Dornier Gemini Lithotripter (Dornier MedTech, Wessling, Germany). Pethidine hydrochloride IV injection (1 mg/kg) was given to all patients 15 minutes before treatment. The rate of shockwaves delivery was 90 pulse/min. Treatment began at machine power step 1, which delivered 49 MPa focal pressure and 0.35 mJ/mm2. Power has been gradually increased by one step for every 200 shocks up to step 4, which delivers 70 MPa and 0.7 mJ/mm2. All patients received 3000 shocks/session.
Urine sampling
Midstream urine samples were obtained for assessment of KIM-1, NGAL, IL-18 and protein/creatinine ratio 2 hours after first session (Sample 1) and 2 hours after second session (Sample 2). The choice of 2 hours after the SWL session for the collection of urine samples was chosen according to previous works by Aydin et al., El-Nahas et al., Jobs et al., and Kocatürk et al. 14 –17 They were also measured after 3, 7, and 14 days from the second session in Groups 1, 2, and 3, respectively, in all patients (Sample 3), and after 3 months for patients with successful treatment (follow-up sample).
The samples were centrifuged, and the supernatant was separated and stored at −20°C. The tubular biomarkers were assessed using the enzyme-linked immunosorbent assay method according to the manufacturer's instructions (Sunlong Biotechnology, Shangyi, Hangzhou, Zhejiang, China). Urinary excretion of protein was estimated as protein/creatinine ratio (milligram urine protein/gram urine creatinine). 18 The protein and creatinine in urine samples were determined on Architect plus c 4000 auto-analyzer system (Abbott, Abbott Park) using benzethonium chloride and modified Jaffe method, respectively. The ratio was calculated by dividing the urine protein (mg/L) by the urine creatinine (g/L).
Radiological investigations
NCCT was performed after 3 months to assess treatment success that was defined as being free of stones or having nonobstructing residual fragments <4 mm. Renal TC99 DTPA scan was performed after 3 months for patients with successful treatment and compared with pretreatment values.
Sample size and power of the study
The sample size was calculated using G* Power program (ver. 3.1.9.7; Heinrich-Heine-Universität, Düsseldorf, Germany). After consideration of the following criteria, an effect size of 0.25 (based on the study by Aydin et al.), 14 alpha error protection of 0.05, and 80% power of the study, the total sample size was 155 patients. Then 10% (15 patients) was added to compensate for loss to follow-up.
Study outcomes
The primary outcome was recoverability of renal tubular function biomarkers in each group (comparison between Sample 3 and baseline sample). Secondary outcomes were glomerular function (as assessed by changes in protein/creatinine ratio and changes in ipsilateral split renal function in renal isotope scan), treatment success, and complications.
Statistical analysis
Analysis of data was performed with Statistical Package for Social Science (SPSS) software (SPSS, Inc., IBM Corp., Armonk, NY). Continuous data were presented as mean ± standard deviation when normally distributed and as median and range when non-normally distributed. Comparison between normally distributed numerical data between the three groups was carried out by analysis of variance (ANOVA) test. Categorical data were presented as frequency and percentage. Comparisons between categorical variables between groups were performed using chi-square test. Comparison between non-normally distributed categorical values between the three groups was performed by the Kruskal–Wallis test. Comparison between the means of pre-SWL and post-SWL values in each group was carried out using paired t-test. Comparison between the median of pre-SWL and post-SWL values in each group was performed using Wilcoxon signed ranks test. In all comparisons, p < 0.05 was considered significant.
Results
From July 2020 to March 2022, 180 patients were included in the study. Fourteen patients were excluded from the analysis because they were lost to follow-up (7, 5, and 2 in Groups 1, 2, and 3, respectively). Of the remaining 166 patients, 53 patients were in Group 1, 55 patients were in Group 2, and 58 patients were in Group 3. The Consolidated Standards of Reporting Trial flow diagram of the study is given in Figure 1. Patients' demographics and stone characteristics were comparable between all study groups, as given in Table 1.
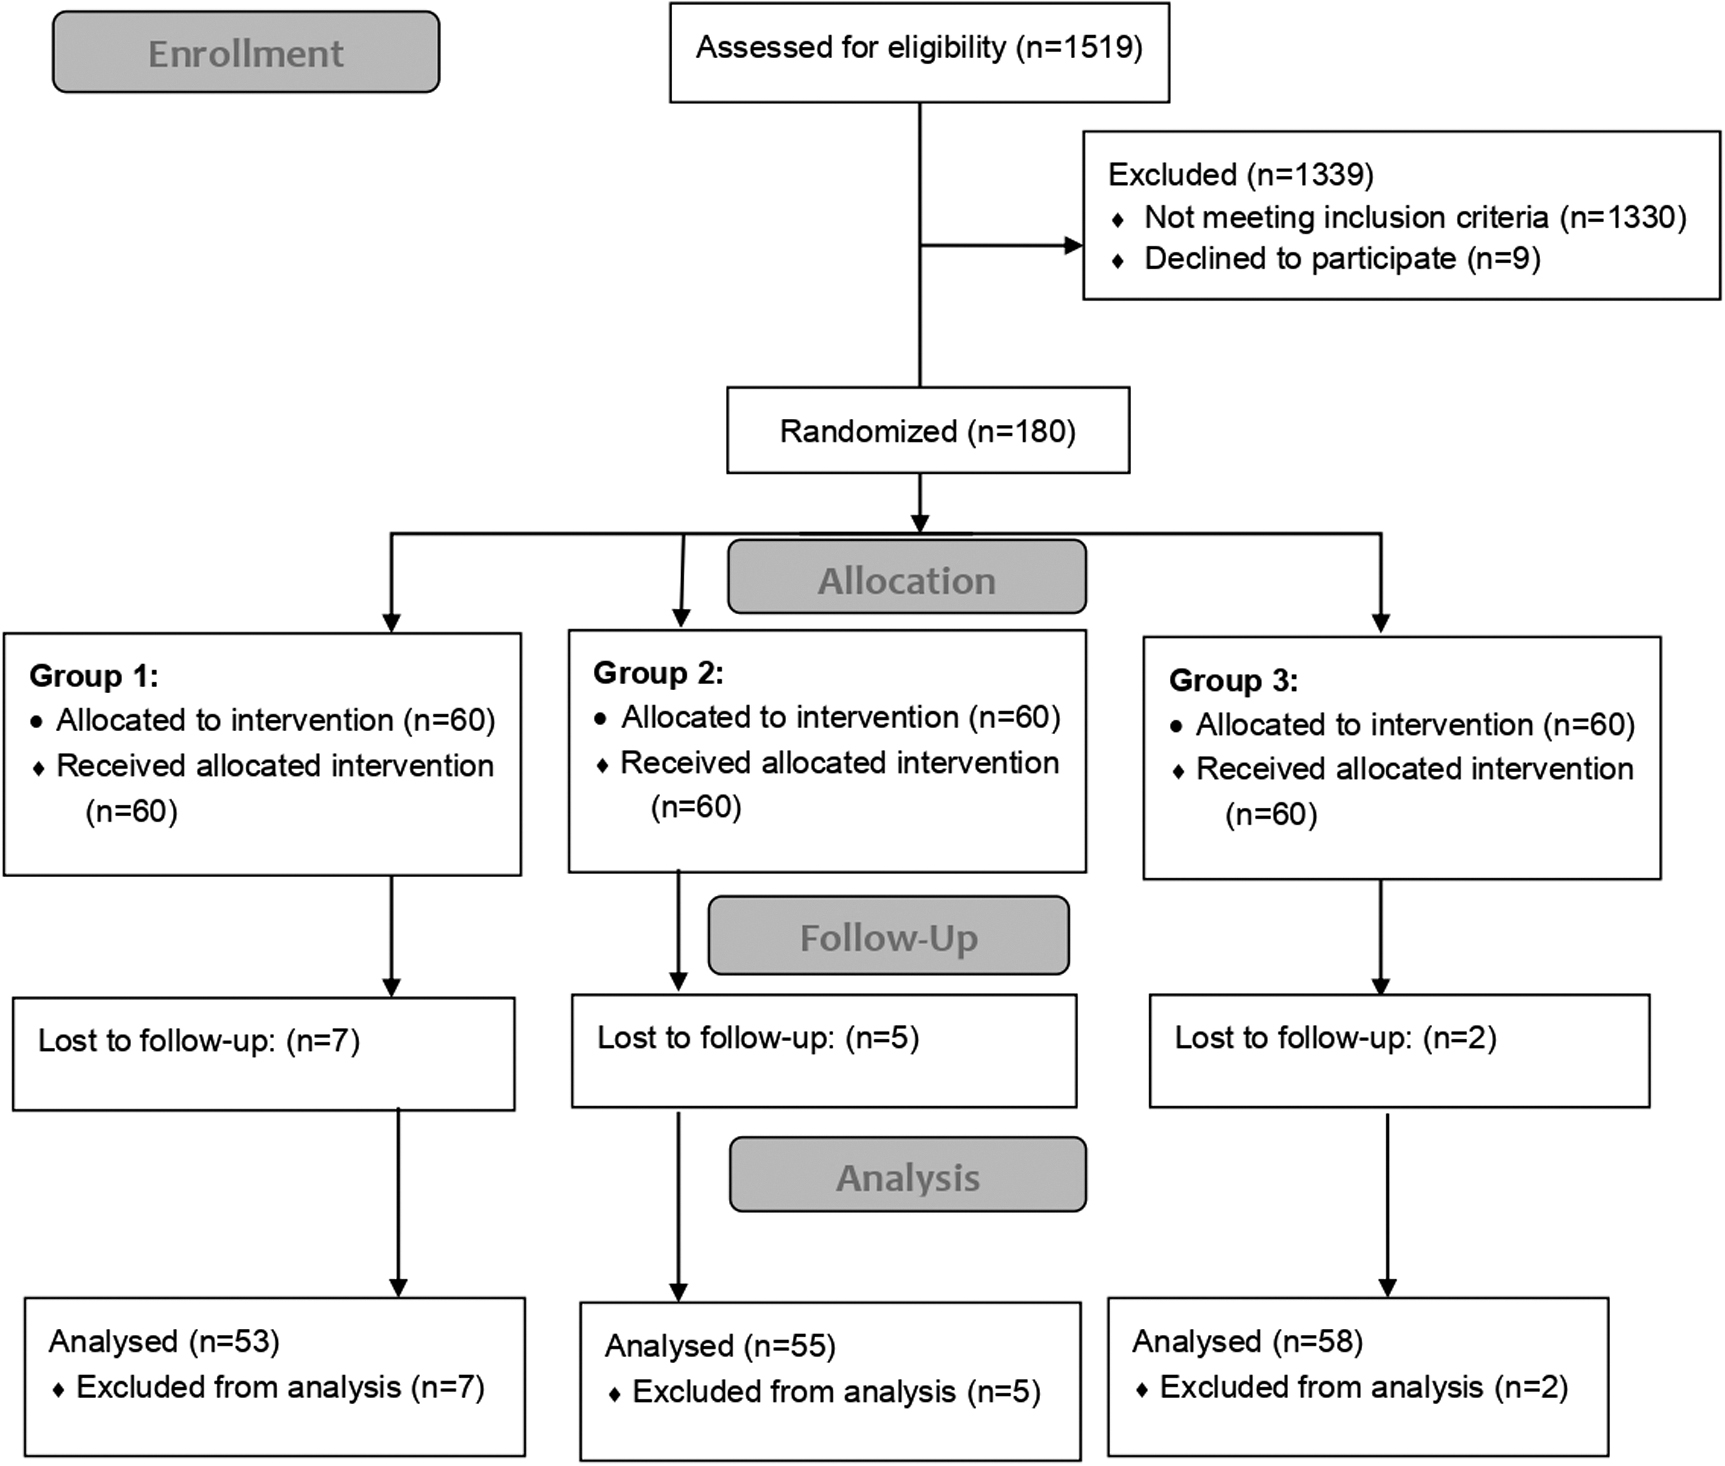
CONSORT flow chart for patients included in the study. CONSORT = Consolidated Standards of Reporting Trial.
Patient Demographics, Stone Characteristics, and Renal Function Before extracorporeal Shockwave Lithotripsy
Chi-square test.
One-way ANOVA test.
ANOVA = analysis of variance; BMI = body mass index; SD = standard deviation.
Evaluation of tubular and glomerular functions
There were significant elevations of all tubular enzymes and protein/creatinine ratio after first sessions (Sample 1) and after second sessions (Sample 2) when compared with pre-SWL values (baseline sample) (Table 2). Then, tubular enzymes in Sample 3 returned to pre-SWL baseline values in Groups 2 and 3, whereas they remained significantly higher in Group 1 (Table 3). This indicates enough time for recoverability of kidney damage in Groups 2 and 3 (intervals between treatment sessions were 7 and 14 days, respectively). Values of protein/creatinine ratios in Sample 3 were lower than those of the pre-SWL values (Table 3). It was also observed that stone site (pelvis vs caliceal did not affect the results of renal functional biomarkers (Fig. 2).

Changes in urinary markers in relation to stone location. Color images are available online.
Comparison of Kidney Injury Molecule-1, Neutrophil Gelatinase Associated Lipocalin, Interleukin-18, and Protein/Creatinine Ratio 2 Hours After First and Second Session with Pre- extracorporeal shockwave Lithotripsy Values
P1 value: Comparison between pre-SWL and after first session values.
P2 value: Comparison between pre-SWL and after second session values.
Paired T test.
Wilcoxon signed ranks test.
IL-18 = interleukin-18; KIM-1 = kidney injury molecule-1; NGAL = neutrophil gelatinase associated lipocalin; SWL = extracorporeal shockwaves lithotripsy.
Comparison of Urinary Excretion of Kidney Injury Molecule-1, Neutrophil Gelatinase Associated Lipocalin, Interleukin-18 and Protein/Creatinine Ratio in Sample 3 with Pre- extracorporeal Shockwave Lithotripsy (Baseline) Values
Paired T test.
Wilcoxon signed ranks test.
Treatment outcomes
Treatment outcomes were comparable between study groups (Table 4). SWL treatment succeeded in 73.6% in Group 1, 83.7% in Group 2, and 81% in Group 3 (p = 0.492). Complication rates were comparable between study groups (p = 0.743). Post-SWL asymptomatic hematomas were detected by NCCT in one patient of each group. They were managed conservatively and during follow-up, the hematomas resolved.
Comparison of Treatment Outcomes and Complications for the Three Treatment Groups
The “bold” refers to the overall.
Grade I complication: Acute renal colic secondary to Steinstrasse that required MET.
Grade III complication: Infected obstructed kidney owing to Steinstrasse that required emergency admission and fixation of a ureteric stent.
Chi-square test.
CIRFs = clinically insignificant residual fragments; MET = medical expulsive therapy; RIRS = retrograde intra renal surgery; PCNL = percutaneous nephrolithotomy.
Follow up after 3 months
In Group 1, the mean split function of the ipsilateral kidneys after 3 months (48.1%) was statistically lower than the pre-SWL split function (53.5%, p = 0.005), whereas in Groups 2 and 3, there were insignificant changes in split renal functions (49.9% vs 50.3% and 49.2% vs 51.1%) (p = 0.887 and 0.337, respectively). This indicates enough time for recovery of renal function in Groups 2 and 3.
After 3 months, all renal tubular markers and protein/creatinine ratio were lower than pre-SWL values in all groups (Table 5). This indicates that the changes in glomerular and tubular functions were transient.
Comparison of Kidney Injury Molecule-1, Neutrophil Gelatinase Associated Lipocalin, Interleukin-18, and Protein/Creatinine Ratio After 3 Months with Pre-extracorporeal Shockwaves Lithotripsy Values
Paired T test.
Wilcoxon signed ranks test.
Discussion
Studies contributed renal damage after SWL to changes in renal perfusion that occurred during SWL. 19,20 Other studies demonstrated that free oxygen radicals increased in renal tissue and that the total antioxidant capacity declined because of ischemia–reperfusion damage. 21
When renal proximal tubule cells are damaged, a variety of molecules are released. KIM-1, IL-18, IL-6, NGAL, intercellular adhesion molecule-1, and b2-microglobulin are some of these molecules. 11,21 –23 In this study, we detected significantly higher KIM-1 values in the early post-SWL period (2 hours after first and second sessions in all groups) compared with the pre-SWL values, whereas KIM-1 values measured after 7 and 14 days from the second session were comparable with pre-SWL values for Groups 2 and 3. These findings were similar to that of Aydin et al. as they reported that the average KIM-1 values after 1 hour and 1 day were statistically higher in the SWL group than in the control group, whereas 1-week and 1-month values were not significantly different from the preprocedural values. 14 These data indicate that the tubular damage resolved in 1 week after SWL.
In recent years, NGAL has been one of the most studied renal damage biomarkers because it is indicative of acute kidney injury (AKI) before any rise in serum creatinine. NGAL excretion in urine only occurs when proximal tubule damage disrupts NGAL reabsorption. Vittori et al. reported transient increases of NGAL in urine after SWL for a single radiopaque renal stone. 24 We also detected significantly higher NGAL values in the early post-SWL period (2 hours after first and second sessions in all groups) compared with the pre-SWL values. Vittori et al. measured 24-hour and 30-day NGAL and reported no significant difference with pre-SWL values. We found that NGAL values after 7 and 14 days from the second session were not statistically significant compared with pre-SWL values, whereas in Group 1 (3 days after second SWL), urinary values were still statistically higher than pre-SWL values. These data denote that 7 days or more are required for recovery of renal tubular damage after SWL.
Recently, IL-18 has been explored as a urinary biomarker for the early detection of AKI with promising results. 25 Nomikos et al. observed an early rapid increase in urinary levels of IL-18 from the first 6 hours up to 3 days post-SWL, which was normalized on day 10 after lithotripsy. 26 Parallel to those significant differences between pre-SWL values of IL-18 and post-first and second sessions were reported in our study. Also, there were significant differences between pre-SWL values of IL-18 and 3 days after second session values for Group 1. The data indicate that renal damage resulting from SWL sessions measured by IL-18 levels lasts up to 3 days and normalization occurs after 7 days.
Kocatürk et al. conducted a prospective study including 30 patients with unilateral kidney stones and evaluated the role of nephrin and podocalyxin in determining the intervals between SWL sessions. They concluded that a time interval of 1 week could be a safe period between two consecutive SWL sessions. 17 Our results agree with these findings despite using different biomarkers for the evaluation of renal functional recoverability.
In previous trials, evaluation was carried out after only a single session of SWL. In this randomized controlled trial, the actual effect of the second session was also studied. In addition, renal recoverability was investigated using multiple validated biomarkers. The combination of our tubular markers for diagnosis of AKI post-SWL was used many times and has been proven superior to changes in serum creatinine. 27 Moreover, we tried to cover all aspects of kidney injury (both glomerular and tubular). Glomerular function was evaluated using changes in urinary protein execration measured by protein/creatinine ration as elevated levels indicate leakage from the injured renal glomeruli and changes in renal split functions of the treated kidneys 3 months after the procedures from baseline values.
We reported significantly higher protein/creatinine ratios after the first and second session for all groups compared with baseline values. Values in Sample 3 were lower than pre-SWL values. Our data agree with Zekey et al. who suggested that after SWL, transient nephrotic range proteinuria occurs after treatment and returns to normal values within a short time. 28 Of interest, all urinary biomarkers in patients with successful treatments after 3 months (Sample 4) were lower than pre-SWL values. This could be explained by the effect of urolithiasis and associated inflammations on renal tubular and glomerular functions pre-SWL and indicate renal recoverability from the effect of renal calculi and associated inflammations after 3 months. Moreover, a statistically significant decrease in the split function of the treated kidneys 3 months after SWL in Group 1 was not translated to clinically significant results.
In our patients, SWL was well tolerated. Post-SWL asymptomatic hematomas were detected by NCCT in three patients, one patient in each group. All patients were managed conservatively and during follow-up, hematomas resolved. Of note, the risk of renal hematomas was not associated with either shorter intervals or longer intervals between the sessions.
This study was limited by the fact that the 3-month follow-up including urinary biomarkers and renal DTPA scans were carried out for patients with successful treatment. This is because patients with unsuccessful SWL will require another treatment modality such as flexible ureteroscopy or percutaneous nephrolithotomy, which will affect the measured values. Furthermore, there might be further changes in renal function with prolonged follow-up necessitating a longitudinal study. Another practical approach to identify the optimum time of recovery is to study the changes in biomarkers longitudinally after the first session of SWL. Nevertheless, this approach did not include the possibility of a second session. In addition, we opted to simulate the clinical setting where the timing between sessions was not agreed upon and left to the expertise of the urologist.
Conclusions
An interval of 7 days is required between SWL sessions when treating renal stone to allow for complete recovery of kidney functions.
Footnotes
Authors' Contributions
M.F.: performed SWL and wrote the article draft. A.A.: reviewed the study design protocol and the article. A.H.: study conception and formulated protocol design. W.I.M. and H.A.M.I.: performed laboratory tests. K.Z.S.: performed SWL and designed follow-up protocol. M.R.E.: reviewed the article. A.M.H.: assisted in statistical analysis and reviewed the article. A.R.E.: did statistical analysis and wrote the final version of article.
Author Disclosure Statement
No competing financial interests exist.
Funding Information
No funding was received for this article.