
Abstract
Background:
The siting of high emissions facilities can have important implications for environmental justice.
Methods:
We contribute to environmental justice literature by identifying several critical pathways in which high emissions facilities across Texas disproportionately burden communities of color, especially communities with higher percentages of Black and Hispanic residents. In addition, we assess the breakdown of facilities with registered permits by rule (PBR) by percentage of people of color (POC).
Results:
Using a detailed city-by-city analysis, we show that four of the cities having the most facilities (namely Houston, Port Arthur, Corpus Christi, and San Antonio) have facilities located in geographies with significantly higher percentages of POC than the county in which they are located. We also observe that Texas counties with higher rates of POC and Black populations have more high emissions facilities. When we look at specific counties, we see that, in Harris County, higher percentages of Hispanic populations are positively associated with more facilities. In Dallas County, the percentage of POC and the percentage of Black population are key predictors of the number of facilities. Finally, we find that the majority of facilities with PBRs in three major cities across Texas are in areas that are majority POC within a 3-mile radius. In Corpus Christi, for example, as many as 95% of facilities with registered PBRs are located in majority POC areas.
Discussion and Conclusion:
Our results suggest that locations of high emissions facilities disproportionately burden POC in Texas.
INTRODUCTION
Environmental justice is defined by the U.S Environmental Protection Agency (EPA) as “the just treatment and meaningful involvement of all people, regardless of income, race, color, national origin, Tribal affiliation, or disability, in agency decision making and other Federal activities that affect human health and the environment” such that all people have equitable access to living and working in healthy environments. 1 Environmental racism refers to racial discrimination in the development and enforcement of environmental policies such that communities of color are targeted for the siting of environmentally harmful facilities, exposed to disproportionate pollution, or excluded from environmental decision making. 2
The field of environmental justice was largely set in motion by the publication of two groundbreaking articles: the 1983 article “Solid Waste Sites and the Houston Black Community” by Dr. Robert Bullard and the 1987 report “Toxic Waste in the United States” conducted by the United Church of Christ Commission on Racial Justice and led by Dr. Benjamin F. Chavis Jr. The former was the first study in the United States to provide a comprehensive account of environmental racism1 and found that toxic waste facilities were disproportionately located in African American neighborhoods in Houston. 3 The latter article was the first of its kind to address issues of environmental racism on a national level1 and found that race was the most significant predictor of the locations of hazardous waste sites. 4
Contemporary environmental justice research continues to examine patterns of socioeconomic inequity in the siting of environmentally impactful facilities, as well as disproportionate exposure to environmental pollutants and other hazards. One major area of focus is on air quality and air-polluting facilities. Air quality is crucial to human health, as exposure to air pollutants such as ozone, nitrogen dioxide (NO2), and fine particulate matter (PM2.5) can result in health effects including coughing, heart disease, premature death, and the development or aggravation of asthma.5,6,7 Studies concerned with air quality and air-emissions facilities typically examine how socioeconomic variables such as income, age, educational attainment, and race relate to the siting of air-polluting facilities or to exposure to environmental air pollutants. Air pollutant exposure and facility location data for these studies are commonly drawn from the EPA Toxic Release Inventory (TRI),8,9,10,11,12 though some other studies pull from the EPA Risk Screening Environmental Indicators database,13,14,15 the EPA Air Quality System database,16,17 and the EPA National-Scale Air Toxics Assessment.18,19,20 The findings of many studies focused on air pollutant exposure support evidence of environmental injustice. Focusing specifically on racial disparities, as will be the focus of this study, it has been found that non-Hispanic Black populations in Texas and the greater South Central region of the United States face significantly higher exposure to industrial air toxics, chronic pollution cancer risks, and pollutant releases.21,22,23 Hispanic populations were also found to experience significantly higher exposure to industrial air toxics, 24 as compared with White populations, and were exposed to both chronic and acute pollution risks. 25 However, no significant relationship was found between Hispanic populations and pollutant releases in Texas. 26 Racial disparities in exposure were also identified in a study of health risks from exposure to hazardous air pollutants in Florida, which found that a higher proportion of Black and Hispanic residents suggested significantly greater cancer risks in the majority of census tracts in the state. 27 In addition to exposure to general air pollution, Black and Hispanic populations were also found to be disproportionately exposed to certain types of air pollutants. Across the United States, Black residents have been found to have significantly higher exposures to fine PM2.5, ozone, and benzene.28,29,30,31,32 Hispanic residents face higher exposure to the chlorine and aluminum components of PM2.5, 33 and non-White residents as a whole are more exposed to NO2 across the United States. 34 These racial disparities persist even as air emissions decrease over time.35,36
Racial disparities have also been found in studies focusing on the siting of air-polluting facilities. Across the United States, more TRI facilities have been found to be located in highly segregated counties and census tracts with higher proportions of Black residents and Hispanic residents. 37 These results were echoed in case studies in the Atlanta, Georgia, and Charleston, North Carolina, Metropolitan Statistical Areas and in Harris County, Texas, which found that Hispanic and Black individuals were more likely to be located in tracts with more TRI facilities and concrete batch plants (CBPs).38,39,40 Similarly, in Lubbock County, Texas, minority populations were located in closer proximity to toxic waste-releasing sites than White neighborhoods, 41 and in New Jersey, it was found that the density of air-polluting facilities increases as the percentage of minority population increases. 42 In Upstate New York, some of the highest numbers of TRI facilities were present in clusters with higher proportions of non-White residents, in combination with employment, occupation, and housing criteria. 43
Though environmental justice literature on air quality has covered a variety of regions and relationships, there are still gaps that should be addressed. Much contemporary environmental justice literature focuses on exposure to pollutants, while fewer studies focus on the siting of polluting facilities. In understanding environmental injustice, it is important to identify inequities in the distribution and density of air-polluting facilities, as proximity to such environmental hazards and industrial activity has been noted to increase the likelihood of adverse health outcomes.44,45,46 In addition, the research on the location of facilities can shed light on structural decisions about where to site facilities, which research on exposure alone cannot necessarily do.
There are also relatively few articles specifically examining emissions-release permitting as it relates to environmental racism. One study found that, in New Jersey, fewer enforcement actions for noncompliant air-polluting facilities and lower penalty amounts were associated with areas of higher percent minorities, and facilities with significant violations were associated with minority communities. 47 A study using CBP permits in Harris County, Texas, found that permit emissions thresholds for CBPs are higher in areas of higher Hispanic and Black populations. This study also noted a lack of CBPs in a certain predominantly White and high-income area of Houston, along with an overall trend of more CBPs in more Black and Hispanic communities, suggesting disproportionate siting and permitting patterns. 48 A study in Louisiana found that permitting has enabled a pattern of industrialization such that emissions of industrial pollutants in industrialized communities with higher percentages of people of color (POC) are 7–21 times higher than in industrialized White communities. 49 It has also been noted that siting patterns may have shifted over time, as one study observed a transition in the location of toxic storage and disposal facilities in Texas from predominantly Black communities to predominantly Hispanic communities. 50
One permitting issue of concern that warrants examination is the registration of Permits by Rule (PBR) in Texas. The EPA has allowed state permitting authorities to create streamlined procedures for permitting insignificant projects at minor sources of air pollution by issuing generic authorizations for narrowly defined source or project categories. These generic authorizations are often referred to as general permits or PBRs. In Texas, PBRs represent a middle ground permitting option an emitting facility can use to satisfy the Texas Commission on Environmental Quality’s (TCEQ) air authorization requirements. PBRs can be used for facilities that emit more than a “de minimis” level of emissions, meaning emissions that have no significant impact on the air, but less than what would qualify for other New Source Review permitting options from TCEQ according to certain thresholds for carbon monoxide, nitrogen oxides, volatile organic compounds, sulfur dioxide, inhalable PM, and any other air contaminants aside from water, nitrogen, ethane, hydrogen, and oxygen. However, environmental justice and conservation organizations have identified several ways that Texas’ PBR program fails to comport with federal public participation requirements and suggest that some PBR approvals are not limited to insignificant projects and may be used to authorize multiple cumulatively significant projects at the largest major sources in the state. 51 These shortcomings identified in Texan PBRs should be examined for environmental justice concerns not just from a regulatory standpoint but from a statistical one as well; though PBRs generally represent middle-ground emission levels, it is possible that numerous PBR registrations could be disproportionately concentrated in certain locations and thereby cumulatively impact the communities in those areas.
Using the EPA’s Enforcement and Compliance History Online (ECHO) database, this study aims to examine patterns of racial inequity in the siting of active high emissions facilities at multiple geographic levels and analyze PBR registrations across the state of Texas. According to the Clean Air Act (CAA), a major facility is a stationary source that has the potential to emit at least 100 tons of pollutants into the air annually. While multiple minor emissions facilities can also pose health risks, we focus on major facilities in this study because they are subject to stricter monitoring and emissions requirements, including more permitting requirements at the construction stage. Identifying how high emissions facilities relate to the percentage POC will aid in understanding possible racial discrimination in emissions facility locations, and analyzing PBRs will aid in identifying potential environmental racism in Texas air-permitting processes.
METHODS
Data
Data on facility locations were obtained from the EPA’s ECHO database. 52 These data contain facility name, ID, address, and latitude and longitude location information for 2738 active major air emission sources in Texas. The dataset also contains information related to air compliance status and violation history. A map of these facility locations by CAA violation status is shown in Figure 1.

Map of Texas with locations of all high emissions facilities assessed. Facilities are colored by compliance status.
Demographic data related to the percentage of POC were collected at the 3- and 1-mile radius level from facilities where available using the EPA EJScreen tool. 53 Demographic data on percentage of POC, percentage of Black, and percentage of Hispanic at the block group, census tract, and county levels were obtained from the 2015–2019 American Community Survey. 54 City-level data were obtained from the U.S. Census Bureau using the “city, town, place equivalent, and township” geographic level. For all analyses, the percentage of POC refers to all of the population other than the non-Hispanic White population. The demographic data were combined with the facility location data using latitude and longitude.
Data on PBR registrations were provided by Texas RioGrande Legal Aid and included the number of PBR registrations per facility for the cities of Houston, Beaumont, and Corpus Christi. Due to the high number of facilities with PBR registrations in the greater Houston area, only facilities in that area that have 20 or more registrations (used as a threshold to differentiate facilities that frequently rely on PBR registrations as compared to one-off cases) and those with available address information are considered in this analysis. Overall, we assess 198 facilities with PBR registrations, 146 of which are in Houston, 21 of which are in Corpus Christi, and 31 of which are in Beaumont. Again, we obtain a 3-mile radius percentage of POC data for each facility with PBR registrations using EPA’s EJScreen tool.
Analysis
To assess patterns and relationships between emissions facility siting and high percent minority communities, spatial visualizations of facilities and POC percentages across the state were examined, and then a city-by-city analysis and linear regression analysis were carried out.
In the city-by-city analysis, the top 10 cities in Texas with the highest number of emissions facilities were identified and 3-mile radius percentages of POC data were obtained for each facility using EJScreen. The distribution of the data was then examined for each of the top 10 cities, and the average 3-mile radius percentage POC was compared with the city overall, county the city is in, and state values of percent POC using a 1-sample t-test. p-Values less than 0.10 were accepted as significant.
In the linear regression analysis, we fit three separate linear regressions across the entirety of Texas: one with the percentage of POC, one with the percentage of the Black population, and one with the percentage of the Hispanic population as the predictor variable. We focus on these variables of race because environmental racism is the specific focus of this article. The outcome variable is the number of high emissions facilities within a county. For each regression, we also control for the total area of the county, as it could be expected that, if facilities were evenly distributed, larger areas would be expected to contain more facilities. Each model, then, will provide us with quantitative information about how the number of facilities is associated with each demographic variable. These three regressions are then repeated at the individual county level for Harris and Dallas Counties, the two largest counties in Texas by population, with the unit of analysis being census block groups within the county. Again, we control for the total area of the census block group and fit three separate models for each county.
To analyze racial disparities in PBR registrations, we examined the breakdown of PBR-registered facilities split by those that have a majority of POC residents within a 3-mile radius of the facility versus those with a majority of White residents within the facility’s 3-mile radius. This analysis was then repeated, with the breakdown of facilities with PBR registrations split by those with a 3-mile percent POC higher or lower than the state average, which was 59.7% in 2021.
RESULTS
Spatial visualizations
To visually assess the distribution of facilities at a county level, we produce a density map of facilities per county (Fig. 2). Figure 3 shows the density of facilities with county-level data of the percentage of POC, Black, and Hispanic populations where the shading of the county represents the demographic data and the size of the dot represents the number of facilities. From these visualizations, we see that the largest number of high emissions facilities are located in the southeastern part of Texas, which also corresponds to areas with the highest percentage of Black population. Harris County has the highest number of facilities with 324. Together, Harris County, Jefferson County, Dallas County, and Nueces Counties contain nearly 20% of all major facilities in Texas.

Density map of the number of facilities within each county. Darker colors indicate more facilities.
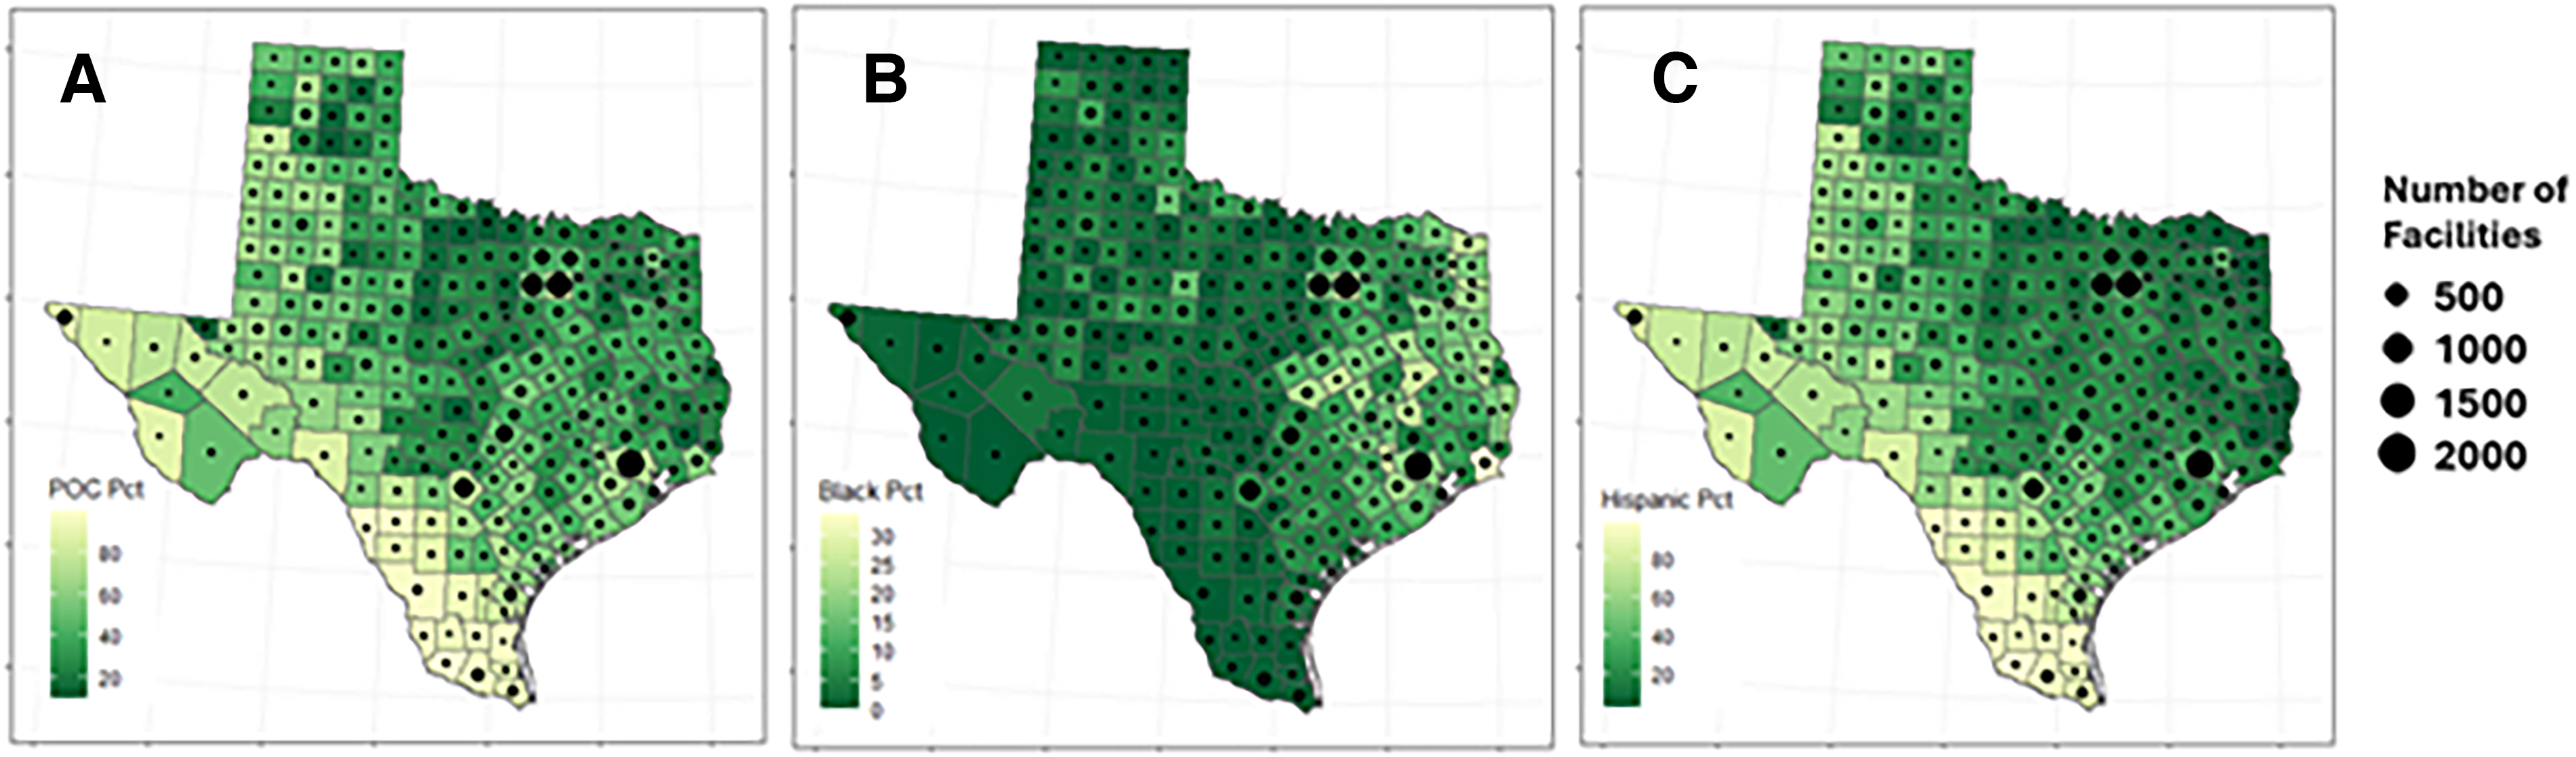
Density map of facilities in each county, with shading indicating the overall percentage of
City-by-city analysis
The top 10 cities (Table 1) with the highest number of facilities contain a combined total of facilities, which represents approximately 18% of the facilities for all of Texas.
Top 10 Cities with the Highest Number of High Emissions Facilities

The results of the 1-sample T-test used to determine whether variations between the average 3-mile percentage of POC and the average city and county percentage of POC were significant are shown in Table 2. These percentages of POC values are also listed by city in Table 2, along with sample size information and p-values for each city.
Sample Sizes, POC Percentage, and Significance Levels in the City-by-City Analysis
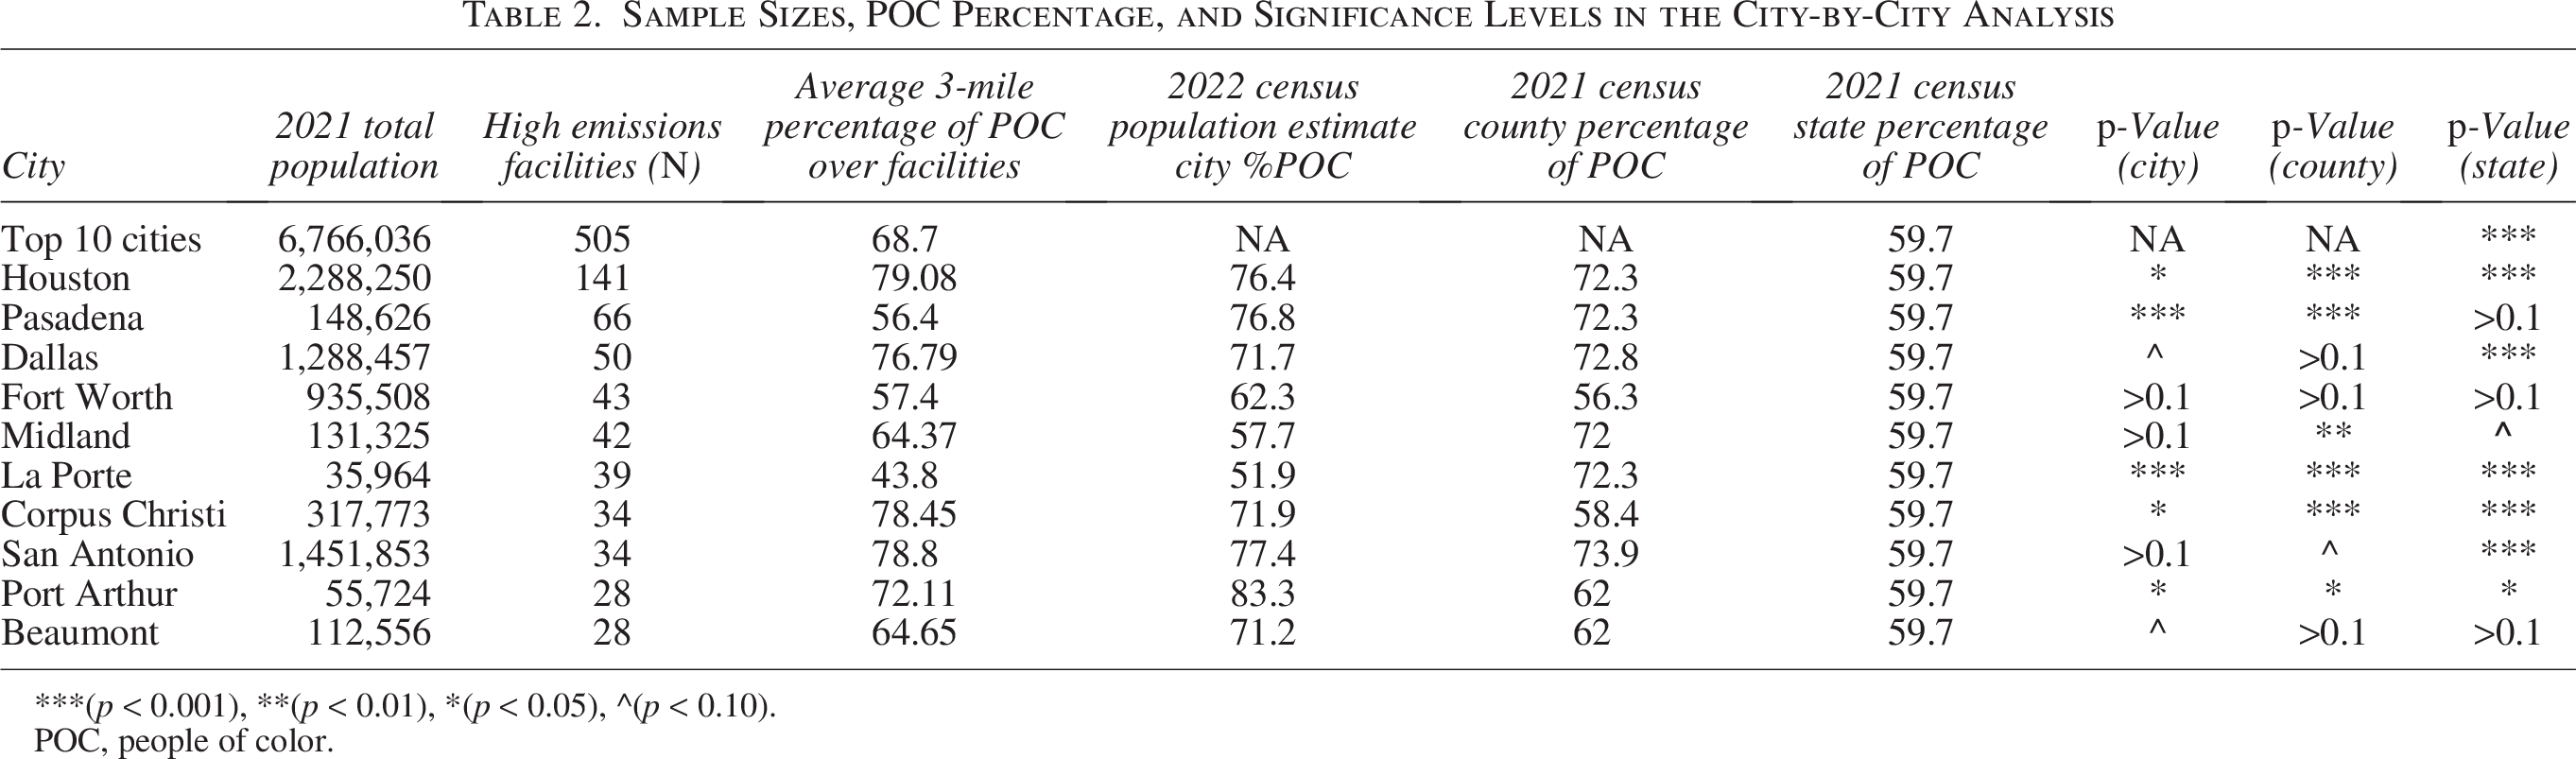
(p < 0.001), **(p < 0.01), *(p < 0.05), ^(p < 0.10).
POC, people of color.
For five of the top 10 cities (Houston, Dallas, Midland, Corpus Christi, and San Antonio), results indicate that more high emissions facilities are located in areas with a higher percentage of POC compared to the city average (Table 2). Of these cities, Houston, Dallas, and Corpus Christi had an average percentage of POC within the 3-mile radius that was statistically significantly higher than the city percentage of POC value. When comparing the average 3-mile percentage of POC values with the city percentage of POC values, cities exhibiting a larger number of high emissions facilities in high POC areas captured 5,477,658 total residents or 81% of the population in these top 10 cities. Cities where the skew is statistically significant compared with the county-level baseline represent 3,894,480 total residents, or 58% of the population in the top 10 cities.
When comparing with county percentage POC values, cities exhibiting a larger number of facilities in areas with a higher average percentage of POC than the county value include Houston, Dallas, Fort Worth, Corpus Christi, San Antonio, Beaumont, and Port Arthur. Of these cities, Houston, Corpus Christi, Port Arthur, and San Antonio had an average percentage of POC within the 3-mile radius that was statistically significantly higher than the county percentage of POC value. When comparing the average 3-mile percentage of POC values with the county percentage of POC values, cities exhibiting a larger number of high emissions facilities in high POC areas captured 6,337,565 total residents or 94% of the population in these top 10 cities. Cities where the skew is statistically significant compared with the county-level baseline represent 4,113,600 total residents or 61% of the population in the top 10 cities.
The average (overall facilities) 3-mile percentage of POC for the top 10 cities is 68.7. This average is significantly higher than the state percentage of POC of 59.7% (Table 2). We find that Houston, Dallas, Corpus Christi, San Antonio, Midland, and Port Arthur have facilities in areas that have a statistically higher percentage of POC than the state (Table 2). These cities together contain 5,402,057 residents or 82% of the population of the top 10 cities with the most high emission facilities.
Regression analysis
From the results of the three regressions predicting the number of facilities within a county for all of Texas, it was found that all coefficients for the models are positive, while only the models with the percentage of POC and percentage of Black populations are statistically significant (Table 3). More specifically, a 1% increase in the percentage of POC in a county corresponds to a predicted increase of 0.20 facilities. A 1% increase in the percentage of the Black population corresponds to an additional 0.98 facilities in that county. In other words, a single percent increase in the percentage of the Black population in a county predicts the location of an additional high emission facility. We also ran a regression model that included controls for median income and population density and found that the percentage of the Black population remained significant and positive (see Supplementary Table S1).
Regression Model Results for all of Texas at the County Level
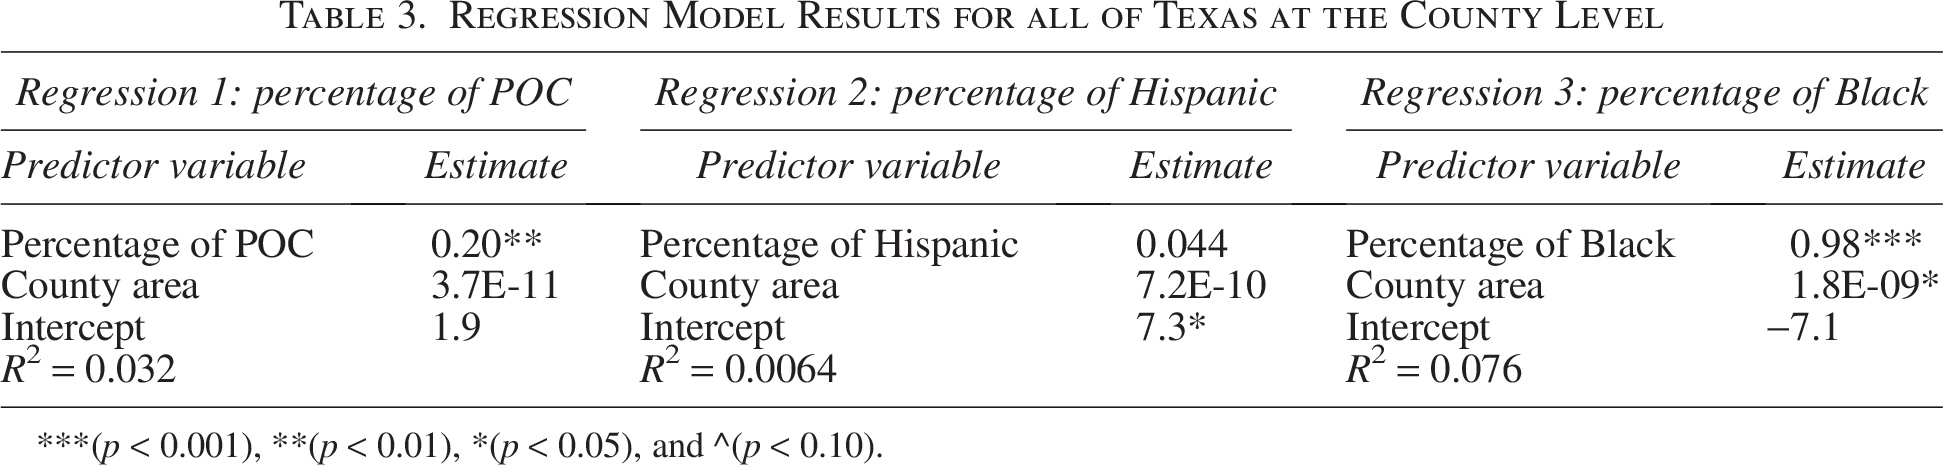
(p < 0.001), **(p < 0.01), *(p < 0.05), and ^(p < 0.10).
From the regression for Harris County alone, our results indicate that the number of high emissions facilities is positively and statistically significant with the percentage of Hispanic population, indicating that block groups with higher levels of Hispanic residents are statistically more likely to have more facilities (Table 4). This relationship persists when controlling for income and population density (Supplementary Table S2). In Dallas County, both the models using the percentage of POC and percentage of Black population were statistically significant with positive coefficients, again indicating a statistically significant association between areas with higher percentage of POC or percentage of Black populations and higher numbers of high emission facilities (Table 5). However, these relationships are no longer significant when controlling for income and population density, but results indicate that higher-income Census block groups correspond to significantly fewer high emissions facilities, indicating overlapping socioeconomic challenges (Supplementary Table S3).
Regression Model Results for Harris County at the Census Block Level

(p < 0.001), **(p < 0.01), *(p < 0.05), ^(p < 0.10).
Regression Model Results for Dallas County at the Census Block Level
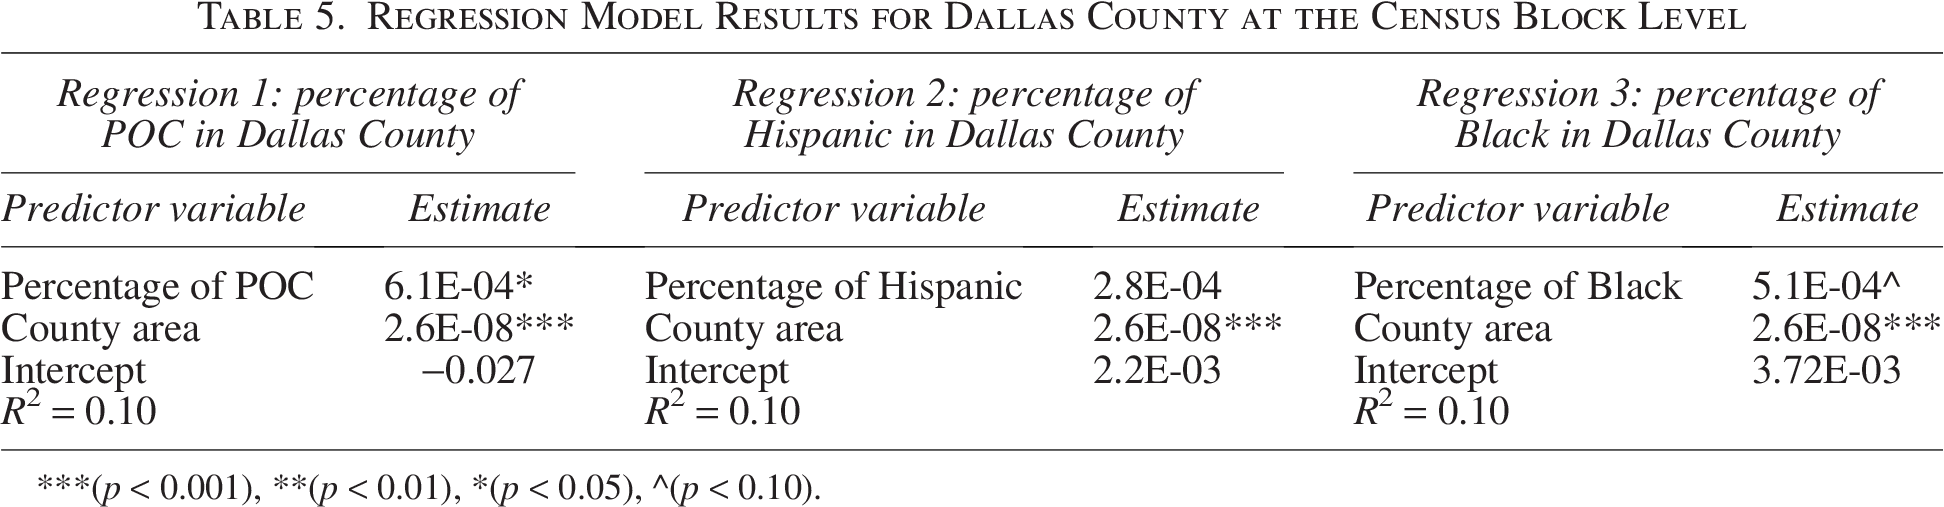
(p < 0.001), **(p < 0.01), *(p < 0.05), ^(p < 0.10).
PBR analysis
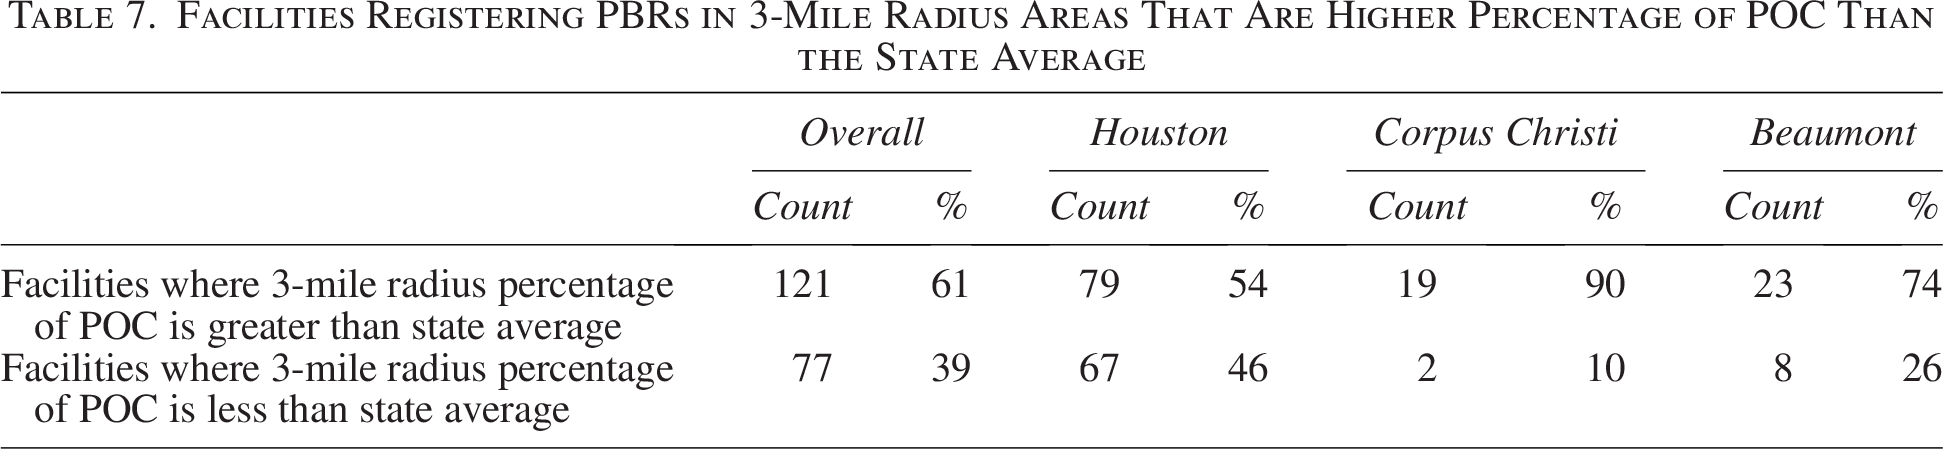
Overall, an average of 67% of the facilities with PBR registrations are in majority POC 3-mile radius areas with a range from 60% of facilities in Houston to 95% of facilities in Corpus Christi (Table 6). We also identify the facilities PBR registrations split by those that are in areas with higher or lower percentages of POC than the state average (59.7%) (Table 7). Overall, 61% of the facilities with PBR registrations are in areas with a higher percentage of POC than the state as a whole, and this is as high as 90% for Corpus Christi (Table 7).
Facilities with Registered PBRs in Majority POC Versus Majority White Locations for Houston, Corpus Christi, and Beaumont
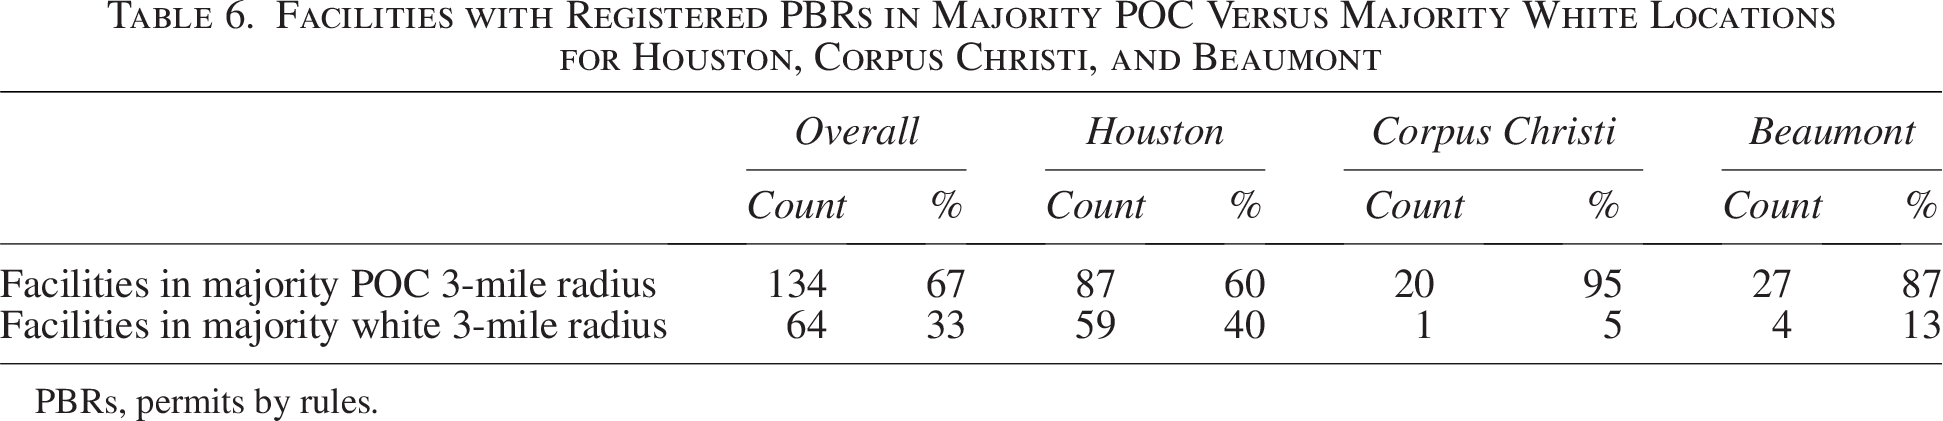
PBRs, permits by rules.
Facilities Registering PBRs in 3-Mile Radius Areas That Are Higher Percentage of POC Than the State Average
DISCUSSION
In this analysis of high emissions facility locations and racial demographics across Texas, we identify several key ways facilities disproportionately burden communities of color, especially communities with higher percentages of Black and Hispanic residents. First, through data visualization, we show that facilities are highly concentrated in the southeastern part of the state, which also corresponds to the highest percentages of Black populations. Through a more detailed city-by-city analysis, we show that several of the cities with the highest emissions facilities, namely Houston, Corpus Christi, Port Arthur, and San Antonio, have facilities located in areas that have a significantly higher percentage of POC than the county as a whole. Houston, Dallas, and Corpus Christi have facilities located in areas with significantly higher percentages of POC than the percentage of POC in each respective city. Moreover, across these top 10 cities with high emissions facilities, 94% of the population lives in a city where facilities are located in areas with a higher percentage of POC than the county, and 81% of the population lives in a city where the average facility 3-mile percentage of POC value is higher than that of the city itself. These results suggest that emissions facility locations tend to be located in areas with a higher percentage of POC for some cities, particularly those with higher populations.
Using regression analysis, we further show that counties across Texas with higher percentages of POC and Black populations are predictive of that county housing a greater number of high emissions facilities. A 1% increase in the percentage of the Black population corresponds to an additional 0.98 facilities in that county. In other words, a single percentage increase in the percentage of the Black population in a county predicts the location of an additional high emissions facility. However, we see that these relationships vary when we zoom into individual counties. In Harris County, higher percentages of Hispanic populations are predictive of more facilities. In Dallas County, the percentage of POC and the percentage of the Black population are key predictors of facilities.
The lack of a statistically significant association between the percentage of POC and the percentage of the Black population and the number of facilities in Harris County (and, similarly, between the percentage of the Hispanic population and the number of facilities in Dallas County) could be in part due to limitations in the use of block group-level demographic data. A block group may have different overall population characteristics when compared with the characteristics of the population closest to a facility. The result might be that block groups underestimate the minority population affected by a facility. For example, ExxonMobil’s Chemical Plant in Baytown is located in a census block that is majority non-Hispanic White (66%), but the communities closest to the facility are majority communities of color. Based on EJScreen, 75% of the population within a 3-mile radius and 85% of the population living within a 1-mile radius of the ExxonMobil Chemical Plant in Baytown are POC. This example is offered to highlight the limitations of using block group demographics, which may, in some cases, obscure the characteristics of communities that are closest to these facilities. Conversely, some studies have indicated that though the use of more granular spatial units may seem more suited for statistical analysis of environmental justice issues, analysis results have suggested that minority communities are not concentrated immediately around hazardous facilities but within slightly larger distances of those facilities, almost in a “bull’s-eye” fashion.55,56 More research should be conducted into the patterns of minority population distribution surrounding hazardous facilities to improve the analysis of inequity regarding the siting of these facilities. In addition, these spatial variances in regression results support the exploration of geographically weighted regression for environmental justice analyses to better understand spatial patterns of injustice, as geographically weighted regression has been shown to identify local variations in relationships that are obscured by traditional linear regressions. 57
Finally, in the analysis of facilities with PBR registrations, we find that the majority of these facilities are in areas that are majority POC within a 3-mile radius. This is as high as 95% of facilities with PBR registrations in Corpus Christi existing in the majority of POC areas. This pattern holds even when comparing splitting facilities by the average percentage of POC in Texas, with as many as 90% of facilities with PBR registrations in Corpus Christi having a 3-mile percentage of POC values higher than the state value. These results indicate that facilities with PBR registrations are more likely to be located in the majority of POC communities. This pattern could be in part due to those cities having an average facility 3-mile radius percentage of POC value higher than the state percentage of POC value and thus warrants further investigation to determine if a conclusive relationship exists specifically between PBR registrations and communities of color.
CONCLUSIONS
In this study, we analyzed racial disparities in the siting of high emissions facilities across Texas and examined the breakdown of facilities with PBR registrations with respect to the percentage of POC within a 3-mile radius of those facilities. Our findings indicate that the majority of residents in the top 10 cities with the most facilities live in a city where facilities are located in areas with significantly higher percentages of POC than the city, county, and state values. Furthermore, regression analysis indicated that significant relationships exist between the percentage of POC, Hispanic residents, or Black residents and the number of facilities within a geographic unit. Across Texas, there is a 1-to-1 relationship between the percentage of Black residents in a county and the number of facilities in that county. In Harris County, the number of facilities is significantly higher in block groups with higher percentages of Hispanic populations. In Dallas County, the number of facilities within a block group is predicted by the percentage of POC and the percentage of the Black population in that block group. Finally, in our PBR analysis, it was found that the majority of facilities with PBR registrations are located in areas that are majority POC within a 3-mile radius.
Overall, our results highlight multiple ways that the locations of these high emissions facilities are disproportionately burdening POC in Texas. More work is needed to understand spatial variations in the relationship between high emissions facilities and communities of color, as well as how those facilities may affect these communities in terms of air quality, health, and pollution implications. Health, in particular, would be an important factor to analyze to corroborate the findings of this study, as it is important from an environmental justice perspective to examine whether health conditions associated with major air pollutants such as cancer, heart disease, and asthma disproportionately affect communities of color in Texas at levels comparable with the disproportionate siting of high emissions facilities in communities of color found in this study. Such investigation could lend itself to decision making in health care, facility siting, and emissions permitting policy. More work could also consider how the locations of these high emissions facilities may disproportionately burden other disadvantaged communities across Texas, such as women, people with disabilities, and low-income groups. In addition, because this study focused on spatial variations exclusively for high emissions facilities, further work could be done in conducting similar analyses for lower emission facilities or facilities across all emissions levels.
AUTHORS’ CONTRIBUTIONS
A.A. collected data, conducted analysis, wrote the original draft, and contributed revisions. K.B. collected data, conducted analysis, wrote the original draft, and contributed revisions.
Footnotes
ACKNOWLEDGMENTS
A sincere thank you to Dr. Deb Niemeier for mentorship and support in research design.
AUTHOR DISCLOSURE STATEMENT
No competing financial interests exist.
FUNDING INFORMATION
This work was supported by the
Supplemental Material
Supplemental Material
Supplemental Material
1
United States Environmental Protection Agency. 2024. “Environmental Justice.” US EPA. May 9, 2024.
2
3
4
United Church of Christ. Commission for Racial Justice. Toxic wastes and race in the United States: A national report on the racial and socio-economic characteristics of communities with hazardous waste sites. Public Data Access, 1987.
5
7
8
9
10
11
12
Wilson, Sacoby M., Herb Fraser-Rahim, Edith Williams, Hongmei Zhang, LaShanta Rice, Erik Svendsen, and Winston Abara. 2012. “Assessment of the Distribution of Toxic Release Inventory Facilities in Metropolitan Charleston: An Environmental Justice Case Study.”
13
14
15
16
17
18
19
20
21
22
23
24
25
26
27
28
29
30
31
32
33
34
35
36
37
38
39
40
Wilson, Sacoby M., Herb Fraser-Rahim, Edith Williams, Hongmei Zhang, LaShanta Rice, Erik Svendsen, and Winston Abara. 2012. “Assessment of the Distribution of Toxic Release Inventory Facilities in Metropolitan Charleston: An Environmental Justice Case Study.” American Journal of Public Health 102 (10): 1974–80. ![]()
41
42
43
44
45
46
47
48
49
50
51
52
55
56
Supplementary Material
Please find the following supplemental material available below.
For Open Access articles published under a Creative Commons License, all supplemental material carries the same license as the article it is associated with.
For non-Open Access articles published, all supplemental material carries a non-exclusive license, and permission requests for re-use of supplemental material or any part of supplemental material shall be sent directly to the copyright owner as specified in the copyright notice associated with the article.