
Abstract
Salmonella is a major cause of human gastroenteritis worldwide. To prioritize interventions and assess the effectiveness of efforts to reduce illness, it is important to attribute salmonellosis to the responsible sources. Studies have suggested that some Salmonella subtypes have a higher health impact than others. Likewise, some food sources appear to have a higher impact than others. Knowledge of variability in the impact of subtypes and sources may provide valuable added information for research, risk management, and public health strategies. We developed a Bayesian model that attributes illness to specific sources and allows for a better estimation of the differences in the ability of Salmonella subtypes and food types to result in reported salmonellosis. The model accommodates data for multiple years and is based on the Danish Salmonella surveillance. The number of sporadic cases caused by different Salmonella subtypes is estimated as a function of the prevalence of these subtypes in the animal-food sources, the amount of food consumed, subtype-related factors, and source-related factors. Our results showed relative differences between Salmonella subtypes in their ability to cause disease. These differences presumably represent multiple factors, such as differences in survivability through the food chain and/or pathogenicity. The relative importance of the source-dependent factors varied considerably over the years, reflecting, among others, variability in the surveillance programs for the different animal sources. The presented model requires estimation of fewer parameters than a previously developed model, and thus allows for a better estimation of these factors to result in reported human disease. In addition, a comparison of the results of the same model using different sets of typing data revealed that the model can be applied to data with less discriminatory power, which is the only data available in many countries. In conclusion, the model allows for the estimation of relative differences between Salmonella subtypes and sources, providing results that will benefit future risk assessment or risk ranking purposes.
Introduction
S
Humans can be infected with Salmonella from various sources. Domestic animals are among the main reservoirs of Salmonella. Although direct contact with live animals, environmental transmission, and person-to-person transmission can be responsible for human infection (Wallace and Thompson, 2006; Baker et al., 2007; O'Reilly et al., 2007), the most common source of exposure is food borne. The contribution of the major food production animal sources to human infections has been previously assessed (Van Pelt et al., 1999; Hald et al., 2004, 2007; Wallace and Thompson, 2006; Valkenburgh et al., 2007).
Studies have suggested differences in the outcome of human salmonellosis caused by different Salmonella serotypes (Helms et al., 2003; Jones et al., 2008). Jones et al. (2008) reported differences in the fatality rate, rate of invasive disease, and hospitalizations, concluding that Salmonella serotypes are closely related genetically, yet differ significantly in their pathogenic potentials. In an older study, Helms et al. (2003) estimated a higher mortality rate in patients infected with Salmonella Dublin when compared with other Salmonella serotypes. There is also emerging evidence that antimicrobial-resistant Salmonella cause more severe infections (Helms et al., 2005; Varma et al., 2005a, 2005b) and are associated with an increased rate of hospitalization. A possible explanation is that resistant Salmonella may be more virulent (Varma et al., 2005b). Differences in the number of cases caused by different serotypes also suggest that Salmonella subtypes may have different abilities to cause disease (Hald et al., 2004; Galanis et al., 2006).
Several countries have implemented intervention programs to prevent and control foodborne diseases during the last decades, particularly foodborne zoonoses (Wegener et al., 2003; EFSA, 2007). The effectiveness of the control measures implemented in the major food-producing animal systems on the reduction of the number of human cases attributable to each of these sources can be assessed by a variety of attribution methods (Batz et al., 2005; Pires et al., 2009). To get a better understanding of the mechanism behind the dynamics in the occurrence of Salmonella infections in humans, Hald et al. (2004) developed a “microbial subtyping approach.” The method estimates the number of human cases attributable to each of the major animal-food sources. The principle is to compare Salmonella subtypes isolated from animals and food with Salmonella subtypes isolated from humans, assuming that the subtypes are clonally distributed in the different sources. The stochastic model is built in a Bayesian framework and enables the analysis of the differences between the various Salmonella subtypes and food sources regarding their ability to cause infections in humans. The method is routinely applied at the Danish Zoonosis Centre, National Food Institute, and the results are published in the Annual Report on Zoonoses in Denmark (e.g., Anonymous, 2006). Microbial subtyping has proven to be a valuable tool in focusing food safety interventions to the appropriate animal reservoir in Denmark and provides an example of potential synergy between quantitative risk assessment and public health surveillance (Wegener et al., 2003; Hald et al., 2004).
The aim of this study was to estimate the differences in the ability of different Salmonella subtypes and food-animal sources to cause disease, and to explore whether the developed method can be applied to data with less discriminatory power, for example, when only serotyping information is available, which is the case in many countries. On the basis of the method described by Hald et al. (2004), we present a three-dimensional model that accommodates data for multiple years. Our hypothesis was that this allows for the estimation of more robust estimates, particularly of the subtype-related factors, which may be used to assist other risk assessment studies.
Materials and Methods
Integrated surveillance in Denmark
In Denmark, all major food animals and food of animal origin are monitored for Salmonella (Wegener et al., 2003). The structure and output of the surveillance are routinely published in the Annual Report prepared by the Danish Zoonosis Centre (Anonymous, 2006). All isolates collected as part of the surveillance programs are submitted to the National Food Institute (Food-DTU) for serotyping, and all Salmonella Typhimurium and Salmonella Enteritidis are phage typed. Isolates of animal and food origin are tested for susceptibility toward antimicrobials (DANMAP, 2007). For live animals, generally only one Salmonella isolate per epidemiological unit (e.g., herd, flock) is included, whereas all isolates collected at slaughterhouses, retail, or importers' premises are tested.
Human cases of salmonellosis are reported to the Statens Serum Institute (SSI), the reference laboratory for enteric pathogens and responsible for the laboratory-based surveillance. For a proportion of the cases, information regarding international traveling before the onset of symptoms is available. In 2007 the collection of travel information for human cases improved when compared with previous years. In this year, the SSI retrospectively interviewed a significant part of the patients with no travel information reported by their general practitioner. The patients were asked if they had been traveling abroad in the 7-day period before disease onset.
All human Salmonella isolates are serotyped at the SSI, and all Salmonella Enteritidis and Salmonella Typhimurium are forwarded to Food-DTU for phage typing. Susceptibility to antimicrobials was tested at SSI (DANMAP, 2007).
Human and animal-food Salmonella surveillance data are collected and analyzed at the Danish Zoonosis Centre, National Food Institute, which is responsible for the integrated surveillance of zoonotic pathogens in the country.
Data included in the model
The input of the model included surveillance data from 2005 to 2007 on Salmonella in broiler and layers flocks, pork, beef, imported foods, and humans. The data included information on the Salmonella serotype, Salmonella Enteritidis and Salmonella Typhimurium phage types, and Salmonella Typhimurium antimicrobial resistance profiles. Salmonella Typhimurium isolates were tested for susceptibility to ampicillin, chloramphenicol, sulfonamide, tetracycline, trimethoprim, ciprofloxacin, gentamicin, nalidixic acid, and ceftiofur. The results of the susceptibility test were coded as “R” or “S” when the isolate was resistant or susceptible to the antimicrobial in question, respectively, providing a profile constituted by a sequence of nine letters, corresponding to the drugs in the order listed above (Hald et al., 2007). Isolates resistant to less than four antimicrobials were classified as “resistant,” isolates resistant to four or more antimicrobials were classified as “multiresistant,” isolates resistant to nalidixic acid were classified as “quinolone resistant,” and isolates fully susceptible to all tested drugs were classified as “susceptible.”
A total of 5080 laboratory-confirmed Salmonella infections reported in the 3-year period were included in the analysis (Appendix). Human laboratory-confirmed sporadic Salmonella infections were attributed to 10 sources in each year: pork, beef, table eggs, chicken, ducks, imported pork, imported beef, imported chicken, imported turkey, and imported ducks. In 2007 the commercial production of duck meat and the surveillance of imported duck meat were discontinued in Denmark.
Model overview
The model was built on the basis of the method described by Hald et al. (2004), where Salmonella subtype distributions in animals and foods in a given year were compared with the subtype distribution in humans. As opposed to the method by Hald et al., the model described here includes data from several years, thereby adding a third dimension to the original model (in addition to subtype and source-related factors).
The method attributes sporadic and domestic cases of Salmonella infection to the responsible sources. A sporadic case is defined as a subject that could not be associated with a recognized foodborne disease outbreak. To avoid biased results, it is important to identify cases that are part of an outbreak (Hald et al., 2004). Outbreak-related cases except one per subtype were subtracted from the total number of observed cases. The remaining outbreak cases were added to the final results of the model and attributed either to the source implicated in the outbreak or to outbreaks with unknown source. A domestic case is defined as a subject who had not been traveling before the disease onset. It is assumed that all cases who had been traveling abroad 1 week before the onset of symptoms were travel related. However, not all cases had travel information, and thus the “true number” of travel-related cases was estimated on the basis of the reported number of travelers per subtype; a beta distribution was applied to estimate the possible extratravelers per subtype.
We included a total of 27 different serotypes, 5 Salmonella Enteritidis phage types, and 21 combinations of Salmonella Typhimurium phage type and antimicrobial resistance profile in the model. Subtypes that were not isolated from any animal or food source or which caused less than 10 cases in only 1 or 2 years were grouped into “other serotypes.” Human cases caused by these subtypes were either attributed to travel or to an “unknown” source category.
Model parameters
Based on the observed surveillance data, the model estimates the number of cases of sporadic salmonellosis attributed to each source per year and the relative impact of a set of unknown factors. These factors were included as multiparameter priors and account for the differences in the ability of different subtypes to cause disease and of different sources to act as vehicles for infection. In this modified approach, multiple loops were included to accommodate data for a period of 3 years. The model parameters are presented in Table 1.
The multiparameter priors constituted a subtype-dependent factor (qi ) and food source–dependent factor (atj ) and were defined as uninformative prior distributions (uniform distributions). The prevalence of Salmonella in the major animal-food sources per year (ptij ), the amount of food source available for consumption each year (m j), and the number of reported human cases per type per year (oti ) was applied to update our knowledge on the relative size of these parameters (Equation 1). The subtype-dependent factor was estimated as a one-dimensional parameter (qi ), meaning that it is a property of the Salmonella subtype and assumed independent of the year of analysis. The qi prior for Salmonella Enteritidis was defined as 1, and all qi values were estimated relatively to this one and to each other. It was assumed that all qi for Salmonella Typhimurium phage types with the same resistant pattern were equal. qi describes the differences in the ability of the various Salmonella subtypes to cause human disease, accounting for differences in the subtypes' survivability along the food chain and potential differences in pathogenicity. The food source–dependent factor (atj ) was assumed to vary between the years, accounting for annual variations in sampling schemes and changes in consumption patterns not captured by mj . This factor may also include general variations between sources like the bacterial load/concentration in the food, food characteristics influencing growth behaviour, processing, handling or preparation practices, or factors that affect the prevalence estimates, that is, differences in monitoring systems and analyzing methods. An equal atj for the sources beef and imported beef was assumed.
The model was set up to estimate the number of human sporadic and domestic cases attributed to each source per year (λtji
) and the posterior distributions for atj
and q
i, assuming that the observed number of sporadic cases per subtype per year (oti
) is poisson distributed:
where λtji is the expected number of cases per type i and source j in year t, ptij the prevalence of type i in source j in year t, mtj the amount of source j available for consumption in year t in the country, atj the source-dependent factor for source j in year t, and qi the subtype-dependent factor for type i.
A Markov Chain Monte Carlo simulation, specifically the Gibbs sampler, was applied to arrive to the posterior distributions for atj and qi . Five independent Markov chains of 30,000 iterations were run. For each chain, a different set of starting values for the priors, widely dispersed in the target distribution, was chosen. Convergence was monitored using the methods described by Gelman and Rubin (1992) and was considered to have occurred when the variance between the different chains was no larger than the variance within each individual chain, and when the chains had reached a stable level. The model was set up in WinBugs 1.4.
To test the hypothesis that the presented model allows for the application of the microbial subtyping approach for source attribution to less discriminatory subtyping data, we applied the model to the same data from Danish surveillance (from 2005 to 2007) but included only serotype information.
Results
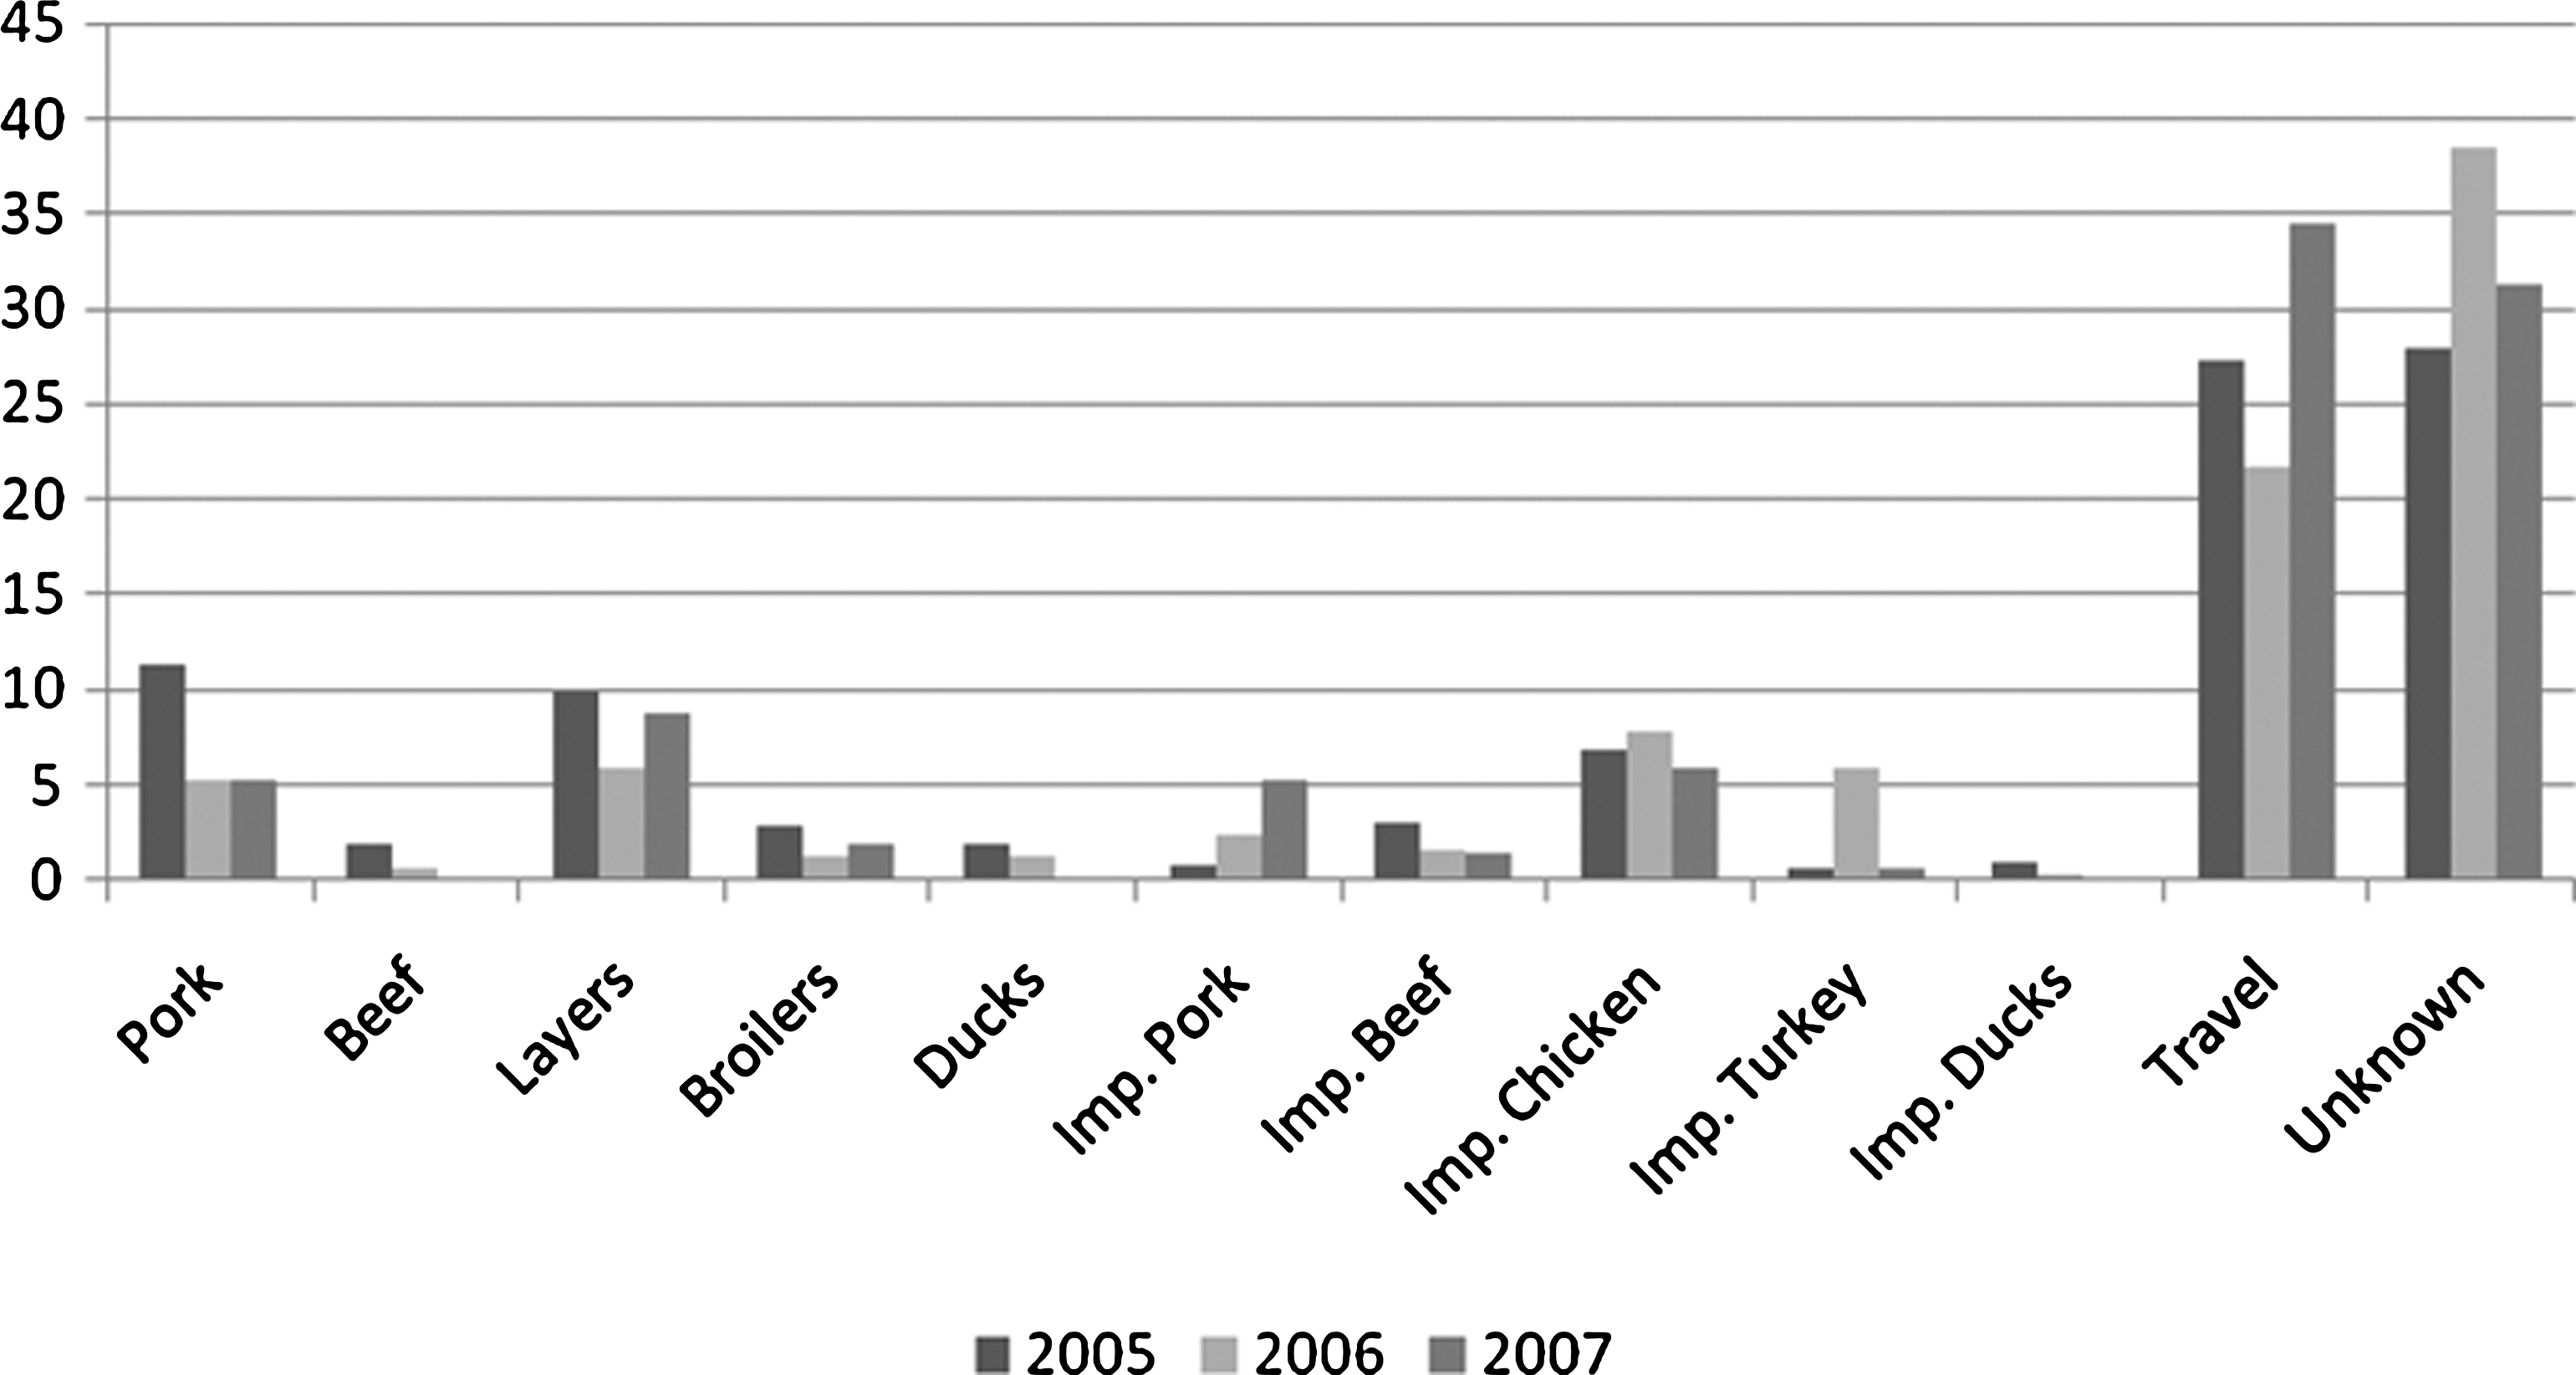
The number of cases attributed to each specific source, to traveling abroad, to outbreaks, and to unknown origin each year is presented in Table 2. Table eggs was the food source causing the highest number of sporadic cases of human salmonellosis in the studied period, followed by imported chicken (Fig. 1). Our results show that the proportion of sporadic Salmonella infections attributed to the consumption of imported pork increased from 2005 to 2007. Imported turkey meat emerged as an important source in 2006, and the reduction in the number of cases attributed to this source in the following year did not reach the proportion estimated in 2005. Overall, imported poultry products were responsible for a decreasing proportion of human cases of salmonellosis.
Proportion of human sporadic cases attributed to specific sources, travel, and unknown (%), 2005 to 2007.
Not monitored.
A substantial increase in the number of cases attributed to traveling abroad in 2007 was estimated. Travel information was available for a total of 44% of the reported cases in this year, whereas only around 30% and 13% of the human cases had travel information in 2005 and 2006, respectively.
On an average, between 28% and 39% of the cases was attributed to an unknown source each year. These cases include human infections caused by isolates with no subtyping information, cases caused by infrequent subtypes, which were grouped in “others,” or cases caused by subtypes not found in any of the monitored sources.
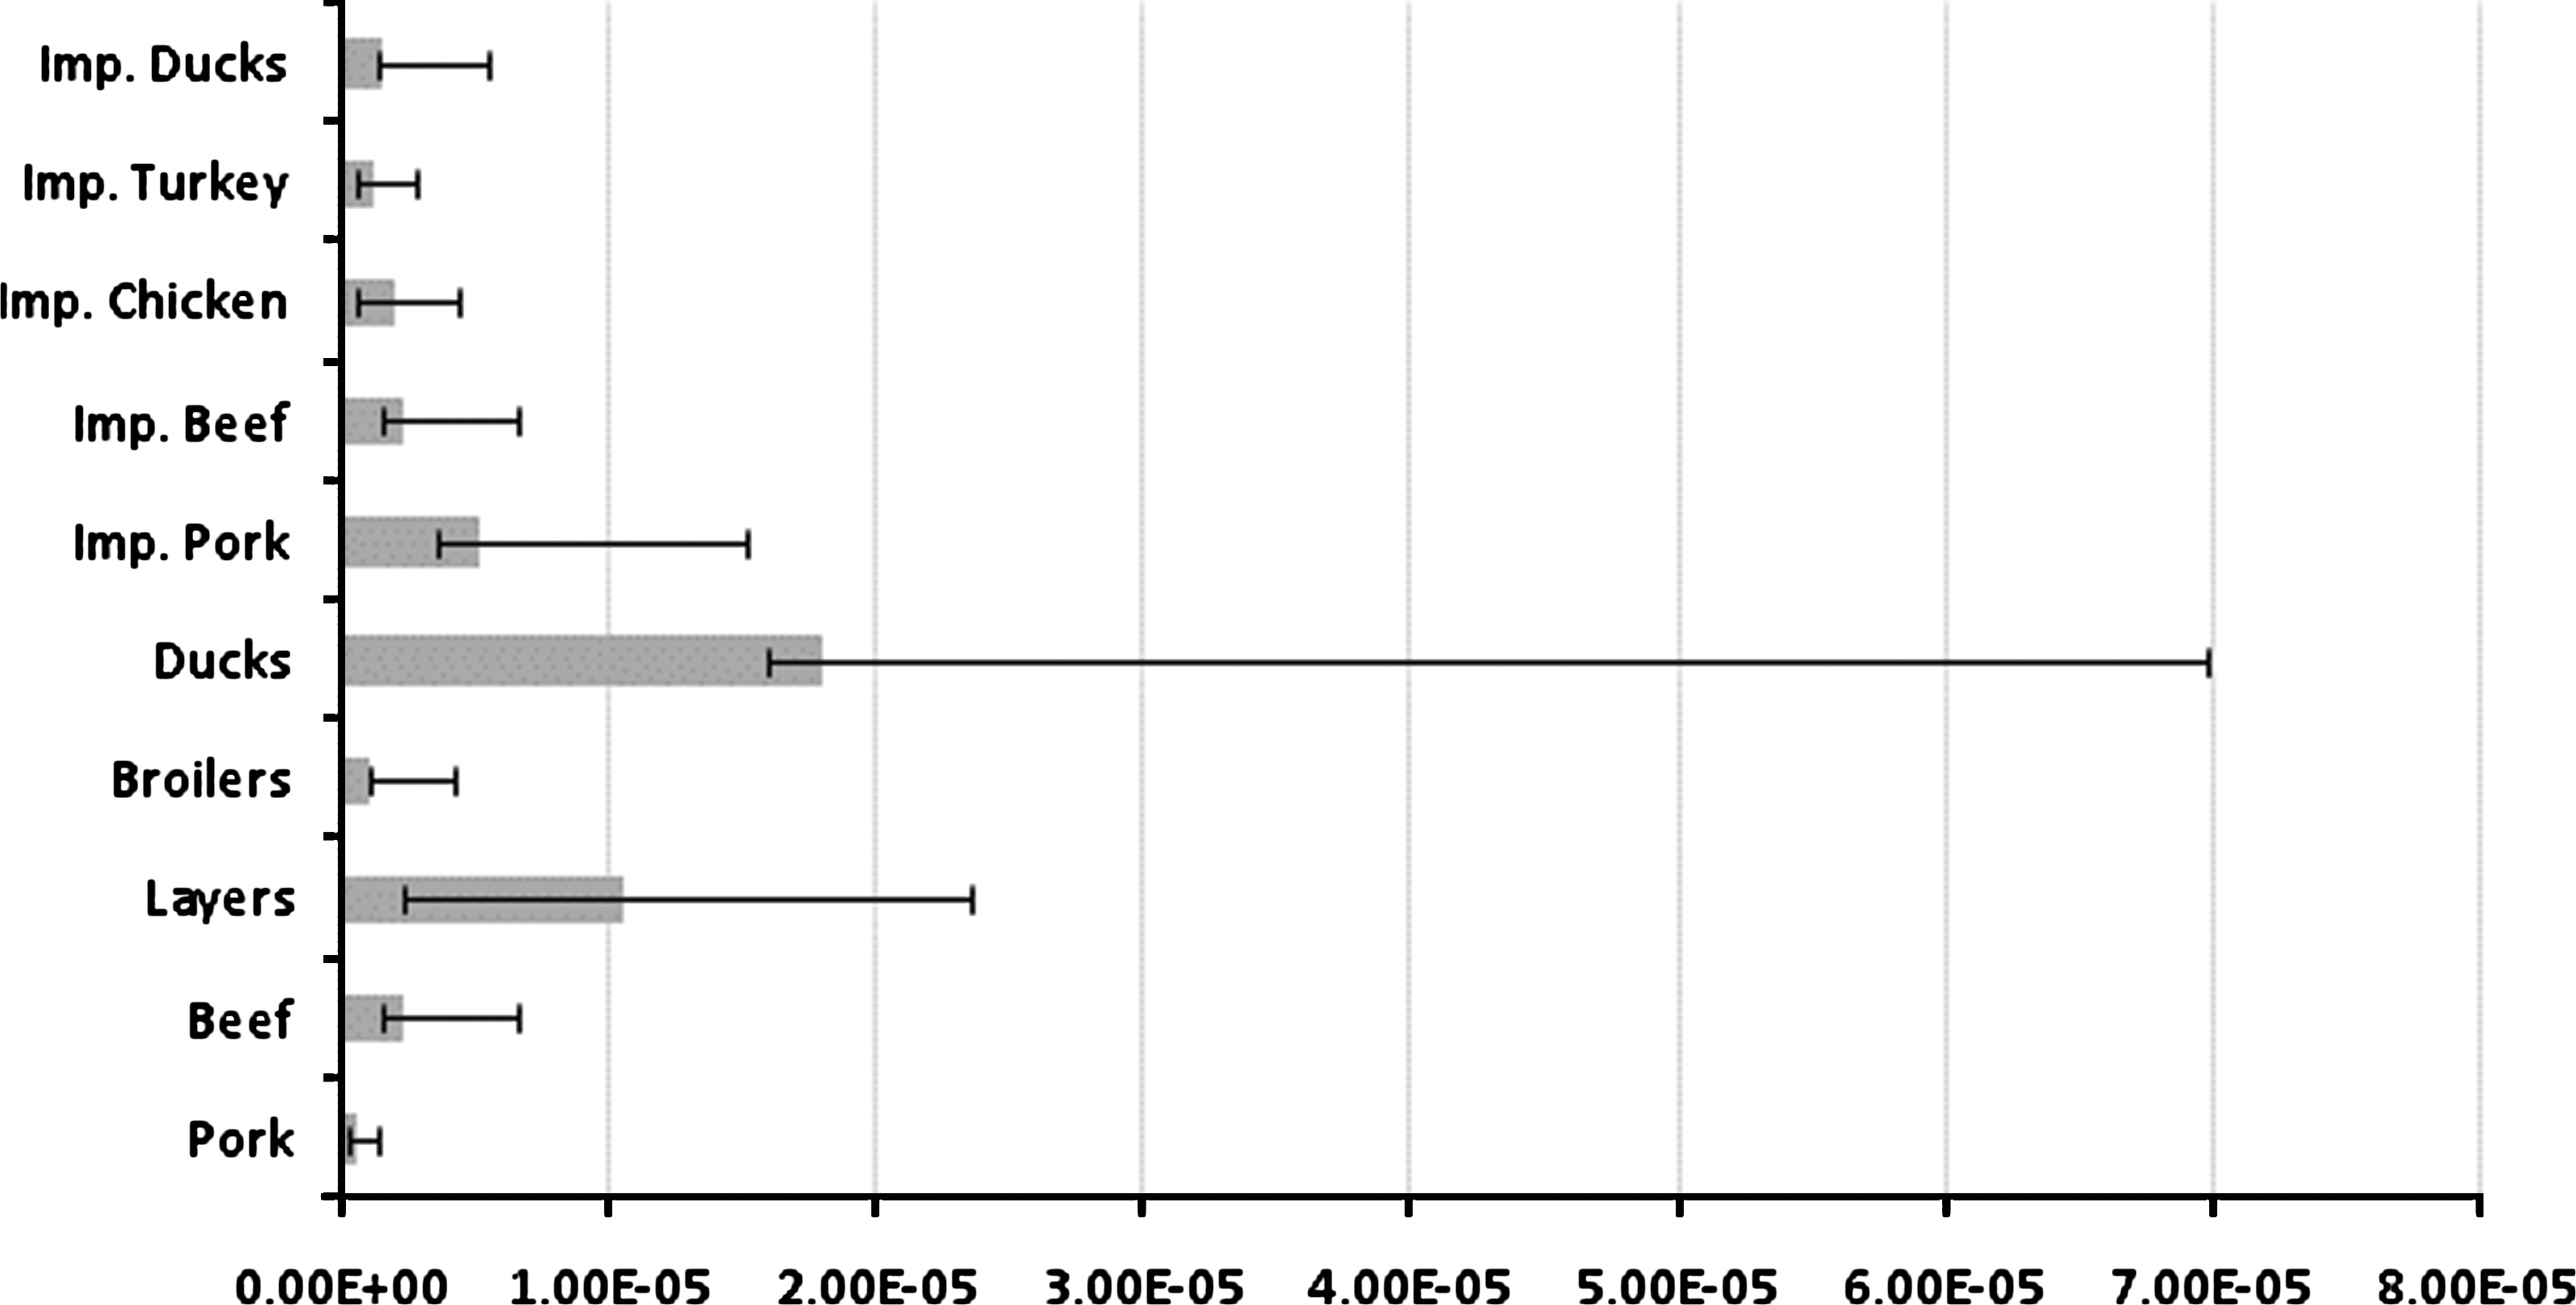
The food source-related factors (atj ) were estimated for each year. The atj for ducks was estimated to have the highest value in 2005 and 2006 (Figs. 2 and 3). In 2007 this source was not considered in the model, as the commercial production of duck meat was discontinued in Denmark. The relative importance of the remaining sources varied considerably over the years. For 2007 the model estimated very high values for the source-dependent factors for imported chicken and imported turkey when compared to the other sources (Fig. 4).

Estimated source-dependent factors (atj ), mean, and 95% credibility intervals, 2005.
Estimated source-dependent factors (atj ), mean, and 95% credibility intervals, 2006.

Estimated source-dependent factors (atj ), mean, and 95% credibility intervals, 2007. The maximum credibility limit value for the source “imported chicken” is not shown.
Figure 5 presents the estimated qi and 95% credibility interval for all Salmonella serotypes and Salmonella Typhimurium phage types, according to the resistance profile. Salmonella Newport, Salmonella Virchow, and Salmonella Thompson were estimated to have a higher ability to cause disease than Salmonella Enteritidis, whereas all remaining subtypes had a qi value lower than 1. The uncertainty around the estimated qi for Salmonella Poona was extremely large (95% credibility interval 0.4–28.5), making the interpretation of the relative importance difficult. For Salmonella Typhimurium subtypes, results yielded a higher mean value for susceptible phage types, followed by multiresistant and resistant phage types in descendent order of importance. However, the posterior distributions were overlapping and the mean values were not statistically significant. Estimated mean values and credibility intervals for the qi are presented in the Appendix.

Estimated subtype-related factors (qi ) (mean and 95% credibility intervals). The qi estimate for Salmonella Poona is not shown in the figure.
The proportion of cases attributed to specific sources in the two models was in agreement, although not precisely the same (Fig. 6). The most significant differences were seen in the proportion of cases attributed to domestic broilers, to which the model using only serotype information attributed a higher number of cases, and on the contribution of table eggs, with variable differences in the 3 years.

Comparison between the proportion of human salmonellosis cases attributed to specific sources from 2005 to 2007 (%) by the model using phage typing data (PT) and by the model using serotyping data (ST).
Discussion
Our results show an increasing trend in the proportion of cases attributed to the consumption of table eggs and imported pork, and a gradual reduction in the proportion of cases attributed to pork, imported poultry products, and beef. When compared with the output of the original, two-dimensional model (Hald et al., 2004), we identify differences in the contribution of some of the sources to the number of human cases over the study period. The most substantial differences are found in the results for 2007, particularly in the number of cases attributed to imported pork and imported chicken; the presented model estimated a 4.5 times higher number of cases attributed to imported pork, and a nearly four times higher number for imported chicken. The proportion of human cases attributed to traveling abroad also differs between the two models, but is consistent in the increasing trend toward the end of the study period. These differences can be explained by the use of a one-dimensional prior for the subtype-dependent factors (qi ) in the described model, which leads to different estimates of the expected number of cases per Salmonella subtype and food source each year.
It is assumed that the characteristics of the subtype-dependent factors (qi ) that affect their ability to cause infections are relatively stable over time, and thus would not suffer major changes in a 3-year period. The resulting estimates for these factors are, therefore, expected to be more robust and give a better description of the differences in the ability of the various Salmonella subtypes to cause human disease.
Overall, the estimates for the subtype-dependent factors were quite similar to each other, particularly when compared to results using the model of Hald et al. (2004), indicating that we did achieve a more robust model. The mean values of the qi were often included in the range of the 95% credibility intervals of other subtypes, suggesting that these may originate from the same distribution.
When focusing on serotypes causing more than 20 human cases in at least two of the years, Salmonella Newport, Salmonella Virchow, Salmonella Enteritidis, Salmonella Agona, and Salmonella Dublin were estimated to have the highest impact on human-reported disease. A second group of serotypes with similar ability to cause disease is identified from Salmonella Bovismorbificans and Salmonella Bredeney (Fig. 5), and a remaining group with very low estimated qi values.
The relative differences of the qi presumably represent multiple factors describing a complex system that is not fully understood. It is assumed that these factors account for differences in the survivability of the various Salmonella subtypes along the food chain, and potentially differences in their pathogenicity to humans. However, the method is sort of a “black box” model and the qi values do not translate into virulence of the specific subtypes. In addition, the qi factors do not describe the ability of specific Salmonella serotypes to cause severe disease or mortality. As an example, a previous study has estimated a higher mortality rate in patients infected with Salmonella Dublin when compared with other Salmonella serotypes (Helms et al., 2003). Still the presented model did not estimate Salmonella Dublin to have the highest qi , which may be inferred as Salmonella Dublin having a lower ability to survive the food chain when compared to other serotypes. Supporting such argumentation is the fact that this serovar is relatively frequently found in cattle in Denmark, and thus the human population could potentially be frequently exposed to this subtype through the consumption of beef, if the subtype was to persist well in the farm to table continuum. Nonetheless, the number of human cases caused by Salmonella Dublin is relatively low compared to other frequent serotypes, for example, Salmonella Enteritidis, Salmonella Typhimurium, and Salmonella Virchow. Another interpretation could be that Salmonella Dublin—being highly adapted to the bovine reservoir—seldom results in (reported) human disease, but when it does the outcome tends to be more severe.
The most significant differences in the results from the models utilizing different sets of discriminatory data were seen in the proportion of cases attributed to domestic broilers, to which the model using only serotype information attributed a higher number of cases, and on the contribution of table eggs, with variable differences in the 3 years. The vast majority of the isolates found in these sources are Salmonella Enteritidis and Salmonella Typhimurium, and thus it is inferred that the “serotype model” has less discriminatory power and is less accurate when attributing cases caused by these subtypes. However, the order of importance of the estimates for the subtype- and source- related factors is coherent in the two models.
We conclude that the presented three-dimensional model (i.e., subtype-, source, and time-dependent factors included) allows for the estimation of more informative posterior estimates than the previous model described by Hald et al. (2004). These estimates can be used to assist other risk assessment studies and risk management decisions. As an example, the results are currently used in an initiative by the Danish Veterinary and Food Administration to control Salmonella in Danish and imported meat. Batches of Danish and imported meat are continuously tested, and positive batches are risk assessed using a model applying the parameter values for subtypes and sources as estimated by the model presented here (
The model described here also allows for the utilization of less discriminatory data, for example, with only serotyping as an epidemiological marker method, which is often the only type of data available in many countries. The model described by Hald et al. has been adapted for Salmonella surveillance data from other European countries, but a successful adaptation was only possible for countries that had available phage typing data from animals and humans (Pires et al., 2008; Whalstrom et al., 2008). The approach represents a methodological improvement of a previously described model that makes its dissemination and wider utilization possible. We expect that the three-dimensional model will allow the attribution of human salmonellosis to specific sources in a wide variety of countries.
Disclosure Statement
No competing financial interests exist.
Footnotes
Appendix
| Travel history | ||||||||||||||
|---|---|---|---|---|---|---|---|---|---|---|---|---|---|---|
| Salmonella subtype | 2005 | 2006 | 2007 | |||||||||||
| Serotype | Phage type | AMR | No. of cases | Yes | No | Unknown | No. of cases | Yes | No | Unknown | No. of cases | Yes | No | Unknown |
| Enteritidis | PT 21 | 85 | 34 | 1 | 50 | 53 | 12 | 0 | 41 | 87 | 20 | 18 | 49 | |
| PT 4 | 90 | 22 | 5 | 63 | 88 | 11 | 0 | 77 | 65 | 18 | 13 | 34 | ||
| PT 6 | 21 | 3 | 0 | 18 | 34 | 5 | 0 | 29 | 11 | 3 | 1 | 7 | ||
| PT 6A | 16 | 2 | 0 | 14 | 12 | 5 | 0 | 7 | 16 | 7 | 2 | 7 | ||
| PT 8 | 180 | 16 | 23 | 141 | 121 | 12 | 4 | 105 | 148 | 16 | 39 | 93 | ||
| Others | 119 | 31 | 2 | 86 | 127 | 24 | 0 | 103 | 157 | 48 | 29 | 80 | ||
| Typhimurium | DT 104 | MR | 89 | 16 | 73 | 0 | 68 | 3 | 56 | 9 | 29 | 4 | 6 | 19 |
| DT 193 | MR | 2 | 0 | 1 | 1 | 4 | 1 | 0 | 3 | 7 | 2 | 1 | 4 | |
| NT | MR | 3 | 0 | 0 | 3 | 1 | 0 | 0 | 1 | 4 | 1 | 1 | 2 | |
| NT | MR | 9 | 1 | 2 | 6 | 9 | 0 | 1 | 8 | 6 | 1 | 2 | 3 | |
| DT 120 | R | 29 | 1 | 6 | 22 | 27 | 1 | 24 | 2 | 41 | 5 | 4 | 32 | |
| DT 120 | R | 2 | 0 | 0 | 2 | 25 | 1 | 0 | 24 | 2 | 0 | 0 | 2 | |
| DT 170 | R | 8 | 0 | 3 | 5 | 4 | 0 | 0 | 4 | 3 | 0 | 0 | 3 | |
| DT 193 | R | 29 | 0 | 25 | 4 | 12 | 0 | 0 | 12 | 6 | 2 | 0 | 4 | |
| NT | R | 20 | 0 | 6 | 9 | 10 | 0 | 0 | 10 | 13 | 1 | 5 | 7 | |
| NT | R | 1 | 0 | 0 | 1 | 4 | 1 | 0 | 3 | 7 | 1 | 3 | 3 | |
| NT | R | 2 | 0 | 1 | 1 | 3 | 0 | 0 | 3 | 4 | 1 | 1 | 2 | |
| DT 104 | S | 16 | 1 | 4 | 11 | 3 | 1 | 0 | 2 | 0 | 0 | 0 | 0 | |
| DT 12 | S | 60 | 0 | 36 | 24 | 18 | 0 | 16 | 2 | 18 | 2 | 7 | 9 | |
| DT 120 | S | 44 | 2 | 6 | 36 | 24 | 3 | 0 | 21 | 24 | 1 | 15 | 8 | |
| DT 17 | S | 6 | 0 | 2 | 4 | 1 | 0 | 0 | 1 | 1 | 0 | 0 | 1 | |
| DT 170 | S | 4 | 0 | 1 | 3 | 4 | 0 | 0 | 4 | 2 | 0 | 0 | 2 | |
| DT 40 | S | 5 | 0 | 2 | 3 | 7 | 0 | 0 | 7 | 13 | 0 | 5 | 8 | |
| DT 41 | S | 5 | 2 | 0 | 3 | 3 | 0 | 0 | 3 | 1 | 0 | 1 | 0 | |
| DT 66 | S | 4 | 0 | 2 | 2 | 1 | 0 | 0 | 1 | 4 | 0 | 1 | 3 | |
| DT 8 | S | 4 | 0 | 0 | 4 | 1 | 0 | 0 | 1 | 3 | 0 | 1 | 2 | |
| NT | S | 56 | 3 | 9 | 44 | 41 | 5 | 0 | 36 | 44 | 8 | 11 | 25 | |
| Others | MR | 17 | 3 | 6 | 8 | 17 | 1 | 2 | 14 | 8 | 3 | 2 | 3 | |
| Others | Q | 25 | 5 | 5 | 15 | 20 | 3 | 0 | 17 | 9 | 3 | 2 | 4 | |
| Others | R | 32 | 1 | 10 | 21 | 35 | 2 | 0 | 33 | 30 | 4 | 28 | 0 | |
| Others | S | 48 | 6 | 9 | 33 | 20 | 0 | 0 | 20 | 22 | 3 | 6 | 13 | |
| Others | 2 | 0 | 1 | 1 | 0 | 0 | 0 | 0 | 0 | 0 | 0 | 0 | ||
| Anatum | 11 | 0 | 0 | 11 | 11 | 0 | 0 | 11 | 6 | 0 | 0 | 6 | ||
| Blockley | 4 | 2 | 0 | 2 | 4 | 2 | 0 | 2 | 3 | 0 | 1 | 2 | ||
| Bovismorbificandis | 9 | 0 | 0 | 9 | 8 | 0 | 0 | 8 | 17 | 0 | 4 | 13 | ||
| Brandenburg | 2 | 0 | 0 | 2 | 2 | 0 | 0 | 2 | 3 | 1 | 0 | 2 | ||
| Bredeney | 4 | 0 | 0 | 4 | 3 | 1 | 0 | 2 | 1 | 1 | 0 | 0 | ||
| Derby | 11 | 0 | 1 | 10 | 6 | 1 | 0 | 5 | 6 | 1 | 0 | 5 | ||
| Dublin | 25 | 0 | 0 | 25 | 27 | 0 | 0 | 27 | 26 | 0 | 7 | 19 | ||
| Hadar | 23 | 6 | 1 | 16 | 19 | 1 | 0 | 18 | 5 | 2 | 0 | 3 | ||
| Heidelberg | 10 | 0 | 2 | 8 | 3 | 1 | 0 | 2 | 22 | 1 | 18 | 3 | ||
| Indiana | 12 | 0 | 1 | 11 | 2 | 0 | 0 | 2 | 2 | 0 | 1 | 1 | ||
| Infantis | 30 | 1 | 1 | 28 | 32 | 3 | 0 | 29 | 23 | 5 | 7 | 11 | ||
| Kentucky | 22 | 6 | 0 | 16 | 8 | 1 | 0 | 7 | 11 | 5 | 2 | 4 | ||
| Kottbus | 6 | 0 | 0 | 6 | 13 | 2 | 5 | 6 | 22 | 1 | 8 | 13 | ||
| Livingstone | 7 | 0 | 0 | 7 | 4 | 0 | 0 | 4 | 3 | 2 | 1 | 0 | ||
| Mbandaka | 2 | 1 | 0 | 1 | 1 | 0 | 0 | 1 | 7 | 1 | 0 | 6 | ||
| Newport | 38 | 10 | 5 | 23 | 57 | 5 | 5 | 47 | 25 | 6 | 6 | 13 | ||
| Ohio | 1 | 0 | 0 | 1 | 6 | 1 | 0 | 5 | 1 | 0 | 0 | 1 | ||
| Panama | 3 | 0 | 0 | 3 | 4 | 1 | 0 | 3 | 7 | 2 | 0 | 5 | ||
| Poona | 11 | 0 | 7 | 4 | 4 | 0 | 0 | 4 | 6 | 0 | 0 | 6 | ||
| Saintpaul | 11 | 1 | 1 | 9 | 16 | 0 | 0 | 16 | 16 | 4 | 3 | 9 | ||
| Schwarzengrun | 6 | 2 | 1 | 3 | 10 | 2 | 0 | 8 | 12 | 3 | 1 | 8 | ||
| Senftenberg | 5 | 1 | 1 | 3 | 1 | 0 | 0 | 1 | 14 | 2 | 5 | 7 | ||
| Tennessee | 3 | 0 | 0 | 3 | 1 | 0 | 0 | 1 | 3 | 0 | 0 | 3 | ||
| Thompson | 5 | 0 | 0 | 5 | 10 | 0 | 0 | 10 | 13 | 0 | 3 | 10 | ||
| Virchow | 35 | 3 | 3 | 29 | 33 | 9 | 0 | 24 | 42 | 15 | 3 | 24 | ||
| Others | 428 | 79 | 28 | 321 | 552 | 49 | 10 | 422 | 514 | 120 | 102 | 292 | ||
| Agona | 18 | 2 | 1 | 15 | 24 | 3 | 0 | 21 | 52 | 4 | 7 | 41 | ||