
Abstract
Cattle are fed elevated concentrations of copper and zinc for growth promotion. The potential mechanisms of growth promotional effects of these elements are attributed to their antimicrobial activities, similar to that of antibiotics, in that gut microbial flora are altered to reduce fermentation loss of nutrients and to suppress gut pathogens. Copper and zinc fed at elevated concentrations may select for bacteria that are resistant not only to heavy metals but also to antibiotics. Our objectives were to determine the effects of feeding elevated copper and zinc on the antimicrobial susceptibilities of fecal bacteria in feedlot cattle. Twenty heifers, fed corn-based high-grain diets, were randomly assigned to treatments in a 2 × 2 factorial arrangement with 1X or 10X National Research Council recommended copper and/or zinc. Feces, collected on days 0, 14, and 32, were cultured for commensal bacteria (Escherichia coli and Enterococcus) to determine their susceptibilities to copper, zinc, and antibiotics. Fecal DNA was extracted to detect tcrB gene and quantify erm(B) and tet(M) genes. In E. coli and Enterococcus sp., minimal differences in minimum inhibitory concentrations (MICs) of copper, zinc, and antibiotics were noticed. The mean copper MIC for E. coli increased (p < 0.05) between days 0 and 32 and days 14 and 32. The only treatment effect detected was increased zinc MIC of E. coli isolates (p < 0.01). The tcrB gene was not detected in feces or in enterococcal isolates. Proportions of erm(B) and tet(M) were unaffected by copper or zinc supplementation. However, the proportion of tet(M) increased (p < 0.05) between days 0 and 14. Feeding elevated copper and/or zinc to feedlot cattle had marginal effects on antimicrobial susceptibilities of fecal E. coli and enterococci.
Introduction
Materials and Methods
Study design and sampling schedule
Twenty crossbred heifers (body weight = 486 ± 79 kg) were randomly allocated to four treatments (five animals per treatment) and housed in individual concrete pens with a water fountain shared between adjacent pens. All animals within a treatment were penned next to each other, with an empty pen between treatments to limit potential cross-contamination. Cattle were fed a standard steam-flaked corn-based high-grain diet (83%) with 6% alfalfa hay and without in-feed antimicrobials for the previous 3 months, except monensin, which was withheld for the previous 2 weeks. The four treatments of the study were 1X National Research Council (NRC) (NRC, 1996) recommended copper (10 mg/kg diet) + 1X zinc (30 mg/kg diet), 10X copper (100 mg/kg diet) + 1X zinc (30 mg/kg diet), 1X copper (10 mg/kg diet) + 10X zinc (300 mg/kg diet), or 10X copper (100 mg/kg diet) + 10X zinc (300 mg/kg diet). Approximately 20 g of feces were collected from the rectum of each animal on days 0, 14, and 32 of the feeding period.
Bacteriological procedures
The presence of Escherichia coli and Enterococcus species was determined in each fecal sample. Unless otherwise indicated, all media were Difco brand (Fisher Scientific, St. Louis, MO). The procedure outlined by Barkocy-Gallagher et al. (2002) was used to isolate E. coli from fecal samples. A lactose-fermenting colony was picked from MacConkey agar and streaked onto a blood agar plate (Remel, Lenexa, KS), grown overnight at 37°C, and tested for indole production and citrate utilization. Enterococcus species were isolated by diluting 1 g of fecal sample in 10 mL of phosphate-buffered saline and plating 50 μL of the suspension onto M-Enterococcus agar. After 24 h growth at 37°C, up to two (pin-point and metallic pink) colonies that were morphologically different were picked and replated on blood agar plate for overnight incubation at 37°C. For confirmation of genus, isolates were inoculated in 100 μL Enterococcosel broth and incubated at 37°C for 4 h to test for esculin hydrolysis, followed by analysis using the 20 Strep API kit (bioMérieux, Marcy-l'Etoile, France). If the two colonies picked from M-Enterococcus agar had identical API biochemical profiles, then only one isolate was used for further analyses. All bacterial isolates were frozen in protect beads (Cryo-Vac®; Key Scientific, Round Rock, TX) at −80°C for further use.
Antibiotic susceptibility determination
Microbroth dilution method was used to determine minimum inhibitory concentrations (MICs, μg/mL) of selected antibiotics for E. coli and Enterococcus species isolates. Reported susceptibility results were based on interpretations provided by the automated reader program (Sensititre®; Trek Diagnostic Systems, Cleveland, OH). E. coli were tested for susceptibility to the BOPO-IF panel (Sensititre). Enterococcus isolates were evaluated for susceptibility using the Gram-positive National Antimicrobial Resistance Monitoring System panel (CMV1AGPF; Sensititre). Appropriate ATCC quality control strains (Enterococcus faecalis ATCC 29212, E. coli ATCC 25922, E. coli ATCC 35218, Pseudomonas aeruginosa ATCC 27853, and Staphylococcus aureus ATCC 29213) and standards were included in susceptibility testing.
Susceptibility determinations for copper and zinc
MICs of copper or zinc were determined with copper sulfate or zinc sulfate for E. coli and Enterococcus isolates using the agar dilution method (Hasman and Aarestrup, 2002). Briefly, brain heart infusion plates containing 0, 2, 4, 8, 12, 16, 20, 24, 28, 32, 36, and 40 mM of copper sulfate (CuSO4 · 5H2O, pH = 7) or zinc sulfate (ZnSO4 · 7H2O, pH = 7) were prepared and inoculated with 20 μL of bacterial growth adjusted to standard concentration (McFarland = 0.5). Plates were incubated for 24 h at 37°C and growth of each isolate was recorded. The MIC value was defined as the lowest concentration of copper sulfate or zinc sulfate inhibiting visible growth. The copper-resistant E. faecium strain A17sv1 and E. coli strains 77-30008-6 and pRJT004 (provided by H. Hasman, Technical University of Denmark, National Food Institute) were used as positive controls.
Quantification of erm(B) and tet(M) genes in the feces
Detailed descriptions of procedures have been previously published (Jacob et al., 2008). Briefly, two targets, erm(B) and 16S rRNA (EUB) genes, were amplified from a strain of E. faecalis MMH594 (Dr. L. Zurek, Kansas State University), and recovered fragments were cloned into a commercial vector (pCRII-TOPO; Invitrogen, Carlsbad, CA), followed by transformation in One Shot Top10 E. coli cells (Invitrogen). The tet(M) gene was amplified from an E. coli isolate (Dr. L. Zurek) containing pFD310 carrying tetracycline, erythromycin, and ampicillin resistance (Smith et al., 1992). Cloning and real-time polymerase chain reaction (PCR) procedures utilized the same primers (Table 1), with one exception. Originally, primers for erm(B) (404 bp) were modified from Jost et al. (2004) for cloning procedures. To accurately determine the concentration of a gene using real-time PCR, a smaller PCR product (<200 bp) was desired. A new primer was designed to target erm(B) (175 bp) (Jacob et al., 2008). The PCR running conditions for all targets [erm(B), tet(M), and EUB] were 3 min of initial denaturation at 94°C; 36 cycles of 30 sec at 94°C, 30 sec at annealing temperatures (Table 1), 30 sec at 72°C; and 2 min final extension at 72°C with Taq DNA polymerase (Promega, Madison, WI). Amplification protocols for real-time reactions were identical for each target, but utilized the Absolute QPCR SYBR Green Mix (ABgene, Epsom, UK), which required the addition of a 15 min, 95°C initial activation. Serial 10-fold dilutions of purified plasmid were prepared. A 25 μL reaction volume utilizing Absolute QPCR SYBR Green Mix containing 5 μL of serially diluted plasmids were used to standardize each real-time PCR assay.
Extraction of DNA and real-time PCR of fecal samples
Fecal samples (180–220 mg) from days 0, 14, and 32 (previously frozen at −80°C) were thawed on ice and DNA was extracted using the QIAamp DNA stool mini kit according to manufacturer's instructions (Qiagen, Valencia, CA). Antimicrobial resistance genes, erm(B) and tet(M), and conserved 16S rRNA gene (EUB) sequence were used as targets in real-time PCR. A melting curve was created at 0.5°C increments to determine if the right product was amplified during each run. In addition, PCR products from randomly selected samples were electrophoresed and sequenced to confirm the correctness of the targets amplified. The copy numbers of the targeted genes in the samples were calculated using the standardization curves.
Detection of tcrB in the feces and Enterococcus isolates
Extracted fecal sample DNA and Enterococcus isolates were screened by PCR for the tcrB gene. Enterococcus isolates were boiled in sterile water for 20 min prior to PCR. The primers used (Table 1) were designed previously (Hasman et al., 2006b). The running conditions were 5 min of initial denaturation at 94°C; 30 cycles of 30 sec at 94°C, 30 sec at 55°C, 1 min at 72°C; and 10 min final extension at 72°C. E. faecium strain A17sv1 (provided by Dr. Henrik Hasman, Denmark) was included as a positive control.
Statistical analysis
The nonparametric LIFETEST procedure in SAS (Version 9.1; SAS Institute, Cary, NC) was used to find differences in antibiotic, copper, and zinc MIC values with treatment and sampling day effects for E. coli and Enterococcus isolates. Treatment × day interactions could not be evaluated with this test, which was chosen a priori to account for possible right-censored data (i.e., maximum concentration available in commercial microbroth dilution panels). The log-rank test was used to determine significance. If treatment or sampling day effects (p < 0.10) were observed, two-way comparisons were used to evaluate specific mean MIC differences. Finally, the MIXED SAS procedure was used to evaluate differences in the mean proportion of real-time PCR products. The proportion was the log concentration of antimicrobial resistance genes [erm(B) or tet(M)] to the log concentration of 16S rRNA gene product (EUB) in each fecal sample. Copper or zinc treatment, sampling day, and the treatment × day interaction were included as effects on the concentration of real-time PCR products.
Results
Possibly because of incorrect data entry of feed intake, cattle fed 10X NRC recommended copper and 1X NRC recommended zinc were inadvertently fed a diet with a lower concentration of copper (3X NRC) beginning on day 23 of the feeding period. The impact of feeding altered diet may include preventing some copper resistance events; however, copper was still at elevated (3X) concentrations in the diet. In addition, two of the three sample collections (days 0 and 14) had occurred prior to the inadvertent switch. Bacteria isolated in this study included 60 E. coli and 69 Enterococcus isolates (59 E. durans, 9 E. faecium, and 1 E. faecalis).
Antibiotic susceptibility
E. coli isolates were resistant to clindamycin, erythromycin, penicillin, tiamulin, tilmicosin, and tylosin. Copper or zinc supplementation did not impact MIC differences for E. coli isolates, but there was an effect of sampling day. Tilmicosin MIC values increased between days 0 and 14 (p = 0.03) and days 0 and 32 (p = 0.04), but were not different between days 14 and 32 (p = 0.94). As previously mentioned, however, all isolates still were classified as resistant by Clinical and Laboratory Standards Institute (CLSI) interpretations. The CLSI classifications for E. coli isolates toward other antibiotics were mostly susceptible or intermediate.
Enterococcus isolates were classified as susceptible or intermediate to chloramphenicol, ciprofloxacin, gentamicin, linezolid, penicillin, streptomycin, and vancomycin. There were no effects of copper or zinc supplementation on MIC values, but effects of sampling day were observed. The mean chloramphenicol MIC for Enterococcus isolates was greater from samples collected on day 32 than on day 14 (p = 0.03). The differences in MIC between days 0 and 32 and days 0 and 14 were not different (p > 0.1). Penicillin MIC values also differed between sampling days. The mean MIC of penicillin was lower on day 0 compared with day 14 (p = 0.05) and day 32 (p < 0.01). The MIC differences between isolates from days 14 to 32 were not different (p > 0.4). These isolates were not classified as resistant to these antibiotics by CLSI interpretations.
Copper and zinc susceptibilities
The copper and zinc MICs of E. coli isolates were affected by treatment and sampling day. Treatment was associated with zinc MIC (p < 0.01). Specifically, cattle diets containing 10X copper + 1X zinc were associated with a lower E. coli zinc MIC than either 1X copper + 1X zinc (p = 0.02) or 10X copper + 10X zinc (p = 0.02) treatments. The mean MIC values of E. coli isolates from both 1X copper + 1X zinc and 10X copper + 10X zinc treatments were identical. In addition, sampling day had an effect on the copper MIC values of E. coli isolates (Fig. 1). The mean copper MIC was higher in isolates from day 32 than from days 0 (p < 0.01) or 14 (p = 0.02). No other effects were seen on copper or zinc MIC of E. coli isolates. Copper and/or zinc concentration did not impact the MIC of these metals for Enterococcus isolates. There was a sampling day effect on the zinc MIC in these isolates. The mean zinc MIC was higher in isolates from day 0 than on day 32 (p = 0.01) samples. The copper MICs of Enterococcus isolates were not affected by sampling day (p > 0.5).
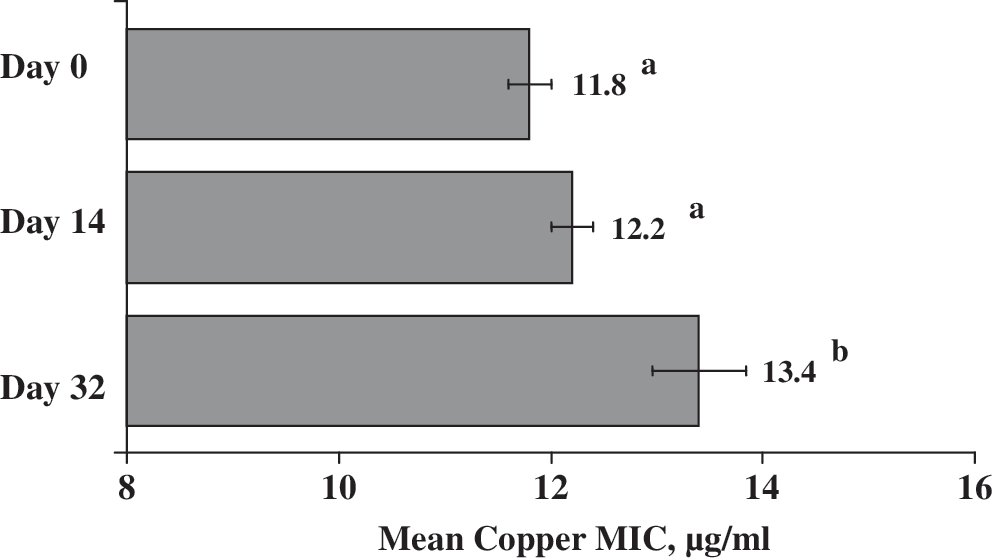
Copper minimum inhibitory concentration (MIC) and standard errors of Escherichia coli isolates (n = 60) collected on different sampling days from cattle fed elevated concentrations of supplemental copper and zinc (all treatments). Means with different superscript alphabets indicate statistical significance (p < 0.05).
Real-time PCR
A total of 31 of 60 fecal samples were positive for erm(B). The proportions of erm(B) gene to 16S rRNA genes were not different between treatments or between sampling days (p > 0.05). Fifty-three of 60 fecal samples were positive for the tet(M) gene but the proportion had no treatment effect (p > 0.05). A sampling day effect (p < 0.05) was observed for tet(M) (Fig. 2). The proportion of tet(M) was higher (p < 0.01) in feces collected on day 14 compared with day 0. Day 32 samples were not different in the proportion of tet(M) when compared with sampling days 0 or 14.
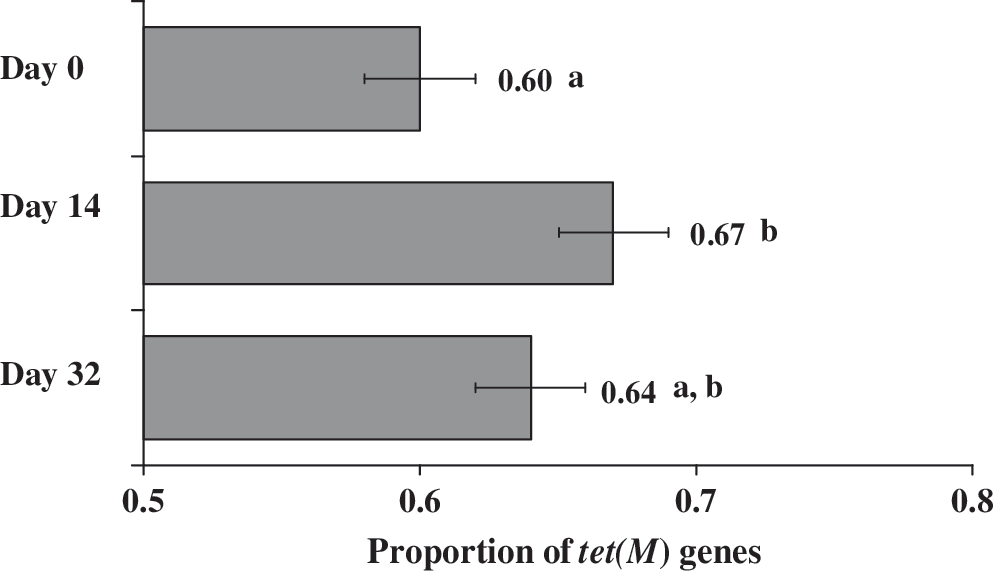
Mean proportion and standard error of real-time polymerase chain reaction amplified tet(M) to 16S rRNA (EUB) genes in feces collected on different sampling days in cattle fed elevated concentrations of supplemental copper and zinc (all treatments). Means with different superscript alphabets indicate statistical significance (p < 0.05).
tcrB gene in feces and Enterococcus isolates
None of the samples (fecal DNA or Enterococcus isolates) were positive for the tcrB gene. The control strain (E. faecium strain A17sv) was positive for the tcrB gene (data not shown).
Discussion
Copper and zinc are essential micronutrients for both eukaryotic and prokaryotic cells (NRC, 1996). In cattle, these metals are added to diets at concentrations above those physiologically required by the animal because of growth promoting effects, similar to those of some conventional antimicrobials (Hasman et al., 2006a). The mechanism for increased efficiency of cattle growth with antimicrobial use is multifaceted; some antimicrobials alter normal microbial populations or metabolic processes, others suppress diseases, while other mechanisms are unknown (Gustafson and Bowen, 1997; Barton, 2000; HojBerg et al., 2005).
Because copper is extremely reactive, it is toxic to cells at high concentrations. Therefore, cells have developed mechanisms to maintain an optimum concentration of intracellular copper. Copper homeostasis in most cells is mediated by a group of membrane-spanning proteins called CPx-type ATPases, which are encoded by genes located on the chromosome (Lu and Solioz, 2002). The copper homeostatic mechanism under the control of cop operon has been well studied in Enterococcus hirae (Lu and Solioz, 2002). The cop operon, consisting of four genes, codes for a repressor, a chaperone, and two CPx-type ATPases, which allow E. hirae growth in up to 8 mM of copper (Solioz and Stoyanov, 2003). A previous study reported the presence of additional acquired copper resistance determinants in E. faecium from different food animals (Aarestrup and Hasman, 2004), including pigs, broilers, and calves (Hasman et al., 2006b). The tcrB gene, which renders E. faecium more resistant to copper (above 8 mM), is part of an operon similar to the cop operon of E. hirae (Hasman, 2005). In swine enterococcal isolates, the tcrB gene has been shown to be located on a plasmid also carrying genes erm(B) and vanA, which encode resistance to macrolides and glycopeptides, respectively, suggesting a potential linkage of copper resistance to antibiotic resistance (Hasman and Aarestrup, 2002). Zinc is an important regulator of the cop operon in E. hirae (Solioz and Stoyanov, 2003); however, the potential role of zinc in acquired copper resistance is not known.
Feeding cattle elevated concentrations of copper, zinc, or both did not have an effect on the antibiotic MIC of fecal E. coli or Enterococcus isolates. Resistance to antibiotics, specifically macrolides, was expected in Enterococcus isolates fed higher levels of copper because resistance genes for both copper (tcrB) and macrolides [erm(B)] have previously been found together (Hasman and Aarestrup, 2002). The mean MIC of macrolide antibiotics remained unchanged in Enterococcus species. Although there were no associations between copper and zinc supplementations and antibiotic susceptibility, sampling day effects were seen for tilmicosin in E. coli isolates and for chloramphenicol and penicillin in Enterococcus isolates. In all cases, the mean MIC value increased across at least one sampling time interval. This may suggest that some selective pressure was present for these antibiotics; however, because treatment was not significant it was likely not because of copper or zinc supplementation.
In addition to antibiotic susceptibility, the MICs for copper and zinc sulfate were used to assess resistance toward these metals. Interestingly, the mean copper MIC of E. coli isolates increased over the course of the study. There was no effect of copper or zinc treatment on E. coli susceptibility to copper but there was an effect on zinc MIC. The mean MIC did not change between cattle fed 1X copper + 1X zinc and 10X copper + 10X zinc. Consistent copper MIC values for Enterococcus isolates were obtained for all treatment groups and across collection days. The MIC values of Enterococcus isolates were reasonable to account for a normal copper homeostatic mechanism (i.e., ≤ 8 mM) and not additional resistance genes (Solioz and Stoyanov, 2003). In addition, higher copper MIC values were obtained for the positive control isolates (12 and 16 mM for Enterococcus and E. coli, respectively), indicating that there was not a problem with the MIC determination method. Absence of tcrB gene in any fecal sample or Enterococcus isolate supports the MIC data indicating a lack of copper resistance. Previously, tcrB gene has been reported in E. faecium isolates (Hasman and Aarestrup, 2002). Among the enterococci we isolated from cattle feces, only one isolate was E. faecium. Hasman and Aarestrup (2002) have reported that only 16% of E. faecium isolates from healthy cattle contained tcrB gene. The MIC of zinc for Enterococcus isolates was significantly different between sampling days, with the MIC decreasing as the study progressed. It is important to note that differences in antimicrobial or copper and zinc sulfate MIC values were not assessed at species level. It is possible that species behave differently, but because of lack of statistical power, we chose to analyze all Enterococcus isolates together.
Two gene targets, erm(B) and tet(M), were chosen for real-time PCR on fecal samples because of their potential proximity to tcrB gene on a horizontally transferable plasmid (Hasman and Aarestrup, 2002). No treatment effects were seen for either the erm(B) or tet(M) gene, which was consistent with antibiotic susceptibility results. Sampling day had a significant effect on the proportion of tet(M). Initially, the proportion of tet(M) gene increased, which may indicate some selective pressure. The same effect was not evident in the tetracycline antibiotic susceptibilities of bacterial isolates. This may be a result of tet(M) gene being present in bacterial species other than those isolated in our study. No significant difference seen in the proportion of these elements between treatments is further justification that elevated copper and/or elevated zinc concentrations in cattle diets have little effect on acquired copper or antimicrobial resistance.
A previous study has reported that 175 ppm copper sulfate in the feed, equal to 2.8 mM Cu, would be enough to induce copper resistance in pigs (Hasman, 2005). The author acknowledged that factors including pH, formation of copper complexes, and feed breakdown in the intestine may influence in situ copper concentration. The maximum concentration of copper suggested to avoid toxic effects in beef cattle is 100 mg/kg diet (NRC, 1996). Given the lower concentration of copper fed to cattle in this study compared with the concentration of copper fed to pigs in previous studies, and the more complex gastrointestinal environment in cattle compared with pigs, it is possible that the levels of copper may not have been sufficient to induce acquired copper resistance in gut bacteria. Finding no difference in the mean copper MIC between treatments in this study, along with finding little evidence of additional acquired antibiotic resistance and no tcrB gene, seems to support this hypothesis, although low statistical power may have decreased the ability to detect differences. In addition, we only selected one E. coli and Enterococcus isolate from each fecal sample at each sampling time. The study could have been enhanced with an increased number of isolates from each animal, because one isolate may not accurately reflect the population in the gut. In summary, copper or zinc treatment did not significantly change the antibiotic susceptibility profiles of bacteria, change the susceptibility of fecal bacteria to copper (although E. coli zinc MIC was changed), or increase the concentration of a macrolide resistance gene previously linked to copper resistance in feedlot cattle.
Footnotes
Acknowledgments
Financial support for this project was provided by the Kansas Agricultural Experiment Station under 1433 Animal Health Funds. The authors thank Elita Balridge, Nathan Hoffman, Ashvin Nagaraja, Matt Quinn, Heath Ritter, Xiaorong Shi, Neil Wallace, and Audrey Webb from the KSU Beef Cattle Research Center and the College of Veterinary Medicine Preharvest Food Safety Lab.
Disclosure Statement
No competing financial interests exist.
This article was published as contribution no. 08-45-J from Kansas Agricultural Experiment Station.