
Abstract
The mycological profile of the retail wheat flour selling in different markets at Jeddah (Kingdom of Saudi Arabia) was studied. The most common genera were Aspergillus (isolated from 70% of the tested samples), Penicillium (30%), Eurotium (14%), and in a lesser extent Fusarium (20%) and Alternaria (18%). Twenty-nine strains of Aspergillus flavus were screened for their ability to produce aflatoxins (AFs). Four strains produced only aflatoxin B1 (AFB1), two strains produced AFB1 and aflatoxin B2, and one strain produced AFB1, aflatoxin G1, and aflatoxin G2. Random amplified polymorphic DNA-polymerase chain reaction technique could not differentiate between toxigenic and nontoxigenic strains of A. flavus. AF regulatory gene was detected in three flour samples and in seven A. flavus isolates.
Introduction
Aflatoxins (AFs) are toxic secondary metabolites produced by species of Aspergilli, especially Aspergillus flavus, A. flavus var. columnaris, Aspergillus oryzae, Aspergillus parasiticus, and Aspergillus zonatus. These fungi can grow on certain foods and feeds under favorable conditions of temperature and humidity and generate AFs before and/or during harvest, handling, shipment, and storage (Bushby and Wogan, 1979, 1984; Peraica et al., 1999; Frisvad and Thrane, 2004). The four major naturally occurring AFs are known as aflatoxin B1 (AFB1), aflatoxin B2 (AFB2), aflatoxin G1 (AFG1), and aflatoxin G2 (AFG2). AFs have been shown to be potent carcinogens, mutagens, and teratogens (Hendrickse, 1997; Peraica et al., 1999; Kotsonis et al., 2001). The occurrence of AFs in food has been recognized as a potential threat to human health, either caused by direct contamination via grains and grain products or by “carry over” of mycotoxins and their metabolites in animal tissues, milk, and meat after intake of contaminated feedstuffs (Bushby and Wogan, 1984; Kotsonis et al., 2001). There exist a great number of reports that suggest intoxication of humans by the consumption of AF-contaminated agricultural products (Krishuamachari et al., 1975; Hendrickse et al., 1982; Ngindu et al., 1982; Williams et al., 2004). Epidemiological studies have shown that AF exposure is associated with increased risk of hepatocellular carcinoma, particularly in combination with hepatitis B virus (IARC, 1993, 2002). The potency of AFs appears to be significantly enhanced in individuals with hepatitis B infection (Hermann and Walker, 1999). Additionally, food contamination by AFs causes serious economic losses. Because of their frequent occurrence and severe toxicity, guidelines and tolerance levels of AFs have been set in several countries.
Polymerase chain reaction (PCR) has great utility in fungal phylogenetics, where determining the DNA structure holds the promise of attaining “true” evolutionary relationships. However, the DNA sequences do not mean a great deal in isolation and need to be linked to some other relevant attribute(s) (Wheeler, 2004). The random amplified polymorphic DNA (RAPD) fingerprinting assay detects small inverted nucleotide sequence repeats through genomic DNA (Welsh and McClelland, 1990; Williams et al., 1990). This technique was used previously by our group in the field of molecular characterization and genotypic identification of several microorganisms (Gherbawy, 1999, 2001, 2004; Gherbawy and Abdelzaher, 2002; Gherbawy and Farghaly, 2002; Gherbawy et al., 2002, 2004, 2005, 2006; Gherbawy and Yaser, 2003). The use of PCR to identify mycotoxin fungi is attracting considerable attention (Marek et al., 2003; Mayer et al., 2003; Haughland et al., 2004; Gherbawy, 2008; Gil-Serna et al., 2009; Sampietro et al., 2009; Gallo et al., 2010; Meng et al., 2010). These methods are based on genes separate from mycotoxin biosynthesis. However, there are only a few mycotoxins about which the biochemistry has been determined sufficiently to enable the development of gene probes of the pathway (Edwards et al., 2002). Several genes and enzymes involved in AF biosynthesis have been identified, cloned, and purified; they include a regulatory gene locus aflR from A. flavus and A. parasiticus (Chang et al., 1993; Payne et al., 1993; Bennett et al., 1994; Somashekar et al., 2004). The aflR product is known to regulate the structural genes positively at the level of transcription (Woloshuk and Prieto, 1998).
Wheat flours may carry a significant mycological load acquired via cultivation, postharvest processing practices, and milling process. Their use in bread production and other food industries could cause accelerated spoilage or illness, if pathogens are present. So, this work aimed (1) to determine the occurrence and load of fungi in wheat flour offered for sale to consumers in the retail stores at Jeddah region in Saudi Arabia; (2) to analyze specifically the occurrence of A. flavus group in these samples; (3) to investigate the occurrence of AFs, a public health concern, using chromatography and molecular techniques; and (4) to test more reliable methods for direct detection of AFs in flour samples.
Materials and Methods
Samples
A total of 50 white wheat flours were collected from local supermarkets and examined. Samples included representative brands consumed in Saudi Arabia. The flour samples in Saudi markets were mainly produced from Saudi wheat. The samples were stored at 4°C and analyzed the day after collection.
Mycobiota determination
Enumeration of fungal propagules was done on solid media using both dilution and direct plating techniques. Serial dilution in saline was made and 1 mL aliquots were inoculated onto plates of malt extract agar (MEA) supplemented with 100 ppm of chloramphenicol and 50 ppm of streptomycin and of dichloran rose bengal chloramphenicol agar (DRBC) (Pitt and Hocking, 1997). Samples were inoculated on the same culture media by sprinkling directly 25 mg of wheat flour over the surface of the plates. MEA and DRBC plates were incubated at 25°C for 7 days. Plates with 10–100 colony-forming units (cfu) were used for counting and the results were expressed as cfu per gram of sample (cfu/g). From MEA and DRBC plates, only colonies belonging to A. flavus were transferred to slants to ensure precise counting and for identification to species level (Klich and Pitt, 1988). These isolates were preserved at −80°C for later studies.
AF detection
Determination of AF production (thin layer chromatography [TLC])
For the determination of AF production by A. flavus strains, the method of Mayer et al. (2003) was used. The strains were grown at 30°C on MEA plates or in broth for 3–5 days. One colony of each strain or the appropriate amount of the fungal biomass was transferred into a microreaction tube and 500 μL of chloroform was added. The fungal mycelia were extracted for 20 min at room temperature, the mycelia retarded, and the chloroform extract was evaporated to dryness in a speed vac concentrator. The residue was redissolved in 10 μL of chloroform and applied onto a TLC plate. As mobile phase, toluol (50 volumes), ethylacetate (30 volumes), and acetic acid (4 volumes) were used. Standard AF mixture (containing AFB1 and AFG1 at 0.5 μg/mL each and AFB2 and AFG2 at 0.15 μg/mL each, respectively) was used for comparison. The spots were visualized under ultraviolet light (366 nm). AFB1 and AFB2 fluoresce bright blue and AFG1 and AFG2 fluoresce green under long-wave ultraviolet light (Gimeno, 1979; AOAC, 1980).
Detection of natural occurrence of AFs
Twenty-five grams of each flour sample was defatted by extraction with normal hexane for 10 h using Soxhlet-type extractor. The defatted residue was reextracted for another 10 h with chloroform. The chloroform extract was dried over anhydrous sodium sulfate, filtered, and evaporated under vacuum to near dryness. The residue was diluted with chloroform to 1 mL. The chloroform extracts were analyzed on precoated silica gel plate type 60F 254 (Merck) along with standard AF mixture. The plates were developed in chloroform/acetone (9:1, v/v) in glass tanks covered with aluminum foil. After development, the plates were dried and observed under short and long wavelength (254 and 365 nm). Detection limit was 0.25 μg/kg for all the AFs (Bankole et al., 1996; Gnonlonfin et al., 2008).
Toxicity bioassay
The toxicity of A. flavus strains and flour samples were compared by bioassay against Artemia salina (Biji et al., 1981). Chloroform extract (0.05 mL) of A. flavus strains and flour samples were placed in each test tube, the chloroform was evaporated, and about 10–20 shrimp larvae in 1 mL salt water were transferred into tubes. The tubes were kept at room temperature (22°C–24°C). Control tubes with 0.05 mL of chloroform was also made. After 24 h, mortality was determined.
RAPD characterization of A. flavus strains
The isolates phenotypically identified as A. flavus were characterized by RAPD to study the relationship between toxin production and DNA fingerprinting patterns. Fungal DNA was extracted as described by Accensi et al. (1999). The strains were inoculated in 1.5-mL Eppendorf tubes containing 500 μL of Sabouraud broth (2% glucose, w/v; 1% peptone, w/v) supplemented with chloramphenicol (1 mg/L) and incubated in an orbital shaker at 25°C and 300 rpm for 36–48 h. Mycelium was recovered after centrifugation, washed with 0.9% (w/v) NaCl, frozen in liquid nitrogen, and ground to a fine powder with a pipette tip. The powder was kept for 1 h at 65°C in 500 μL extraction buffer (50 mM Tris-HCl, 50 mM ethylenediaminetetraacetic acid, 3% sodium dodecyl sulfate, and 1% 2-mercaptoethanol). The lysate was extracted with phenol:chloroform:isoamyl alcohol (49.5:49.5:1), 3 M NaOAc, and 1 M NaCl. DNA was recovered by isopropanol precipitation. The pellet was washed with 70% (v/v) ethanol, dried under vacuum, and resuspended in TE buffer. The RAPD analysis was carried out as described by Castellá et al. (2002). The isolated chromosomal DNA was used as template DNA for the RAPD-PCR. The PCR mixture was performed in a total volume of 25 μL containing 0.1–10 ng of DNA, 0.55 μM of primer ari1 (5′-TGCTTGGCACAGTTGGCTTC-3′) (Castellá et al., 2002) or M13 (5′-dGAGGGTGGCGGTTCT-3′) (Meyer et al., 1993), 0.1 mM dNTPs, and 1 U of Taq (Qiagen) DNA polymerase in the buffer. The reactions were conducted in a thermal cycler, which was set to the following conditions: 5 min at 95°C; 44 cycles consisting of 1 min at 95°C, 1 min at 36°C, and 4 min at 72°C; and a final amplification period of 7 min at 72°C. The amplified products were separated on a 2% agarose gel and the band patterns were analyzed.
Isolation of fungal DNA directly from flour samples
The method of Manonmani et al. (2005) was adapted. Whereas, appropriate dilutions were made, known amounts were inoculated into potato dextrose broth (PDB) and incubated at 30°C for 24 h, and DNA from the fungal biomass was extracted as earlier. Spores of A. flavus (reference strain) were spiked into flour as a positive control and DNA was isolated.
AF regulatory gene amplification
PCR was used to amplify the AF regulatory gene fragments of aflatoxigenic fungal genomic DNA according to Manonmani et al. (2005). The PCR products were analyzed by electrophoresis on a 1.2% agarose gel in TAE buffer (50 mM Tris–acetate, 1 mM ethylenediaminetetraacetic acid, pH 8.0) stained in 1 mg/mL ethidium bromide.
Computer-assisted analysis with the TREECON for Windows v.1.3b
The results went through the computer-assisted analysis and the produced matrices were analyzed by TREECON for Windows (version 1.3b, 1998) whereof evolutionary trees—dendrograms—were constructed and produced (Van de Peer and de Wachter, 1994).
Results and Discussion
Microorganism propagules get on grain in different ways, most often with dust from soil, from the surface of plant remnants during harvesting, transportation, storage, and processing (Klich, 2002). Mold spores present in flour survive for several years, and therefore, care should be taken in the storage of flour (Christensen and Cohen, 1950). Table 1 shows the mean values of total fungal counts and the Aspergillus spp. counts in MEA and DRBC culture media with the two plating techniques. Mean total fungal counts and Aspergillus spp. counts obtained with the direct plating technique were higher than the mean values obtained with the dilution plating technique. These results are in agreement with the results reported by Cabanas et al. (2008) in their work on wheat flour from Spanish markets. Dilution plating is the technique recommended for fungal enumeration in flours and direct plating is considered to be the more effective technique for mycological examination of particulate foods such as grains or nuts and flour samples (ICFM, 2006; Cabanas et al., 2008). Cabanas et al. (2008) reported that the total mold counts obtained from wheat flour samples in Spain (<10 to 1.6 × 10³ cfu/g) are similar to those reported by other authors. In wheat flours, the fungal counts reported from various countries varied about 102 to 6 × 10³ cfu/g (Weidenbörner et al., 2000; Berghofer et al., 2003). In Malaysia, total fungal count in wheat flour samples ranged from 102 cfu/g sample to slightly more than 104 cfu/g sample (Abdullah et al., 1998). In Spain, the maximum mold count limit for wheat flour for human consumption is 1 × 10⁴ cfu/g (Real Decreto 1286/1984). Recently, in the quality guidelines proposed for Australian flour the acceptable quality limit for yeasts and molds was <103 cfu/g (Berghofer et al., 2003). In Germany, 51 species belonging to 14 different genera were isolated from whole wheat flour and white wheat flour, and total fungal counts of the whole wheat flour amounted to 1833 molds, and the white wheat four contained 1730 cfu 2 g−1 (Weidenbörner et al., 2000). In Algeria, total fungal count in wheat flour samples was 275 cfu/g−1 (Riba et al., 2008).
Cfu, colony-forming unit; MEA, malt extract agar; DRBC, dichloran rose bengal chloramphenicol agar.
Predominant mycobiota of flour samples, taking into account their occurrences and abundance, respectively, belonged to Aspergillus spp. (70% and 31.0%), Penicillium spp. (30% and 16.1%), Eurotium (14% and 15.1%), and in a lesser extent Fusarium oxysporum (20% and 10.4%) and Alternaria alternata (18% and 8.9%). Abundance was expressed as the average of percentage counts of a genus in the total samples. The remaining genera, including yeasts, had a global abundance of lesser than 8%. Bragulat et al. (1995) have shown that feedstuffs have Aspergillus species as the predominant fungi. High frequencies of Fusarium and Aspergillus species in barley grains were reported by Baliukoniene et al. (2003) and Cavaglieri et al. (2009). Other authors found Alternaria as the predominant genus in barley (Sanchis et al., 1993), and Alternaria and Fusarium genera in malt samples (Andersen et al., 1996). Aspergillus and Penicillium have been recorded among the most prevalent in flours by many authors. Megalla et al. (1985) studied the fungal flora of wheat flour and baladi bread in upper Egypt. They reported that most of the isolated fungal species belonged to the genus Aspergillus. Aspergillus was the genus most detected at high frequency in all of the wheat flour samples from Algeria (Riba et al., 2008). Roigé et al. (2009) reported that Penicillium (70%), Fusarium (47%), and Aspergillus (34%) were the most frequent fungi isolated from corn and Penicillium (42%), Fusarium (27%), and Alternaria (25%) were the most frequently recovered genera from wheat in Argentina.
Eleven species of Aspergillus spp. (including Eurotium spp.) isolated from MEA and DRBC were identified and are listed in Table 2. The occurrence and abundance of each Aspergillus spp. are summarized in the same table. Each Aspergillus spp. abundance is expressed as the average of percentage counts for each species in the total of samples. The most frequently isolated species was A. flavus. Potential ochratoxin A-producing species, such as Aspergillus niger and Aspergillus ochraceus, were detected in lower numbers. Weidenbörner et al. (2000) investigated the mycobiota of two German wheat flours and reported that Aspergillus candidus was the most frequently encountered mold. Also, they indicated that Penicillium aurantiogriseum, Cladosporium cladosporioides, A. flavus, Eurotium herbariorum, Penicillium griseofulvum, Penicillium brevicompactum, and Penicillium viridicatum were isolated to a lesser degree. Kumar et al. (2008) recorded that A. flavus has been isolated at low percentages in cereals.
All 29 A. flavus strains were used to study their AF production (Table 3). Seven strains representing 24.1% of the screened isolates showed a toxic effect of more than 50% mortality on larvae tested and consequently AF production. Using TLC technique, it was found that four strains produced only AFB1, two strains produced AFB1 and AFB2, and one strain produced AFB1, AFG1, and AFG2. It was recognized that different strains of A. flavus vary tremendously in their ability to produce AF. Schroeder and Boller (1973) found that, of the isolates of A. flavus, 96%, 79%, 49%, and 35% isolated from peanuts, cotton seeds, sorghum, and rice grains, respectively, produced AFs. In Egypt, El-Kady et al. (1982, 1991) and El-Kady and Youssef (1993) found that about 15%, 27%, and 39% of A. flavus strains isolated from cotton, soybean, and broad bean seeds, respectively, produced AFs.
T, toxic effect of more than 50% mortality on larvae tested; N.T, nontoxic effect of less than 50% mortality on larvae tested; AFs, aflatoxins; AFB1, aflatoxin B1; AFB2, aflatoxin B2; AFG1, aflatoxin G1; AFG2, aflatoxin G2.
Three flour samples representing 6% of the screened flour samples showed AF-producing potential (Table 4). AFs were detected in the extracts of 22% of wheat grain samples collected from different markets in Egypt (El-Kady and El-Maraghy, 1990). Abdullah et al. (1998) analyzed 83 wheat flour samples in Malaysia and reported that 21.7% of the samples were contaminated with AFs, and of the wheat flour samples, 1.2% were positive for AFB1 at a concentration of 25.6 μg/kg, 4.8% were positive for AFB2 at concentrations ranging from 11.3 to 252.5 μg/kg, 3.6% were positive for AFG1 at concentrations ranging from 25.0 to 289.4 μg/kg, and 13.3% were positive for AFG2 at concentrations ranging from 16.3 to 436.3 μg/kg. In another study, Giray et al. (2007) analyzed 41 wheat samples in Turkey and 59% of the samples were found to be contaminated with total AF; the percentage of positive samples for AFB1, AFB2, AFG1, and AFG2 were 42%, 12%, 37%, and 12%, respectively. Aydin et al. (2008) reported that the total AFs were lower than those reported by Giray et al. (2007) and Abdullah et al. (1998). Roigé et al. (2009) recorded that wheat samples were negative for AFLA, but AFB1 was detected in 4% of the corn samples in Argentina. Our results showed that total AF occurrence in wheat flour in Jeddah (Saudi Arabia) could not be a relatively critical point, regarding quality of wheat flour. Kichou and Walser (1993) demonstrated that 23% of A. flavus strains isolated from sorghum in Morocco produced AFB1 and AFB2. In India, Sashidhar et al. (1991), analyzing 150 sorghum grain samples, found high rates of contamination by A. flavus (67%) and Fusarium (59%); however, only two strains produced AFB1 at concentrations of 16 and 40 μg/kg. Production of AFB1 and AFB2 in sorghum and wheat inoculated with A. flavus was also reported by Winn and Lane (1978).
Although 29 wheat flour samples out of 50 samples were contaminated with A. flavus spores, only 3 flour samples were contaminated with AFs. Water activity of dry flour is too low to support growth or toxin production of flour-contaminating molds (Eyles et al., 1989); changes in moisture contents of 1% or 2% may be sufficient for growth and mycotoxin contamination (Weidenbörner et al., 2000).
RAPD characterization of A. flavus strains
Twenty-nine strains of A. flavus were used to study the genetic diversity among A. flavus population isolated from flour samples. RAPD-PCR technique was employed using two different primers ari1 and M13. All A. flavus isolates were repeatedly tested. The polymorphic fragment patterns were reproducible with slight variations in intensity and occasionally in the banding pattern. Faint bands were considered only if they were consistently found in different experiments. Bands of higher intensities might be due to the amplification of repetitive sequences or the influence of neighboring sequences on annealing to the target sequence, or might have been generated because of a lower degree of mismatch between primer and target sequence (Goodwin and Annis, 1991; Welsh et al., 1991). With the used primers, each isolate yielded 9–12 bands. The main grouping was made under each primer so that information could be collected for each isolate prone to variation. Therefore, under each primer, all amplification products were scored for each isolate according to molecular weight. The dendrogram produced by the combined cluster analysis of the two primers (Fig. 1) showed no correlation between DNA banding patterns and the ability of toxin production, for example, toxigenic isolate KAUAfl6 clustered together with nontoxigenic isolates KAUAfl8, KAUAfl9, and KAUAfl10 (Fig. 1). As RAPD-PCR technique amplified random fragments of the fungal genome, the fragment that contained the gene regulating toxin production may not have been amplified using this technique with the used primers. Similar results have been described in other studies with Aspergillus spp., showing no correlation between DNA band profiles and production or nonproduction of mycotoxin (Bayman and Cotty 1993; Croft and Varga 1994; Jovita and Bainbridge 1996; Lourenço et al., 2007). Further, Tran-Dinh et al. (1999) conducted a rather thorough investigation on A. flavus and A. parasiticus and found no relationship between RAPD profile and toxin production. However, in one investigation with isolates of Aspergillus sect. Flavi using RAPD, Egel and collaborators (1994) grouped strains with similar toxigenic capacities, in a more subtle differentiation than the simple classification of toxin producers and nonproducers.
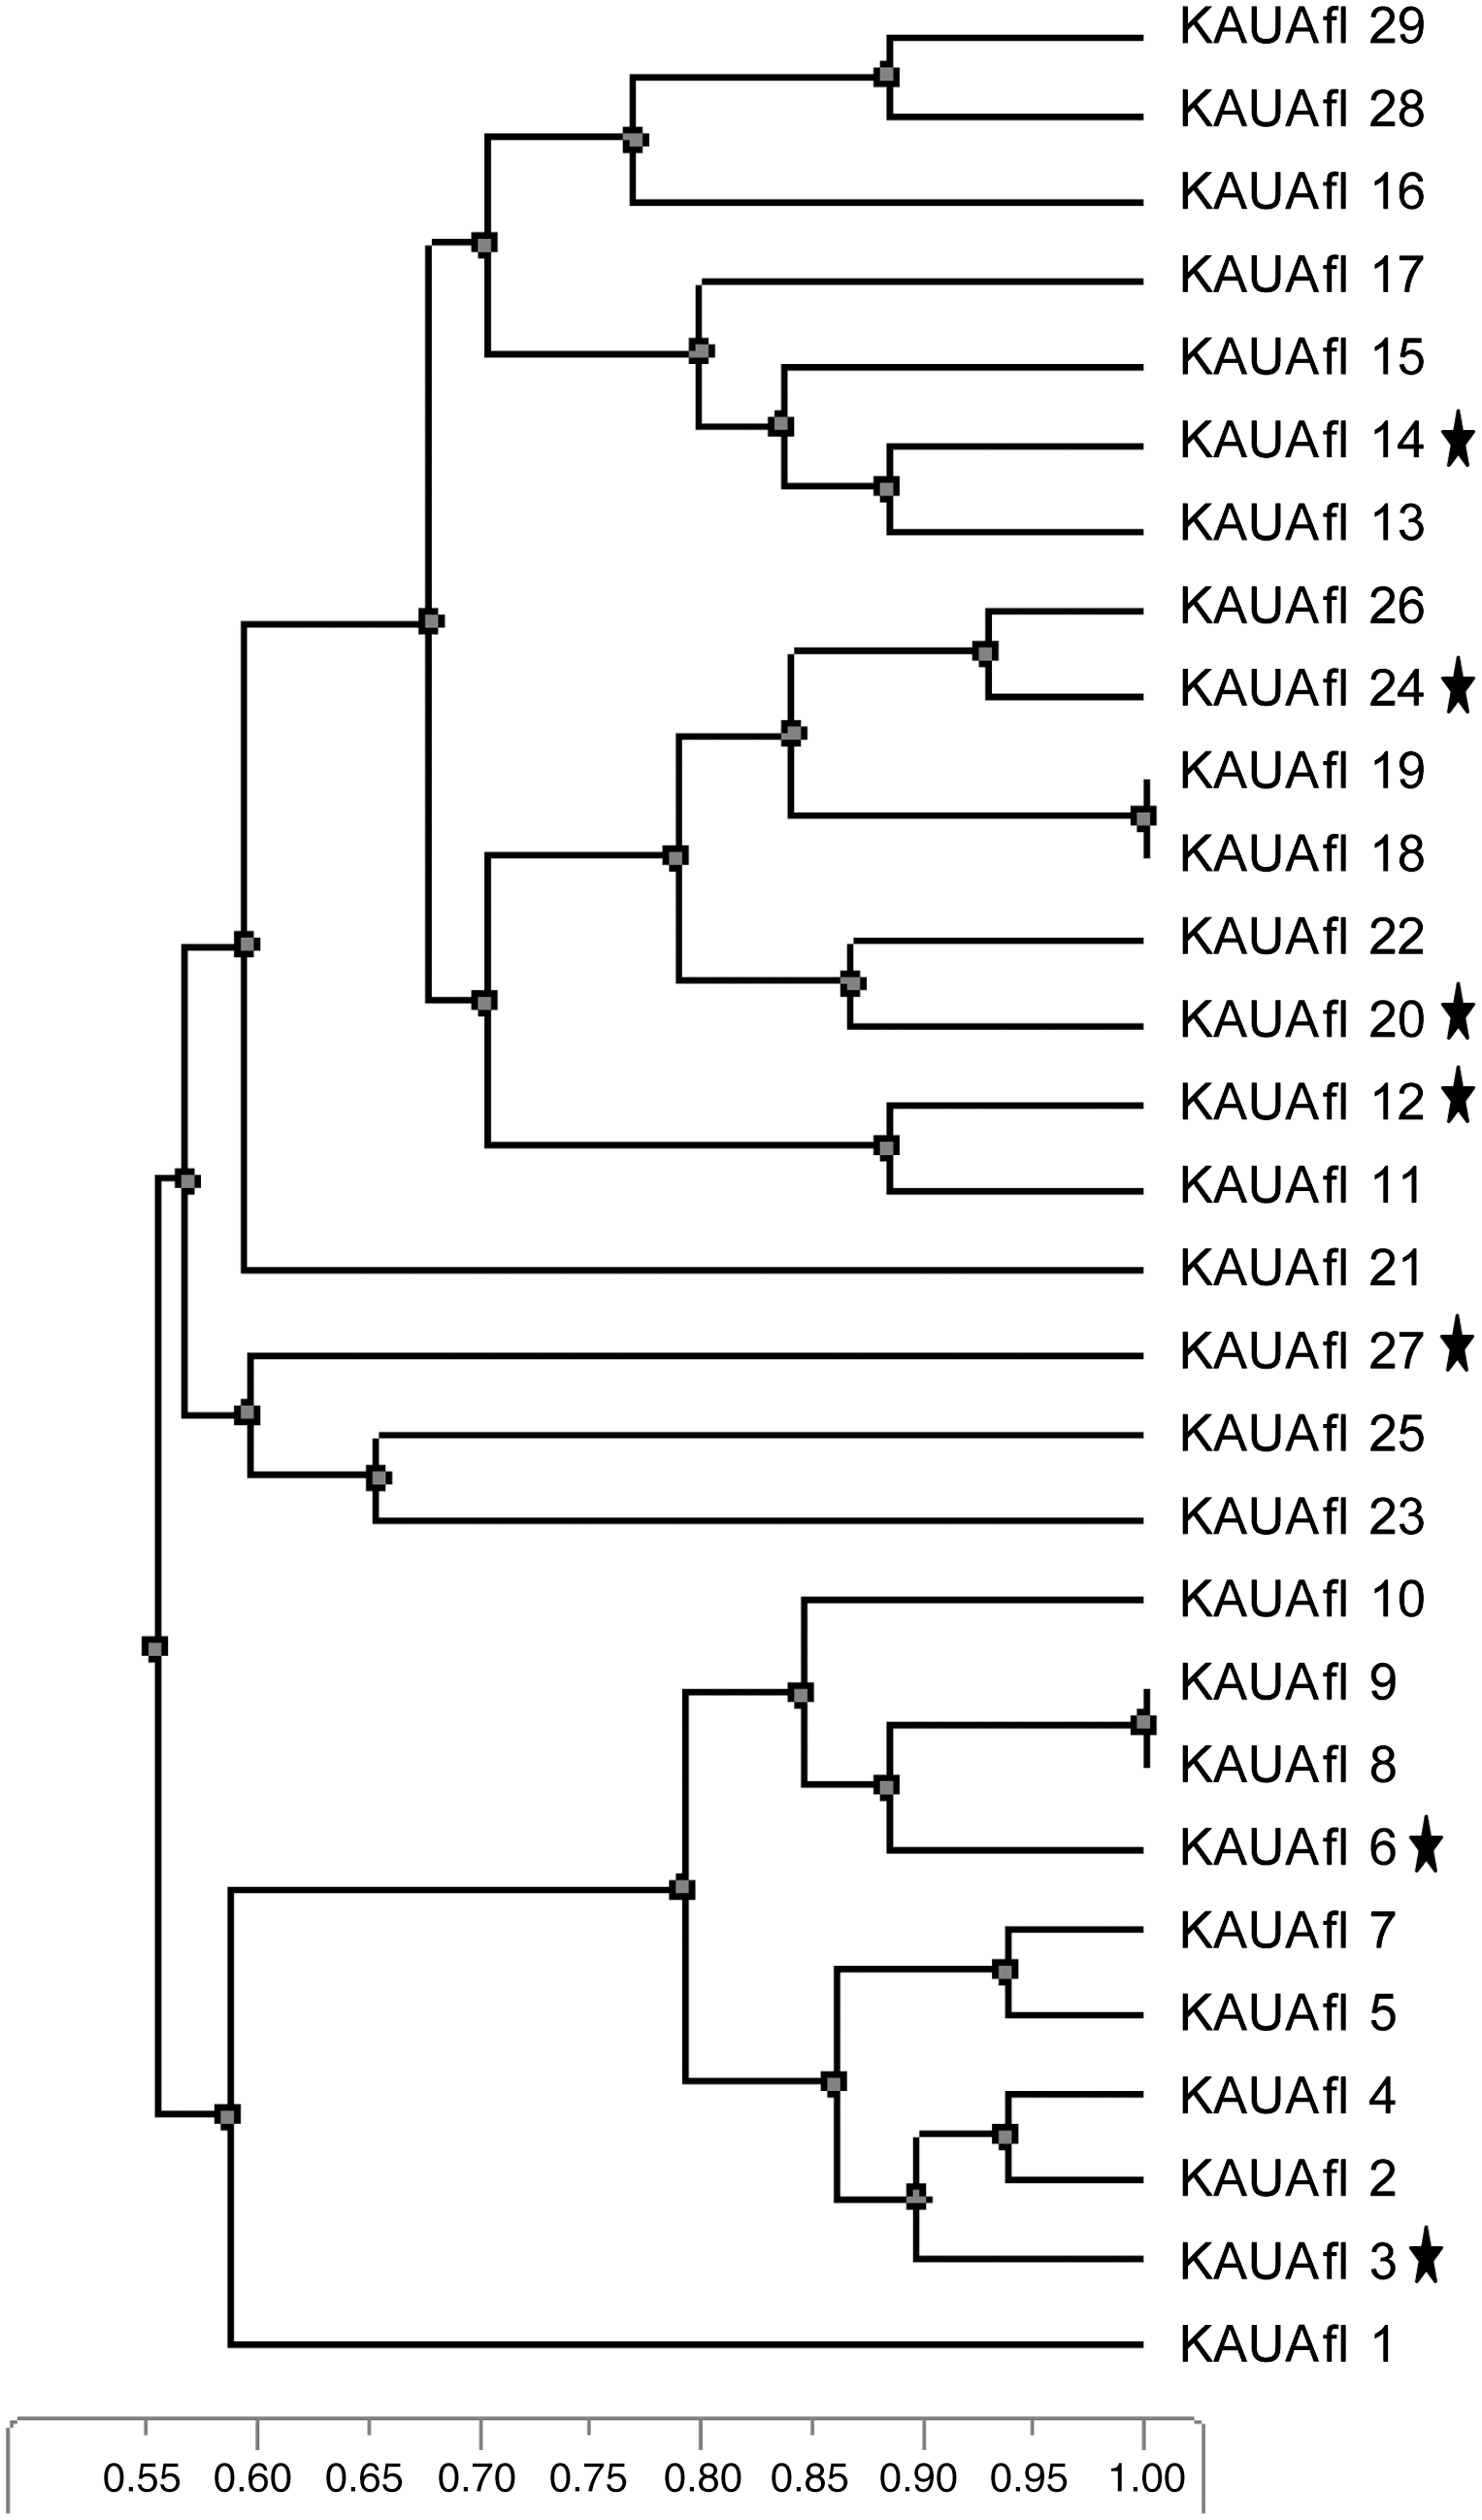
Dendrogram showing relationships among 15 isolates of Aspergillus flavus isolated from different flour samples. Genetic distances were obtained by random amplified polymorphic DNA analysis using M13 and ari1 primers. Aflatoxigenic isolates are marked with stars.
Detection of AF regulatory gene in flour samples and A. flavus isolates
DNA from flour samples (three samples) and A. flavus (seven isolates) that showed toxicity against Artemia were subjected for detection of AF regulatory gene (Fig. 2). Genomic DNA extracted from aflatoxigenic A. flavus and flour samples were used as templates and PCR was performed with primers for a portion of the aflatoxin biosynthetic target gene, aflR1. All tested samples produced a PCR product of approximately 798 bp. The nested PCR primers generated an expected size amplicon of 400 bp (Fig. 2). Shapira et al. (1996), using the primers omt-1 and ver-1, were able to detect Aspergillus species in corn flour after 24-h incubation in enriched media. Sweeney et al. (2000) introduced a similar system directed against the regulatory aflR gene and the ord1 gene. They also found a correlation between expression of the AF biosynthesis genes and AF production. However, they did not quantify their results and they demonstrated the functionality of the system in media but not in a food matrix. The nested PCR product from A. flavus in spiked maize samples after enrichment was 398 bp (Somashekar et al., 2004). Manonmani et al. (2005) reported that the toxigenic species of A. flavus showed an amplicon size of 400 bp when amplified with the primer set aflR2. These results confirm TLC and toxicity results. Thus, this method can be used for detection of AF contamination in flour samples directly without classical methods.
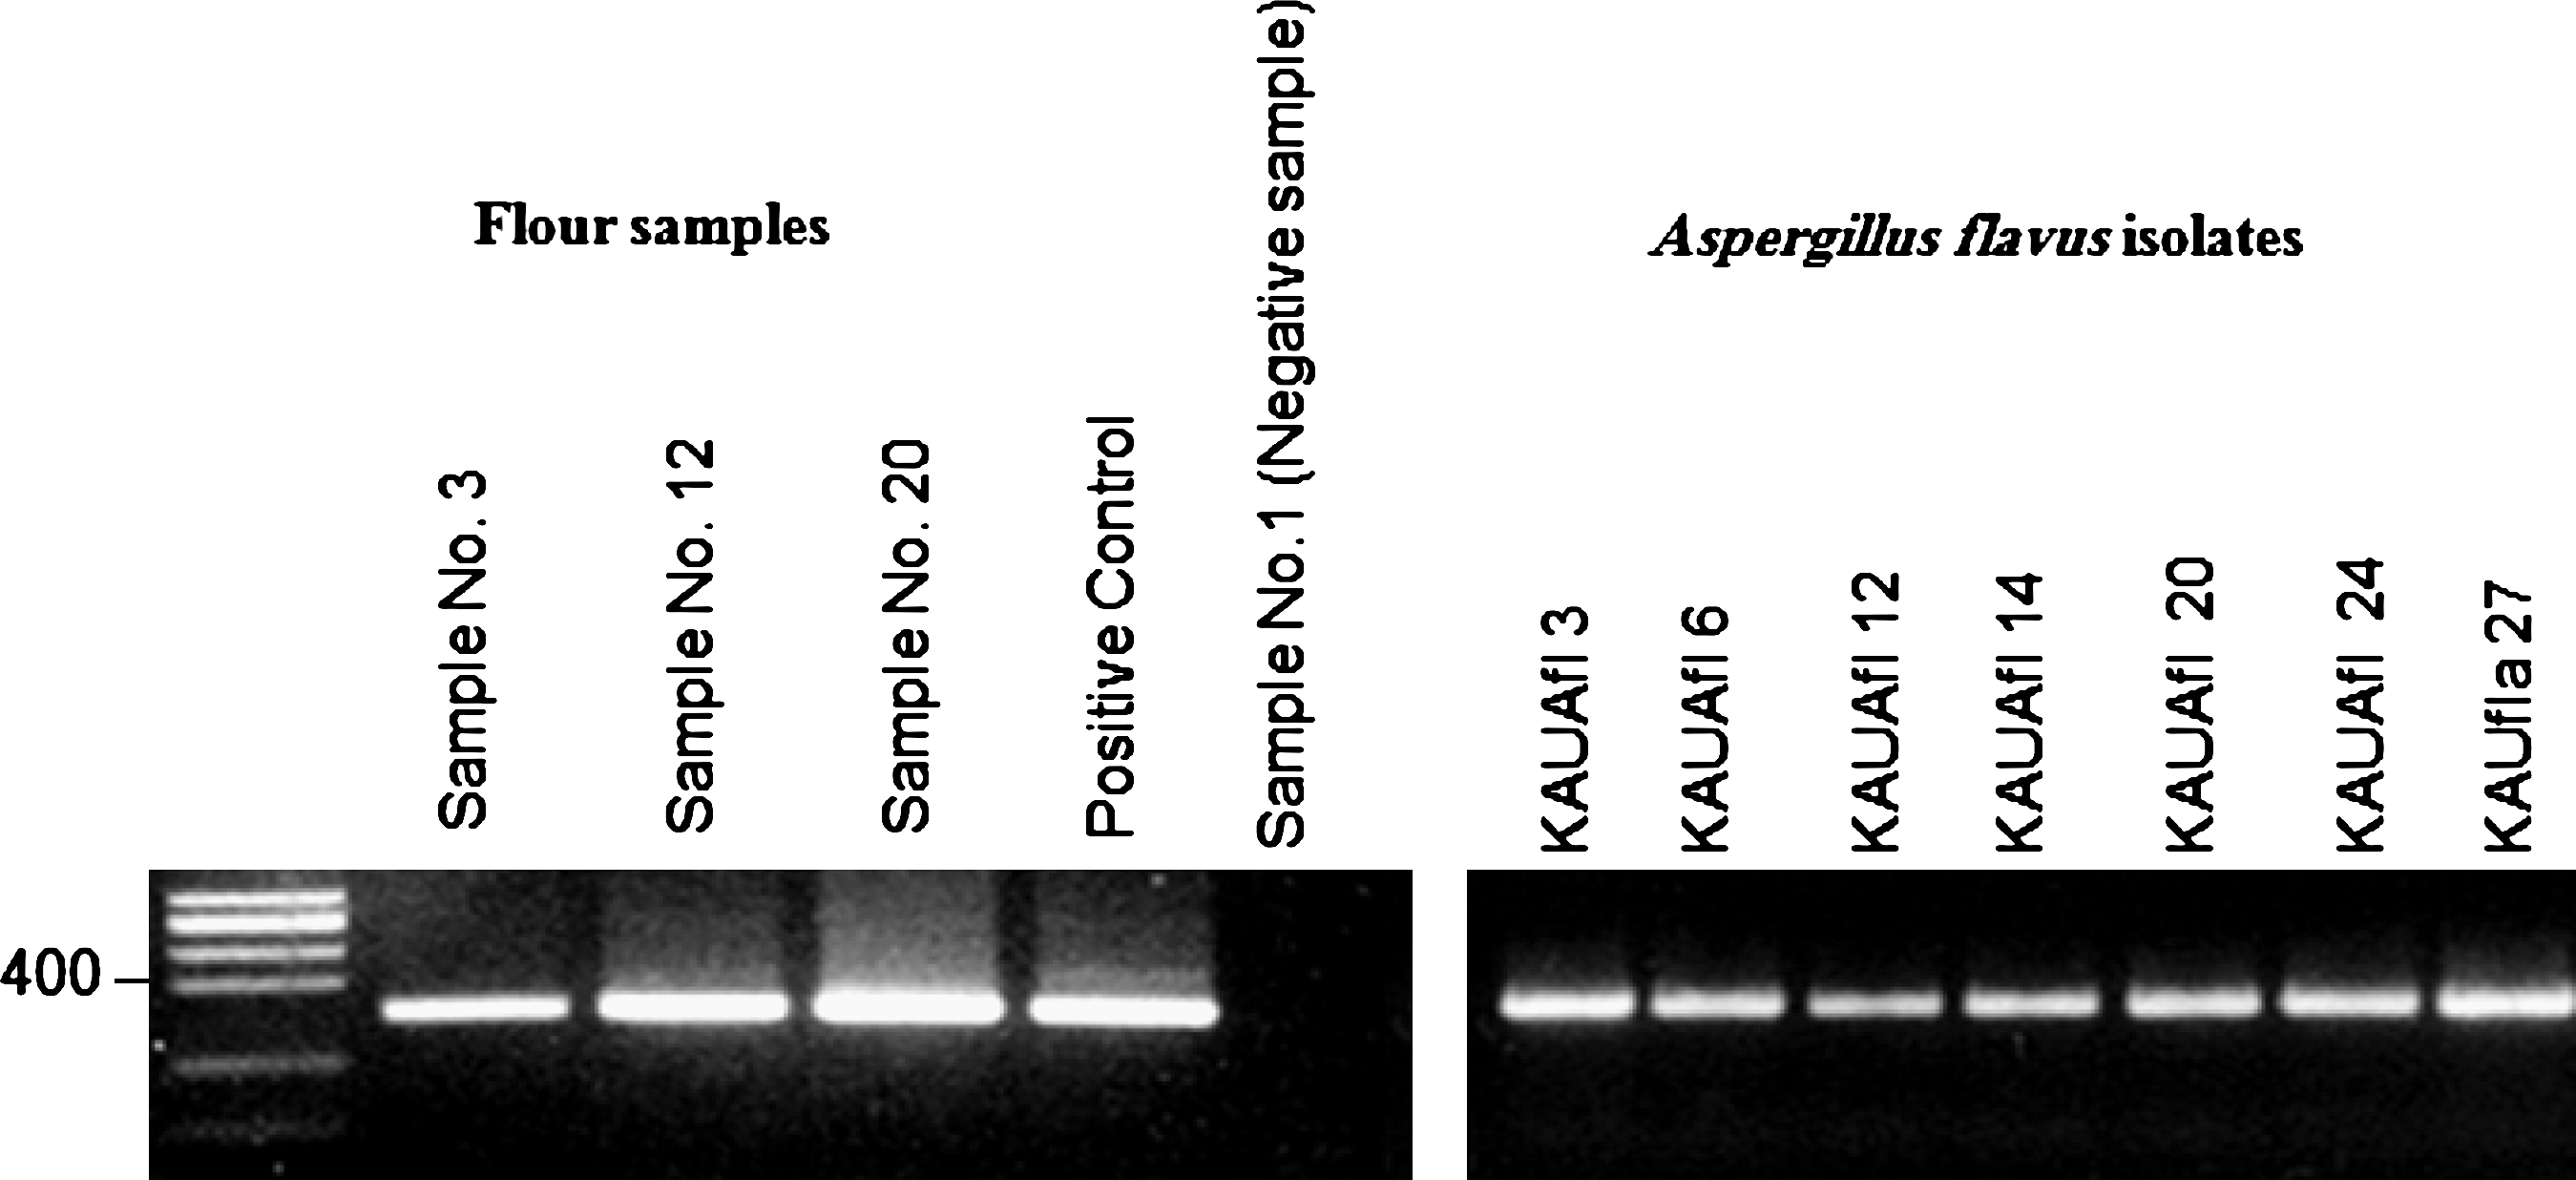
Detection of aflatoxin regulatory gene among few flour samples and A. flavus isolates.
Footnotes
Acknowledgment
This work was supported by a grant (contract no. 18-001-429) from the King Abdulaziz University, Kingdom of Saudi Arabia.
Disclosure Statement
No competing financial interests exist.