




Abstract
Listeria monocytogenes can survive and grow under wide-ranging environmental stress conditions encountered both in foods and in the host. The ability of certain L. monocytogenes subtypes to thrive under stress conditions present in specific niches was hypothesized to reflect genetic characteristics and phenotypic capabilities conserved among strains within a subtype. To quantify variations in salt stress phenotypes among 40 strains selected to represent the diversity of the three major L. monocytogenes genetic lineages and to determine if salt stress phenotypes were associated with genetic relatedness, we measured growth under salt stress at both 7°C and 37°C. At 7°C, in brain–heart infusion with 6% NaCl, average growth rates among the lineages were similar. A comparison of doubling times after exposure to salt stress at 7°C or 37°C indicated that growth at 7°C provided crossprotection to subsequent salt stress for strains in lineages I and II. At 37°C, in brain–heart infusion with 6% NaCl, lineage I and III strains grew significantly faster (p < 0.0001) than lineage II strains. Under salt stress at 37°C, differences in growth parameters were significantly (p < 0.005) associated with genetic relatedness of the strains. Compatible solute uptake is part of the L. monocytogenes salt stress response, but growth differences between the lineages were not related to differences in transcript levels of osmolyte transporter-encoding genes betL, gbuA, oppA, and opuCA. The combination of phylogenetic and phenotypic data suggests that L. monocytogenes lineage I and III strains, which are most commonly associated with human and animal disease, may be better adapted to osmotic stress at 37°C, conditions that are present in the host gastrointestinal tract.
Introduction
Certain subtypes of L. monocytogenes are significantly associated with isolation from specific environmental niches (Gray et al., 2004). Molecular subtyping methods have differentiated L. monocytogenes isolates into three genetic lineages (Rasmussen et al., 1995; Wiedmann et al., 1997): lineage I isolates are commonly associated with sporadic and epidemic cases of human listeriosis, lineage II isolates are most commonly isolated from foods and the environment, and lineage III isolates are typically associated with cases of animal listeriosis (Gray et al., 2004; Ward et al., 2004; Roberts et al., 2006; Sauders et al., 2006). Epidemics of invasive listeriosis in North America predominantly have been caused by lineage I strains. In general, lineage I strains are more virulent, based on in vitro assay results (Nightingale et al., 2006), and have lower predicted infectious doses (Chen et al., 2006) than lineage II strains. Variation in virulence (Wiedmann et al., 1997) and in growth capabilities under adverse conditions (De Jesus and Whiting, 2003; Lianou et al., 2006; van der Veen et al., 2008) have been observed among different subtypes of L. monocytogenes, which may, in part, explain the predominance of some subtypes in human disease.
Osmotic stress is among the adverse conditions that L. monocytogenes may experience in foods and in the host gastrointestinal tract. Growth and survival of L. monocytogenes under high osmolarity is attributed mainly to its ability to accumulate compatible solutes, particularly glycine betaine (Ko et al., 1994; Smith, 1996; Sleator et al., 1999). Mechanisms that contribute to osmotic stress resistance, such as the glycine-betaine and carnitine compatible solute transporters, also play a role in allowing L. monocytogenes to grow at low temperatures (Sleator et al., 2003b). In addition to the overlap in response between osmotic stress and cold stress, exposure of L. monocytogenes to osmotic stress at 37°C also increases its resistance to subsequent exposure to bile salts (Begley et al., 2002), and increases expression of virulence genes (Sue et al., 2004). These observations support the hypothesis that osmotic stress encountered in the gastrointestinal tract serves as a signal to facilitate subsequent L. monocytogenes infection of the host (Sleator et al., 2007).
We hypothesized that differences in the ability to adapt to osmotic stress may contribute to differences in survival and transmission of L. monocytogenes. For example, subtypes that are commonly isolated from foods, such as lineage II strains, may have a relative fitness advantage under cold and osmotic stress, whereas subtypes commonly isolated from clinical cases, such as lineage I and III strains, may have a survival advantage under conditions present in the gastrointestinal tract. Variations in osmotic stress phenotypes at different growth temperatures have not been quantified previously; it is unclear whether osmotic stress phenotypes vary with respect to the genetic background of the strain. Therefore, to identify specific characteristics that may allow niche adaptations among the three genetic lineages of L. monocytogenes, we selected a diverse set of 40 strains and measured the growth parameters of these strains in a broth medium at either 7°C or 37°C, with and without the addition of 6% NaCl. We combined growth and gene expression data with multilocus sequence typing (MLST) data to identify associations between phenotype and genetic relatedness of the strains. We observed significant interlineage differences in growth parameters after transfer to a high-salt medium at 37°C. Further, these differences in growth parameters are significantly associated with genetic relatedness among the strains, indicating that the ability to adapt to salt stress at host body temperatures is linked to the strains' evolutionary history.
Materials and Methods
L. monocytogenes isolates and growth conditions
The 40 strains that were selected to represent the genetic diversity of L. monocytogenes (Table 1) were stored at −80°C in brain–heart infusion (BHI) (Becton, Dickinson, and Company, Sparks, MD) broth with 15% glycerol. In preparation for the experiments, isolates were streaked to BHI agar from frozen stocks and incubated for 24 h at 37°C. A single colony was transferred to 5 mL BHI, followed by incubation at 37°C, with shaking at 230 rpm, for 20 h. For measurement of strain growth parameters under salt stress, isolates were grown at either 37°C or 7°C in BHI broth with and without 6% NaCl. Specifically, 750 μL of the 20 h culture was either (i) transferred to 75 mL BHI broth at 37°C, followed by incubation at 37°C for 3 h, without shaking, or (ii) transferred to 75 mL BHI broth at 7°C, followed by incubation at 7°C for 50 h, without shaking. Both culture conditions yielded midexponential-phase cultures. After growth to midexponential phase, cultures in BHI at 37°C were transferred 1:1000 into either (i) 75 mL BHI broth or (ii) 75 mL BHI + 6% NaCl and incubated at 37°C, without shaking. After growth to midexponential phase, cultures in BHI broth at 7°C were transferred 1:1000 into either (i) 75 mL 7°C BHI broth or (ii) 75 mL 7°C BHI broth + 6% NaCl and incubated at 7°C, without shaking. Cultures at 37°C were sampled every 90 min for 12 h (BHI) or 27 h (BHI + 6% NaCl) and cultures at 7°C were sampled every day for 7–9 days (BHI) or 14–16 days (BHI + 6% NaCl). Samples were diluted in phosphate-buffered saline (pH 7.4) and plated onto BHI agar with an Autoplate 4000 (Spiral Biotech, Bethesda, MD); plates were incubated at 37°C for 24 h before enumerating colonies with a Q-Count (Spiral Biotech). Growth was monitored for two independent replicates of each strain in BHI and BHI + 6% NaCl at both temperatures. A level of 6% NaCl was selected to represent the water-phase salt content that L. monocytogenes experiences in foods, particularly those foods that are considered to be of high or moderate risk per serving for listeriosis, including deli meat, smoked seafood, and soft unripened cheeses (FDA, 2003). The water-phase salt content of these foods ranges from 2% to 8% for smoked seafood (Hwang et al., 2009) and from 2.5% to 6.6% for soft cheeses (Ryser, 2007).
Lineage IIIB is also known as lineage IV (Ward et al., 2008).
Growth parameter data analysis
Growth parameters for each strain in BHI and BHI + 6% NaCl at 7°C or 37°C were estimated using the Baranyi model (Baranyi and Roberts, 1994) implemented in the NLStools v. 0.0-4 package in R v. 2.5.1. CFU/mL values for each strain at every time point were log-transformed and used to estimate the lag phase duration and maximum specific growth rate. The Shapiro–Wilk test for normality was used to determine if growth rates or lag phase durations for each growth temperature and NaCl combination fit a normal distribution. When the data were not normally distributed, significant differences between lineages were determined using the Kruskal–Wallis test in SAS v. 9.1 (SAS Institute, Cary, NC). For normally distributed data sets, analysis of variance was implemented using the mixed procedure in SAS with a linear model that included lineage, replicate, and date of assay, with date as a random effect and lineage and replicate as fixed effects. The Tukey multiple correction procedure was applied to all analysis of variance results. Adjusted p-values of <0.05 were considered significant. To determine differences in long-term adaptation to salt stress over temperature, a doubling time ratio was calculated from the doubling time in BHI without additional salt and the doubling time in BHI + 6% NaCl. A similar calculation to determine differences in the short-term response to salt stress by temperature could not be done, as there was no measurable lag phase duration in cultures grown in BHI without additional salt. Growth parameters for each strain under each growth condition are available at
MLST and data analysis
All strains in this study were phylogenetically characterized using a 10-gene MLST scheme, which includes sequences from ldh, prs, sigB, polC, rarA, pbpA, addB, lmo0490, lmo1555, and lmo2763 (den Bakker et al., accepted). A species-level phylogeny was constructed using ClonalFrame version 1.1 (Didelot and Falush, 2007), using five independent runs of 200,000 pre-burn-in and 200,000 post-burn-in iterations. The convergence of the Markov Chain Monte Carlo simulations in the different runs was judged satisfactory based on the Gelman–Rubin test (Gelman and Rubin, 1992) as implemented in the ClonalFrame GUI. The maximum clade credibility tree and the posterior probabilities of the individual clades found in this tree were calculated using TreeAnnotator (
To determine if genetic differences were related to phenotypic differences, pairwise distance matrices were created from the phenotypic and MLST gene sequence data. Phenotypic distance matrices were created by calculating the Euclidean distance between all pairs of strains for each phenotypic parameter (growth rate and lag phase duration) for each growth temperature and NaCl combination. The genetic pairwise distance matrix was created in PAUP* version 4.010b (Wilgenbusch and Swofford, 2003) based on the uncorrected percentage difference between the concatenated nucleotide sequences of the 10 MLST genes between all pairs of strains. The Mantel test implemented in the vegan package v1.15-1 in R v. 2.5.1 was used to identify significant correlations between each phenotypic distance matrix and the genetic distance matrix. A total of six comparisons were conducted with 1000 Monte Carlo permutations to generate p-values and a Bonferroni correction was applied to the p-values. A corrected p-value of <0.05 was considered significant.
Quantitative reverse transcription–polymerase chain reaction
Quantitative reverse transcription–polymerase chain reaction (qRT-PCR) was used to quantitatively examine relationships between transcript levels for genes encoding osmolyte uptake transporters and assignment of strain to lineage. A subset of four strains per lineage was selected to represent the average growth rate for each lineage in 37°C BHI + 6% NaCl. Selected strains included lineage I strains F6-366, J1-175, J1-194, and R2-503; lineage II strains F2-515, J1-101, J2-003, and R2-499; and lineage III strains F2-270, J1-031, J1-208, and J2-071. Strains were grown to midlog phase (∼107 CFU/mL) in BHI + 6% NaCl at 37°C as described above. At midlog phase, 20 mL of culture was mixed with 40 mL of RNA Protect (Qiagen, Valencia, CA) and centrifuged at 10,000 rpm, 4°C, for 20 min. The supernatant was decanted, and cell pellets were stored at −80°C overnight before RNA extraction with the RiboPure Bacteria RNA extraction kit (Ambion, Austin, TX). RNA was extracted from three independent cultures of each strain and treated with RiboPure DNase (Ambion) following the manufacturer's protocol. RNA quality was assessed by determining the ratio of absorbance at 260/230 nm on a Nanodrop 1000 (Ambion) and evaluated on a Bioanalyzer (Agilent, Santa Clara, CA). For the set of RNA samples, the 260/230 ranged from 1.98 to 2.45, and the RNA integrity numbers from the Bioanalyzer ranged from 7.9 to 10.0.
TaqMan primers and probes targeting betL, gbuA, opuCA, oppA, and rpoB were designed to amplify these genes across the diversity of L. monocytogenes strains. When available, gene sequences for the strains used in this assay were obtained from GenBank and the L. monocytogenes database at the Broad Institute (
cDNA was synthesized from 1 μg total RNA using the TaqMan Reverse Transcription kit (Applied Biosystems). Reverse transcription reactions contained 1 × TaqMan buffer, 5.5 mM magnesium chloride, 500 μM each dNTP, 2.5 μM random hexamers, 4 U RNase inhibitor, and 12.5 U MultiScribe Reverse Transcriptase and were carried out under the following conditions: 10 min at 25°C, 30 min at 48°C, and 5 min at 95°C. Reactions containing all components except reverse transcriptase were prepared for all RNA samples to determine background levels of DNA. Tenfold serial dilutions of cDNA were used as the input for qPCR assays. qPCRs contained 1 × Universal TaqMan Mastermix (Applied Biosystems), 900 nmol each primer, and 250 nmol TaqMan probe and were run on the ABI Prism 7000 (Applied Biosystems) under the following conditions: 40 cycles at 95°C for 15 sec and 60°C for 1 min. C t and reaction efficiencies were determined using ABI SDS v1.0 software. qPCRs were performed in duplicate for each cDNA sample tested.
Relative expression was determined using the method described by Pfaffl (2001), and the C t values for rpoB were used for normalization within samples. Results from all samples were then compared to the transcript levels of the first replicate of strain with the slowest growth rate, FSL J1-101. Comparison to a single replicate (rather than the average of all FSL J1-101 replicates) was required to allow for calculation of average and standard deviation of transcript levels for J1-101 as well as all other strains and to allow for use of amplification efficiency data (which can differ between replicates) in our calculations. The average log2 expression and standard deviation from three independent RNA samples are reported for each strain tested.
To determine if genetic differences among strains were related to gene expression differences among strains, the Mantel test was implemented as described above. Genetic distance matrices were created for each of the compatible solute transporter genes based on nucleotide differences in the coding region of each gene. Gene expression distance matrices were created by calculating the Euclidean distance between all pairs of strains for each gene. A p-value of <0.05 was considered significant.
Molecular evolution of osmolyte uptake transporter genes
To analyze the molecular evolution of the osmolyte uptake genes, phylogenetic, recombination, and positive selection analyses were performed on betL, opuCA, gluA, and oppA sequences of the subset of strains used in the qRT-PCR experiments. Sequences were aligned manually in MacClade 4.08 (
Results
Growth parameters at 7°C are similar across lineages
Average growth rates in BHI at 7°C were not significantly different (p = 0.705, Kruskal–Wallis test) across the three genetic lineages of L. monocytogenes (Fig. 1A). The average growth rates were 0.74 ± 0.11 log10(CFU/mL)/day for lineage I, 0.72 ± 0.12 log10(CFU/mL)/day for lineage II, and 0.78 ± 0.11 log10(CFU/mL)/day for lineage III strains. While strains grew more slowly in BHI + 6% NaCl at 7°C than in BHI alone, growth rates remained similar across lineages in BHI + 6% NaCl. Significant differences in average growth rate were not observed among the lineages (p = 0.06) (Fig. 1B). The average growth rate in BHI + 6% NaCl at 7°C was 0.49 ± 0.08 log10(CFU/mL)/day for lineage I, 0.44 ± 0.09 log10(CFU/mL)/day for lineage II, and 0.48 ± 0.06 log10(CFU/mL)/day for lineage III strains. Strain-to-strain variation within a lineage accounted for 55% of the total variation, which was much greater than the variation between lineages (4%). In BHI at 7°C, there was no detectable lag phase, as cultures were transferred to this medium from midexponential-phase growth in BHI at 7°C. In BHI + 6% NaCl at 7°C, the average lag phase duration was 41.4 ± 14.5 h for lineage I, 53.5 ± 20.4 h for lineage II, and 54.4 ± 22.8 h for lineage III. The average lag phase duration was not significantly different (p = 0.061) among lineages (Fig. 1C).
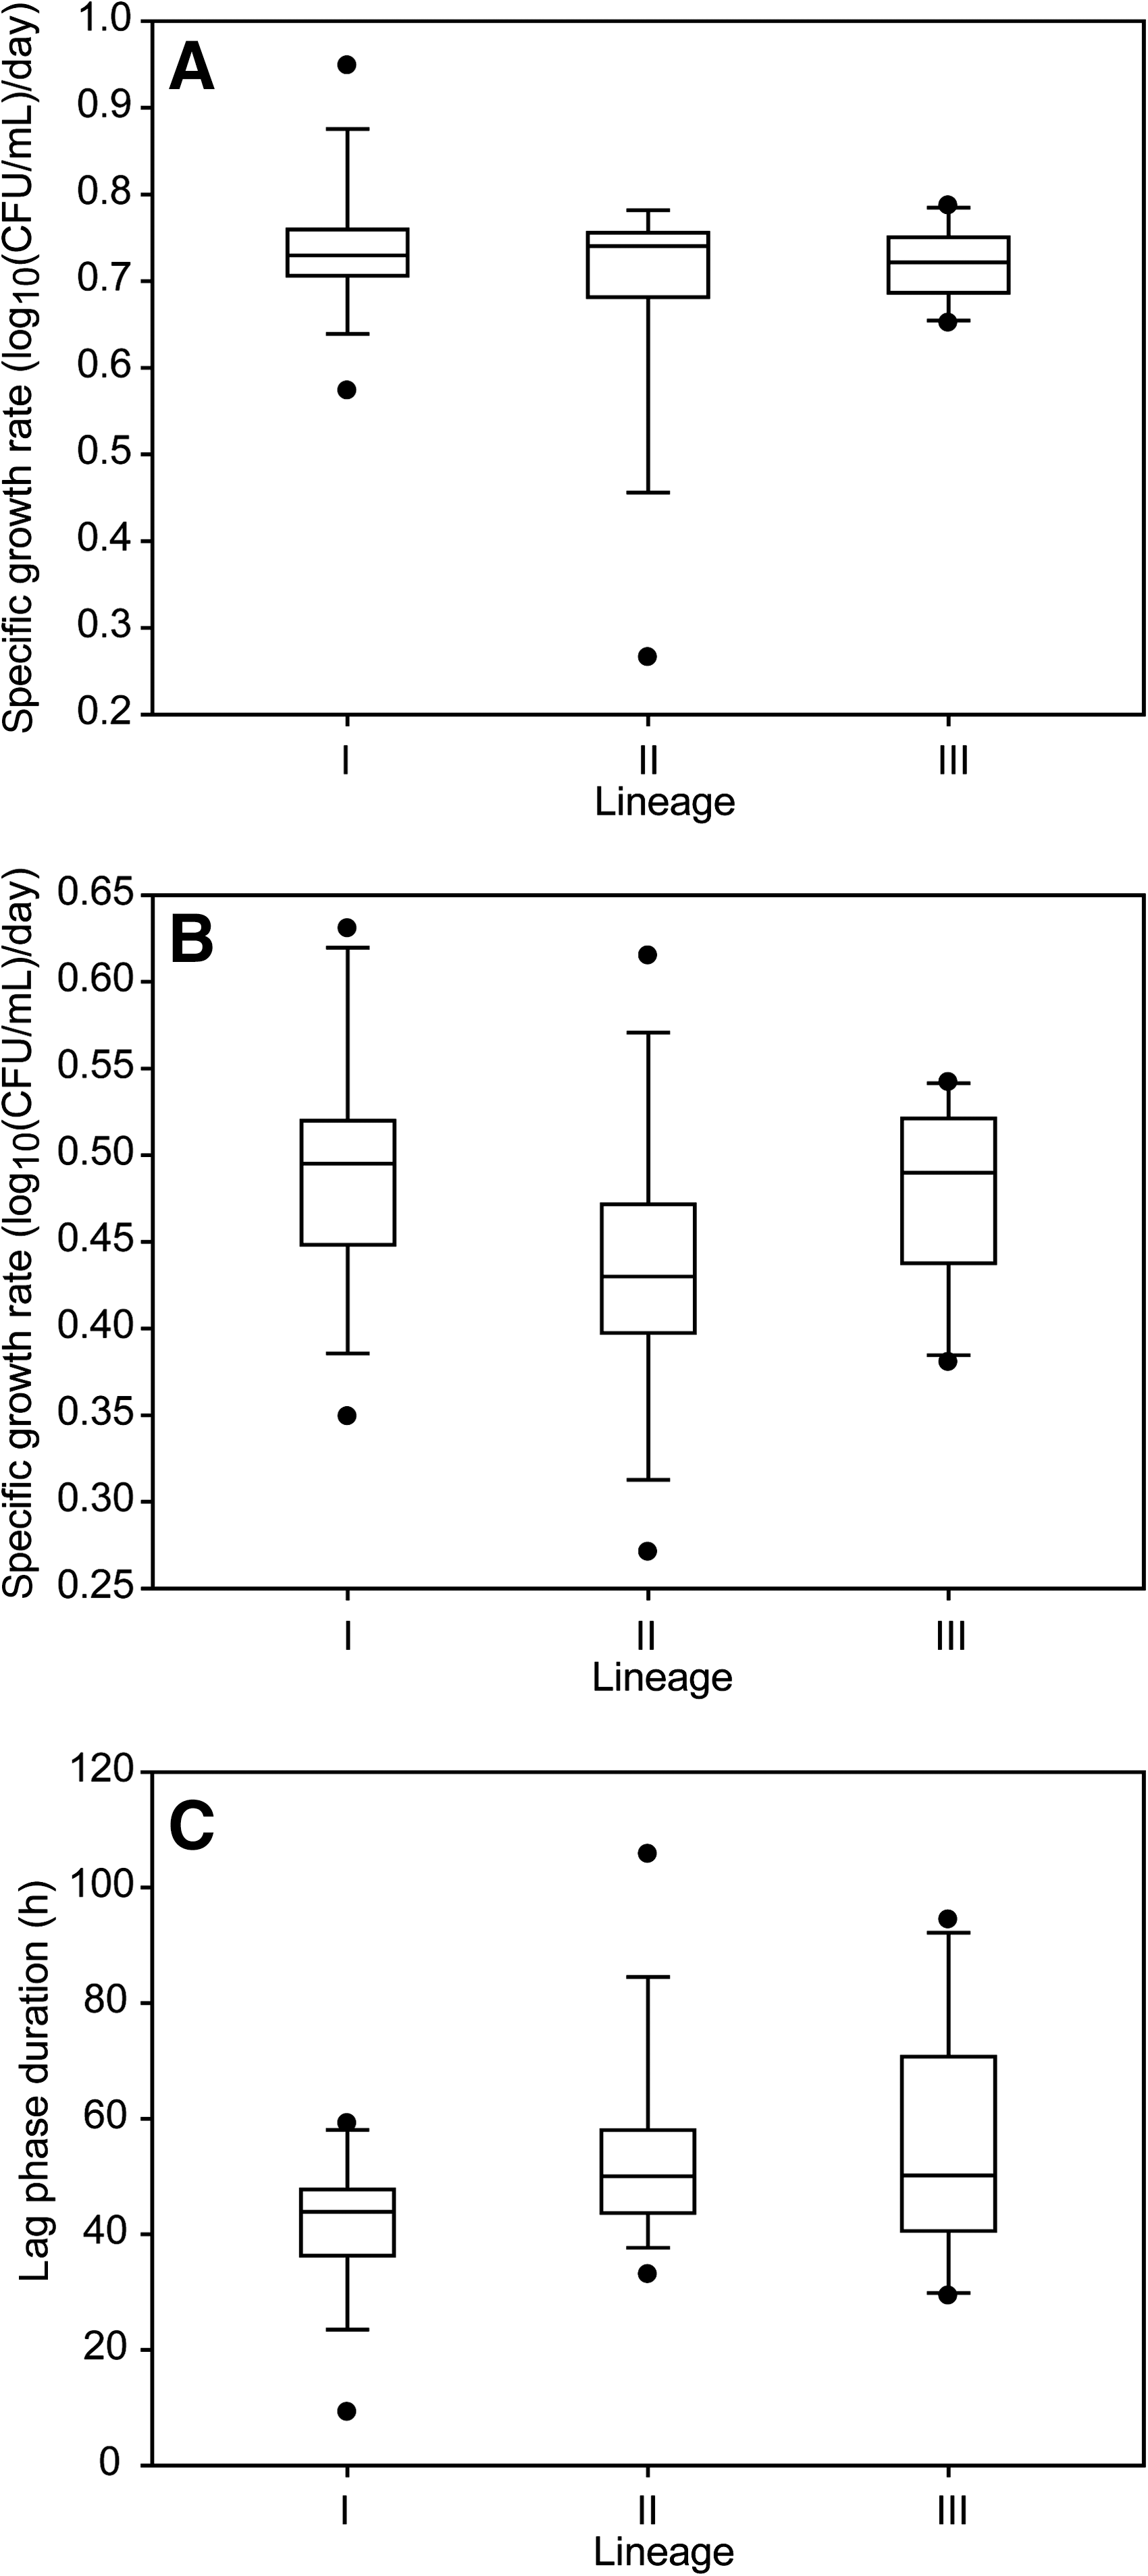
Boxplots of the distribution of growth parameters for strains representing each genetic lineage of Listeria monocytogenes at 7°C. (
Growth parameters at 37°C in BHI + 6% NaCl differ among lineages
While growth rates in BHI at 37°C were similar across lineages, distinct differences in growth parameters among lineages were observed after transfer to BHI + 6% NaCl at 37°C of cultures that had been growth to midexponential growth in BHI at 37°C. The average growth rates in BHI at 37°C were 0.47 ± 0.04 log10(CFU/mL)/h for lineage I, 0.46 ± 0.04 log10(CFU/mL)/h for lineage II, and 0.49 ± 0.03 log10(CFU/mL)/h for lineage III strains (Fig. 2A). Growth rates in BHI at 37°C were not normally distributed (p = 0.035). The Kruskal–Wallis test detected no significant differences in growth rates among lineages (p = 0.093). After transfer to BHI + 6% NaCl, the average growth rate for lineage I strains [0.27 ± 0.03 log10(CFU/mL)/h] was significantly higher (adjusted p < 0.0001) than the average growth rate for lineage II strains [0.23 ± 0.03 log10(CFU/mL)/h] and significantly lower (adjusted p < 0.001) than the average growth rate for lineage III strains [0.30 ± 0.04 log10(CFU/mL)/h] (Fig. 2B). The average growth rate for lineage II strains was significantly lower (adjusted p < 0.0001) than the average growth rate for lineage III strains. Variances in growth rates among the lineages were similar; strain-to-strain variation within a lineage accounted for 43% of the total variance, which was smaller than the variation among lineages (53%). In BHI at 37°C, there was no detectable lag phase, as cultures were transferred to this medium from midexponential-phase growth in BHI at 37°C. Transfer of midexponential-phase cells from BHI at 37°C to BHI + 6% NaCl yielded an average lag phase duration for lineage III strains (7.5 ± 1.1 h) that was significantly longer than for lineage I strains (5.9 ± 1.1 h, adjusted p < 0.0001) or for lineage II strains (6.5 ± 1.1 h, adjusted p = 0.001) (Fig. 2C).
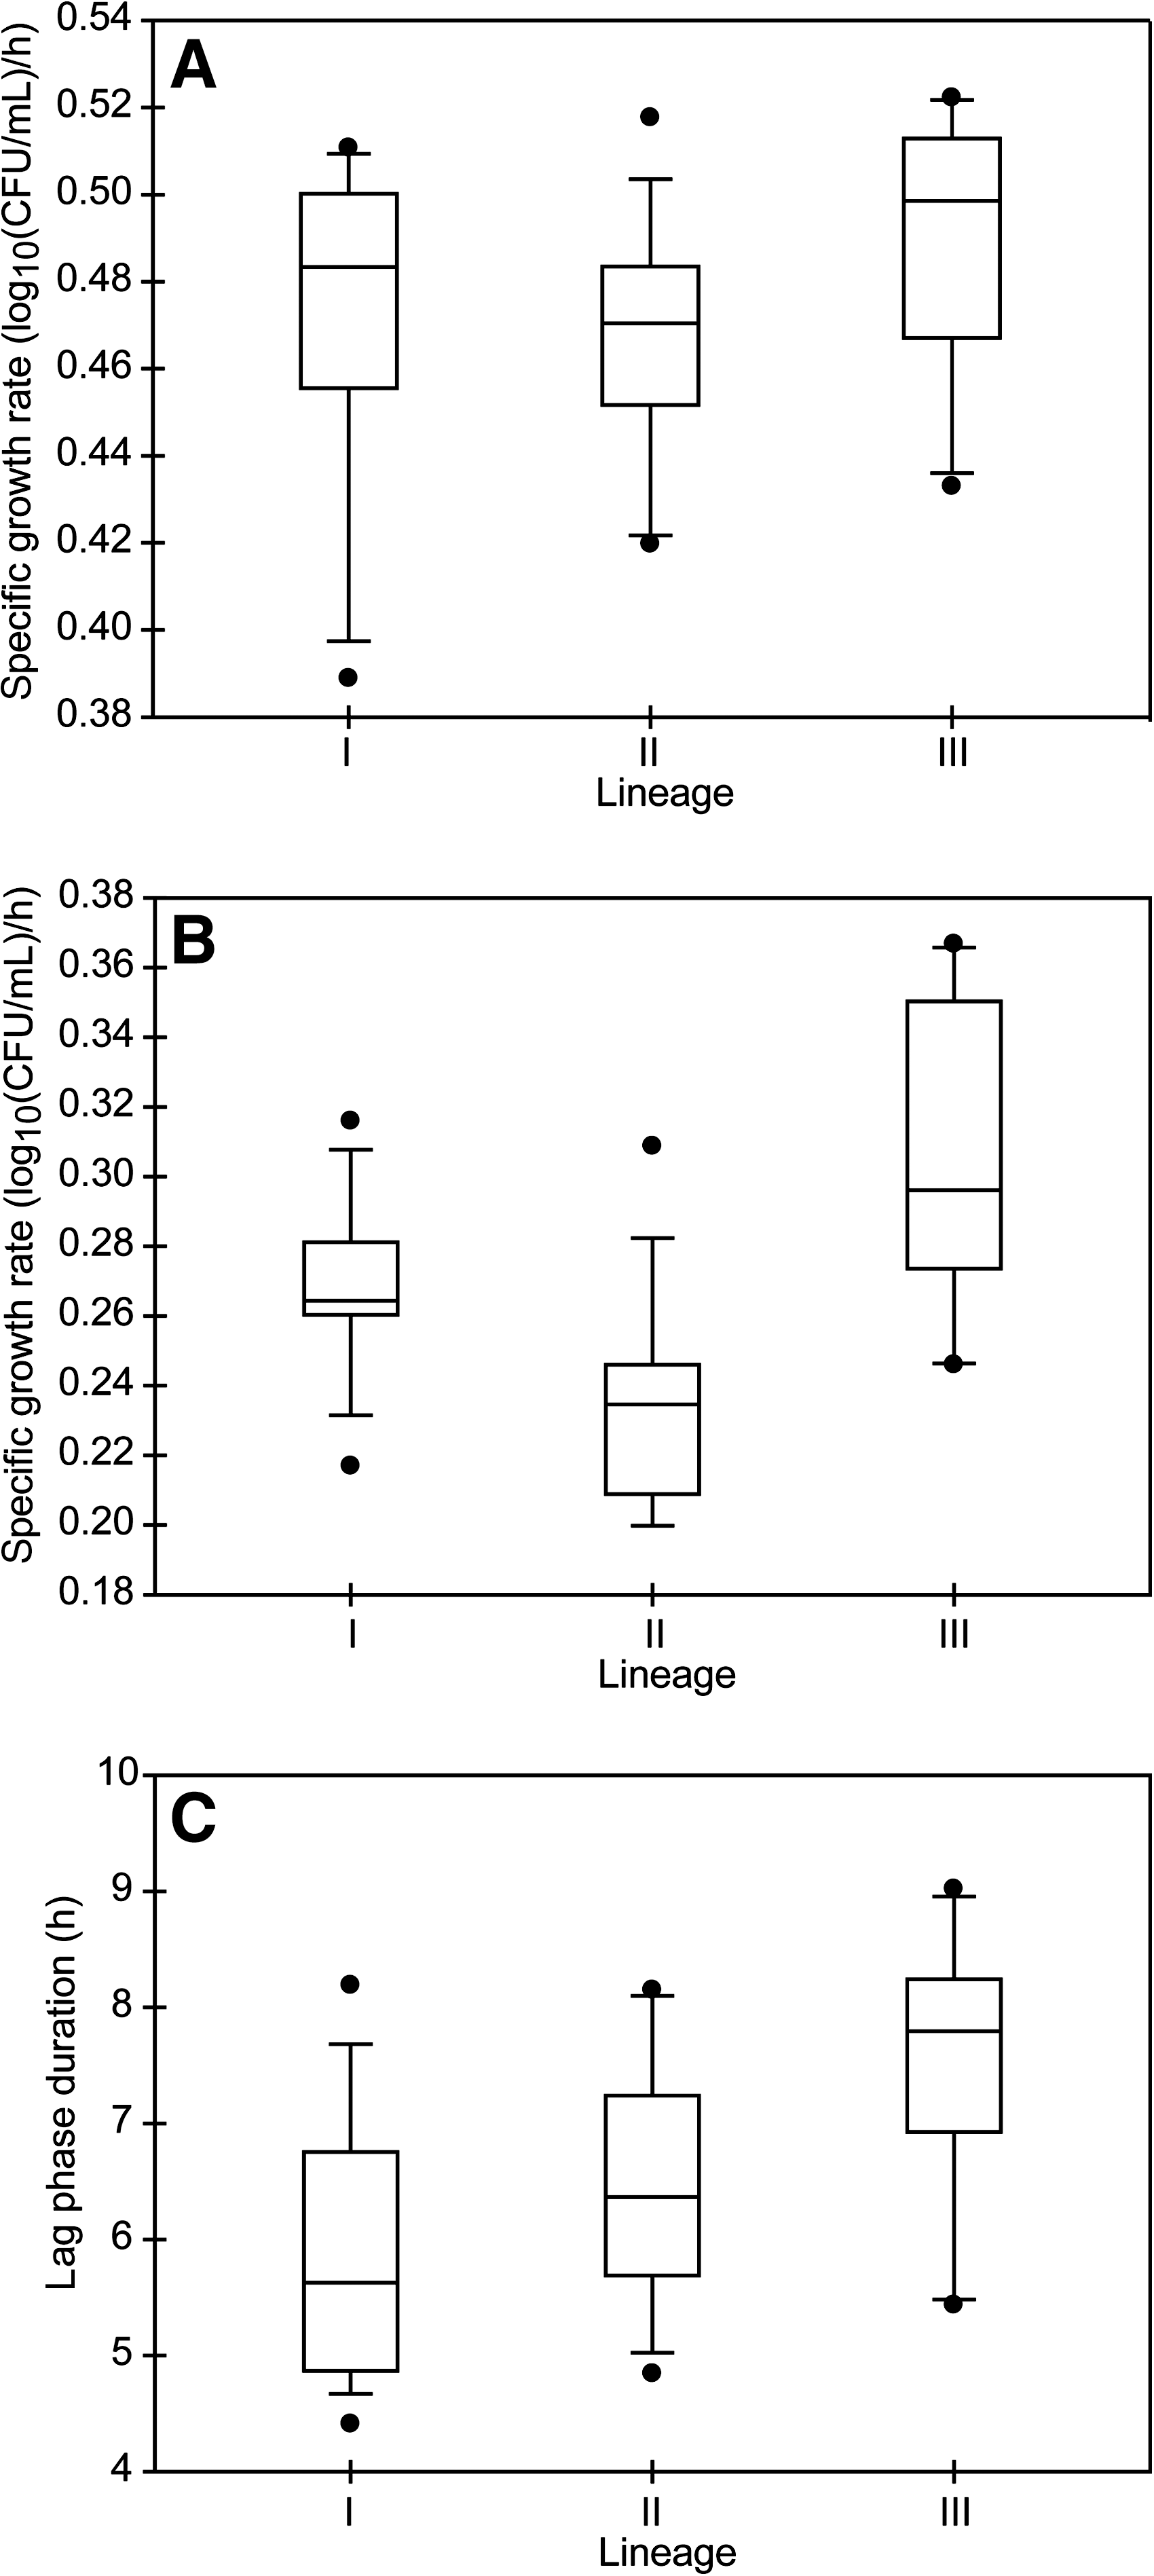
Boxplots of the distribution of growth parameters for strains representing each genetic lineage of L. monocytogenes at 37°C. (
Growth at 7°C provides preadaptation to salt stress compared to growth at 37°C
We hypothesized that growth of L. monocytogenes at 7°C may enhance its subsequent adaptation to salt stress. This hypothesis is supported by previous reports of cold growth induction of expression of genes encoding compatible solute transporters, which are also used to combat osmotic stress (Smith, 1996; Sleator et al., 1999; Bayles and Wilkinson, 2000). To test this hypothesis, we calculated the doubling time ratio, which is the doubling time in BHI + 6% NaCl divided by the doubling time in BHI, for each strain at each growth temperature. If incubation temperature has no role in the long-term adaptation to salt stress, we would expect to see similar changes in doubling time due to the salt shift at both growth temperatures across the lineages. For lineage I strains, the average doubling time ratio at 37°C was 1.76 ± 0.18, indicating that the average doubling time in BHI + 6% NaCl was 1.76 times greater than the average doubling time in BHI without additional NaCl. The lineage I average doubling time ratio at 37°C was significantly higher (p = 0.014, Kruskal–Wallis test) than at 7°C, where the doubling time ratio was 1.54 ± 0.32 (Fig. 3). For lineage II strains, the average doubling time ratio at 37°C was 2.02 ± 0.22, which was significantly higher (p = 0.005, Kruskal–Wallis test) than at 7°C, where the doubling time ratio was 1.62 ± 0.33. For lineage III strains, the average doubling time ratio at 37°C was 1.64 ± 0.18 which was similar (p = 0.13) to that at 7°C, 1.52 ± 0.21.
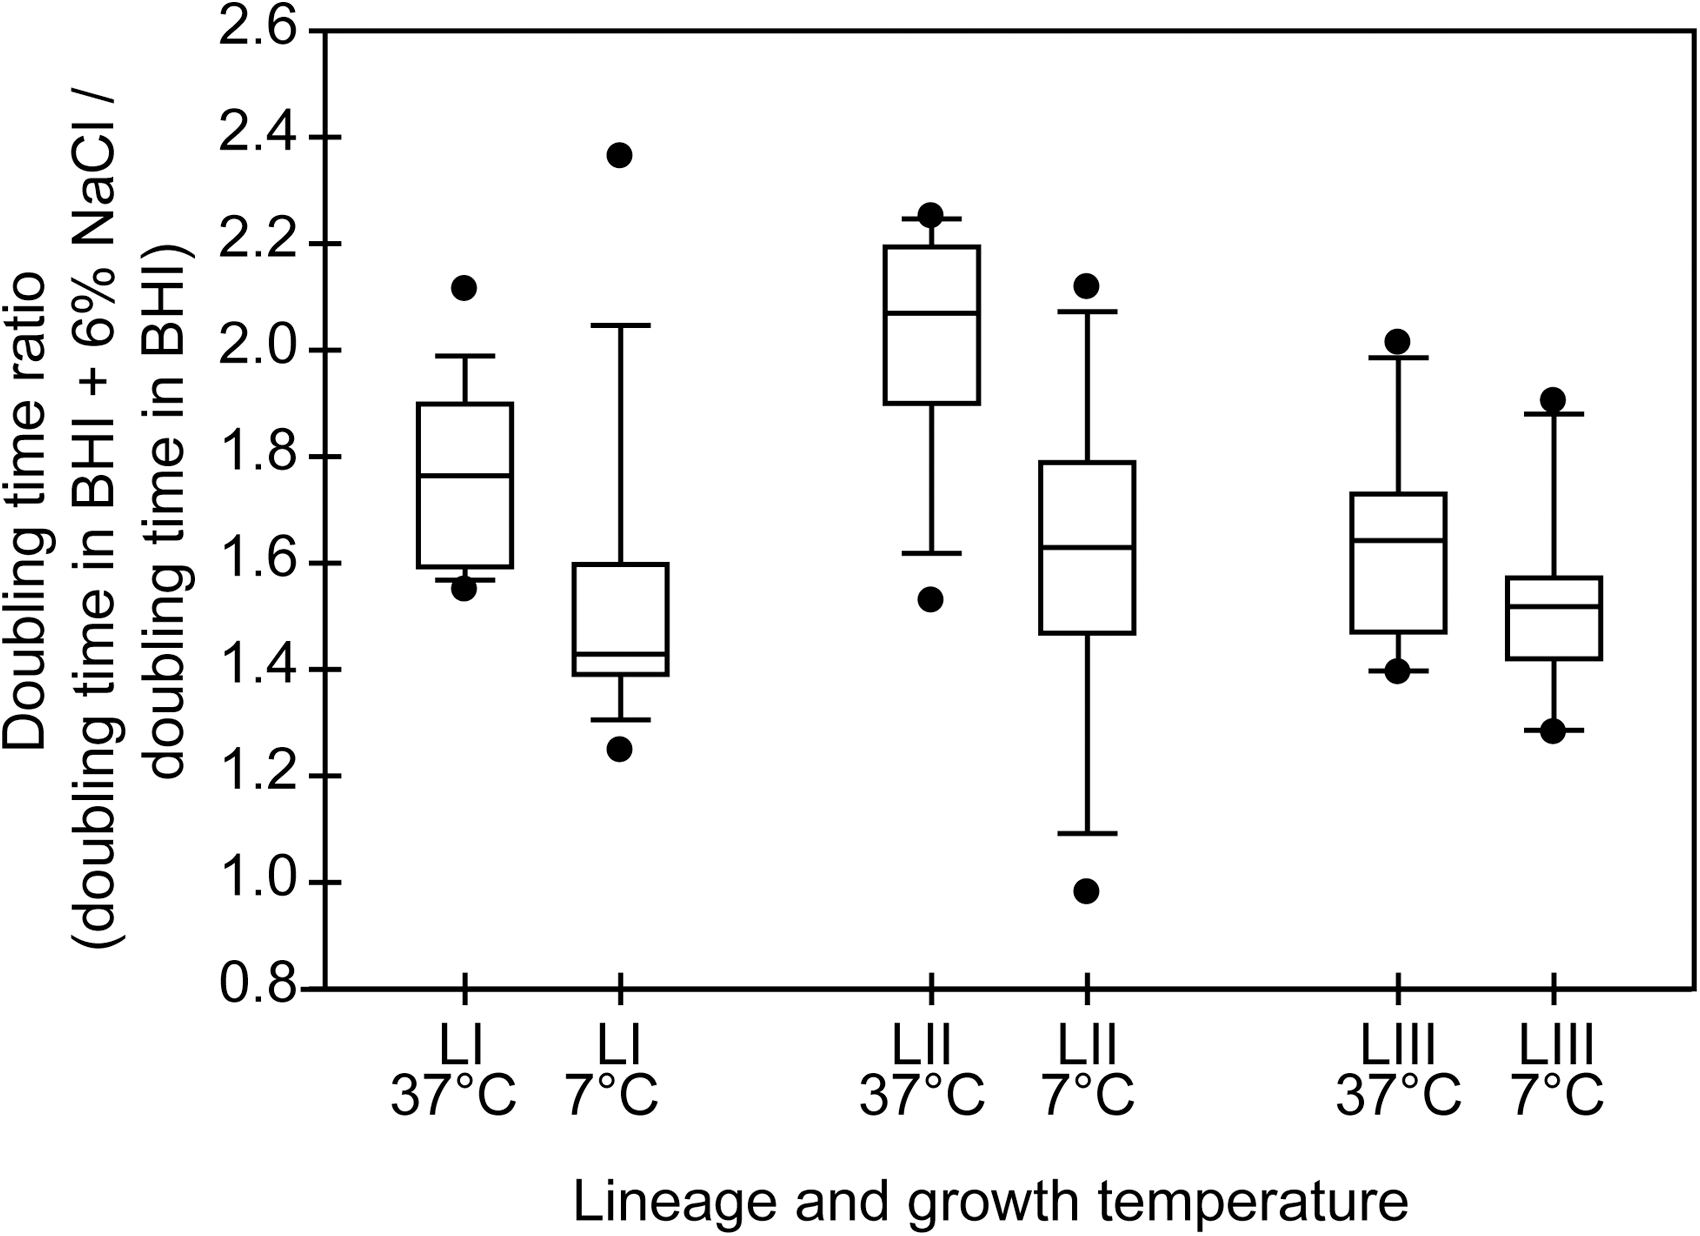
Boxplots of the distribution of doubling time ratios at 7°C and 37°C for strains representing each genetic lineage of L. monocytogenes. Doubling time ratios for each strain were calculated by dividing the doubling time in BHI + 6% NaCl by the doubling time in BHI. The horizontal bar indicates the median for each lineage; LI, lineage I; LII, lineage II; LIII, lineage III. Boxes represent the 25th to 75th percentile of the values; whiskers represent the 10th and 90th percentiles. Values outside the 10th to 90th percentiles are represented by filled circles.
Associations between genetic relatedness and salt stress phenotype
The MLST data show that L. monocytogenes strains comprise three clades: lineage I, lineage II, and lineage III (Fig. 4). The lineage III clade includes IIIA and IIIC strains, with IIIB strains, which have been designated lineage IV by others (Ward et al., 2008), on a separate branch. The MLST phylogenetic structure for these strains is similar to that described previously for L. monocytogenes (den Bakker et al., 2008; Ragon et al., 2008). To utilize all the nucleotide data rather than classifying strains into groups based on branching points, we used pairwise genetic distance as a measure of genetic similarity, which was compared to the pairwise differences for each growth parameter. Using the Mantel test, significant associations between genetic distance and phenotype differences were not found for growth in BHI at 37°C, BHI at 7°C, or BHI + 6% NaCl at 7°C. A significant association between genetic distance and phenotype differences was observed for growth in BHI + 6% NaCl at 37°C (growth rate p < 0.001, lag phase duration p = 0.005). These results indicate that strains that are closely related are more likely to have similar growth parameters in BHI + 6% NaCl at 37°C (Fig. 4) than strains that are genetically distant.
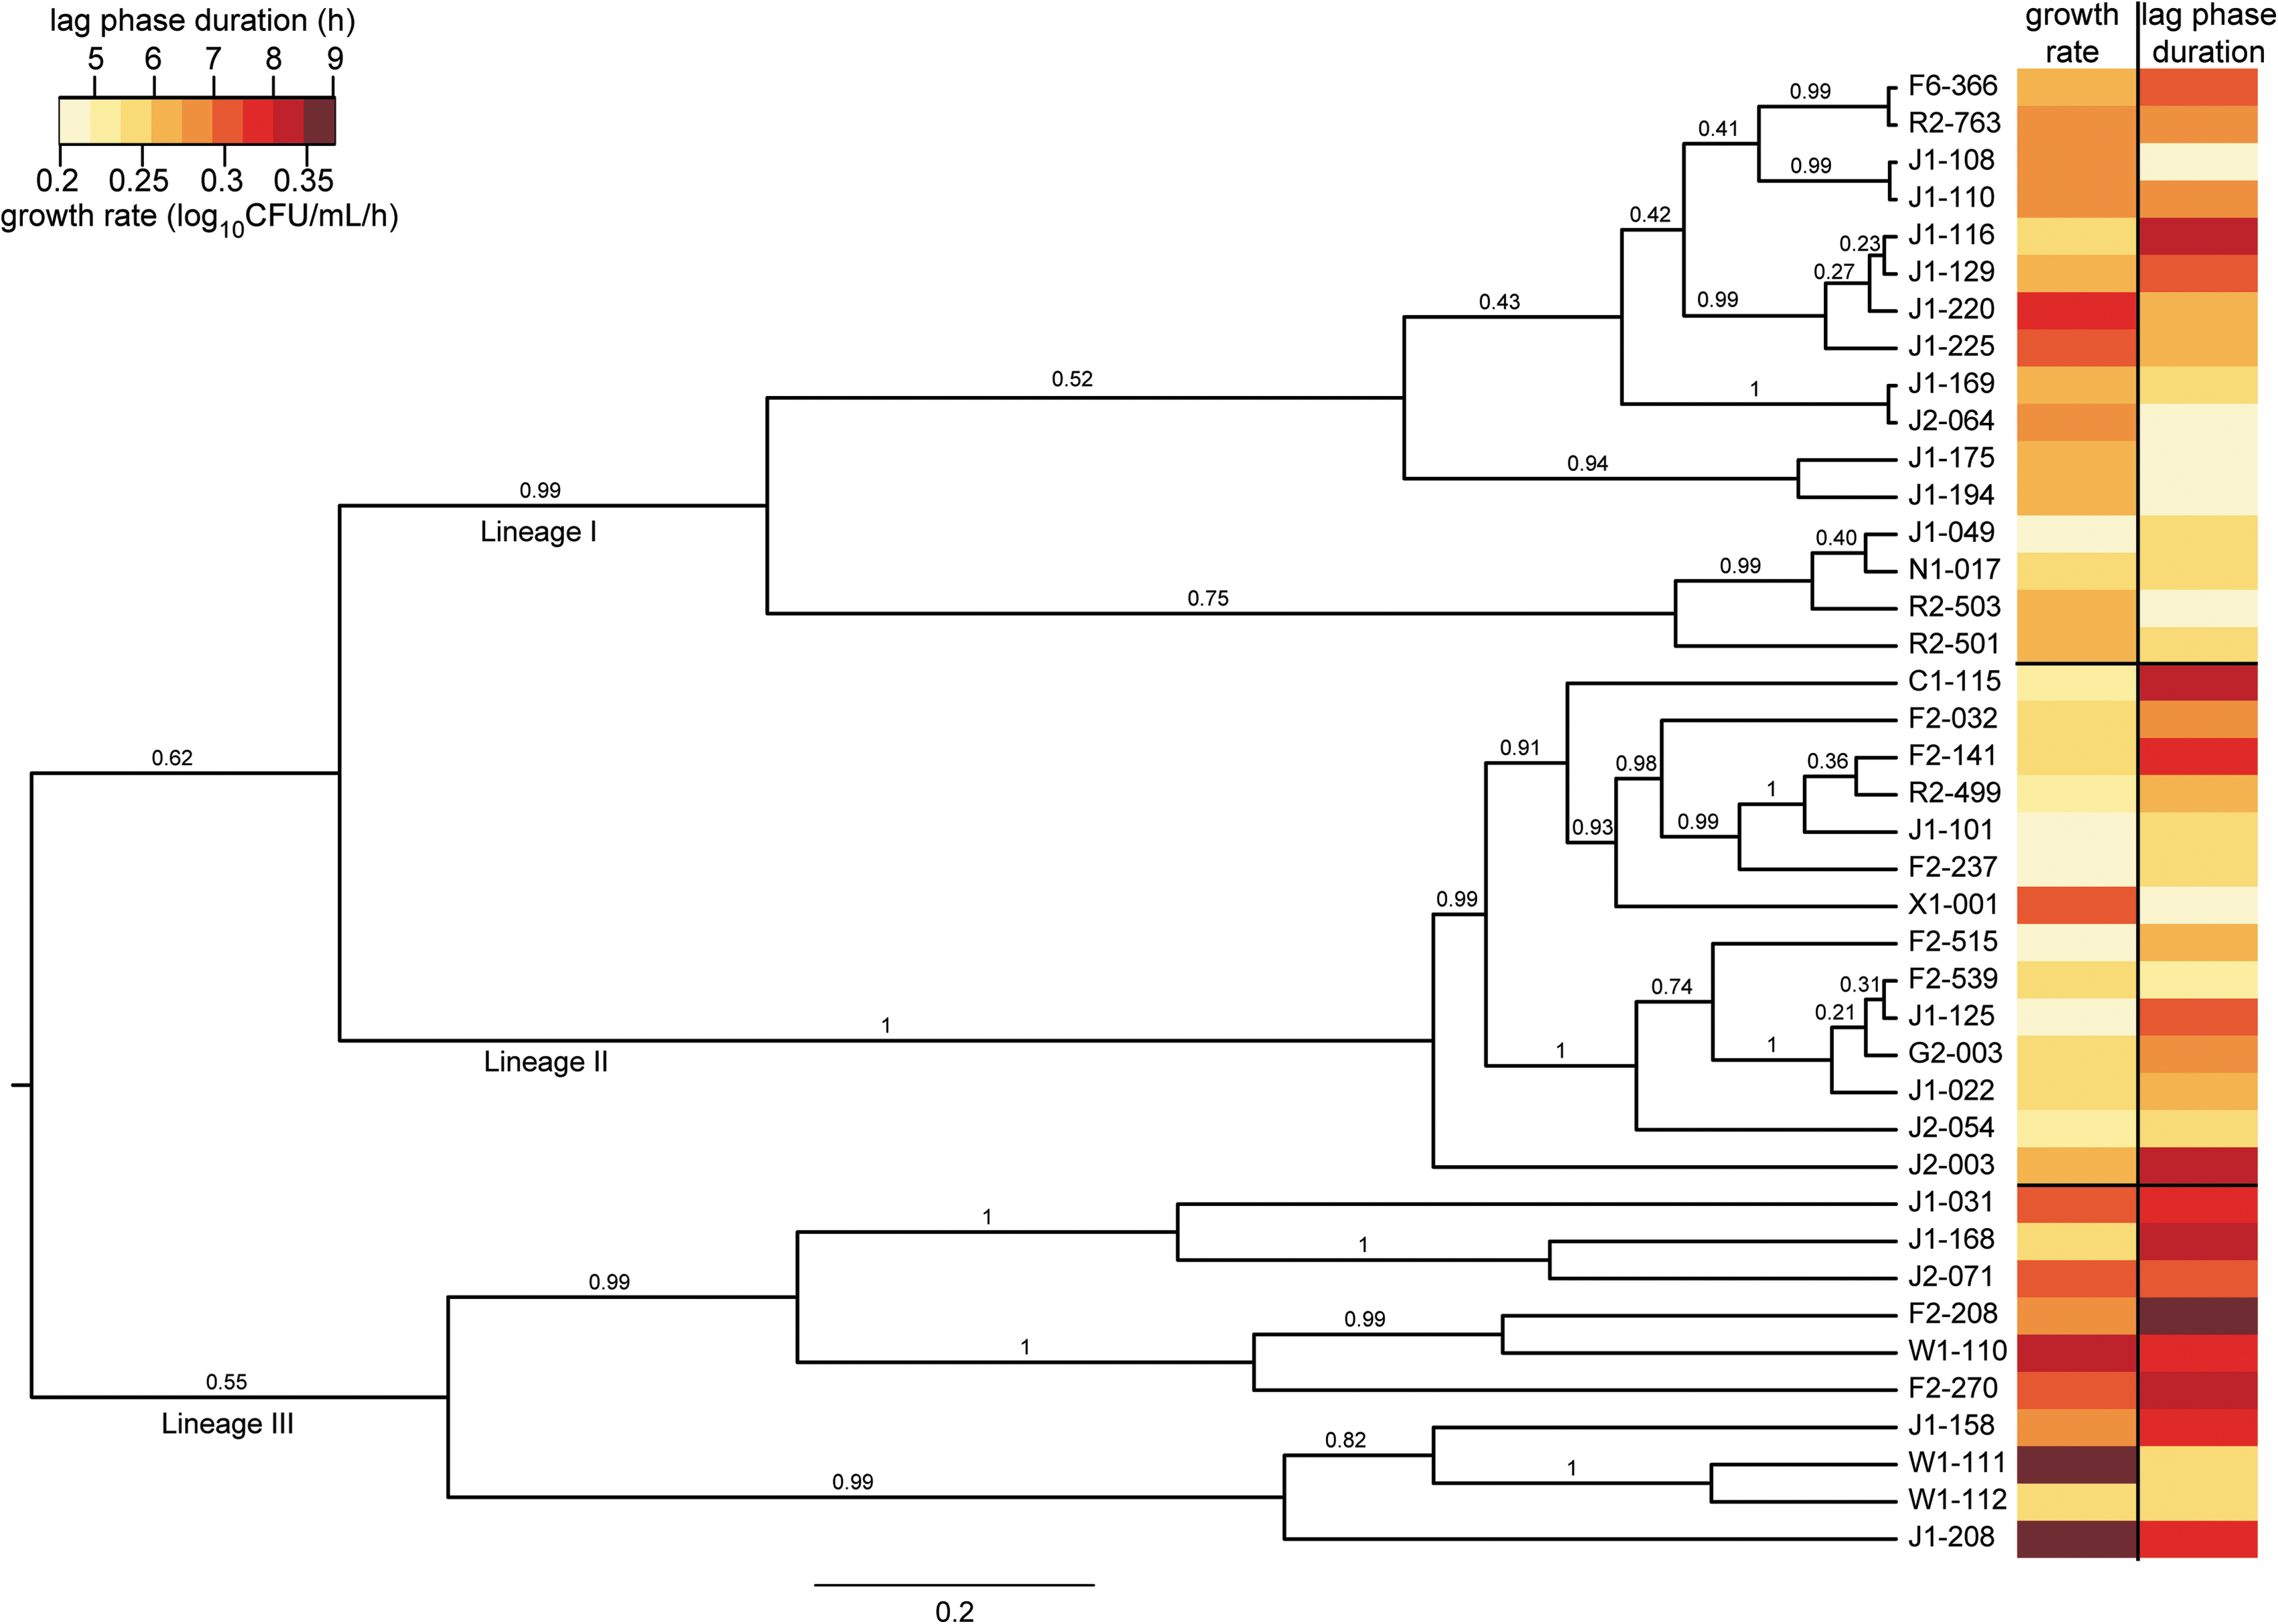
ClonalFrame phylogeny of L. monocytogenes strains used in this study. Values at each node of the dendrogram are the posterior probability values. The horizontal bar at the bottom represents the number of coalescent units. The heatmap on the right represents the growth rate and lag phase duration for each strain in BHI + 6% NaCl at 37°C, and highlights the significant association between genetic relatedness and growth phenotype under these conditions, as shown by similar parameter values for closely related strains.
Gene expression and molecular evolution of osmolyte uptake transporters
To explore potential differences underlying the average difference in growth rates among lineages in BHI + 6% NaCl at 37°C, qRT-PCR was used to measure transcript levels of four osmolyte uptake genes (opuCA, oppA, betL, and gbuA) for four strains with growth rates similar to the average for each lineage. We observed considerable variation in transcript levels among strains (Table 3), but significant differences between the lineages were not detected for any of the four genes tested. Transcript levels of the four genes did not correlate with growth rate in BHI + 6% NaCl at 37°C. Comparative evaluation of DNA sequence data yielded no evidence for positive selection in the sequences for the four osmolyte uptake genes (Table 4); however, both recombination detection methods found significant evidence for recombination for betL and opuCA (Table 4).
Log2 expression values for each strain are relative to replicate 1 of strain FSL J1-101.
Log likelihood estimate for model 1a.
Log likelihood estimate for model 2a.
Liklihood ratio test, calculated as 2[Ln L (M1a) – Ln L (M2a)].
As described by Posada and Crandall (1998).
p-Value for the PHI test for recombination.
Simulated p-values for the Geneconv test for recombination are based on 10,000 permutations and are corrected for multiple comparisons.
Number of fragments where evidence of recombination was detected, number of events are groups of fragments linked to the same 5′ or 3′ breakpoints and classified as a single recombination event.
G, Gamma distribution; HKY, Hasegawa-Kishino-Yano model; I, proportion of invariate sites; NA, not applicable; NS, not significant; PHI, pairwise homoplasy index; TrN, Tamura-Nei model.
Phylogenetic analyses of the DNA sequences for the individual osmolyte uptake genes generated topologies for each gene tree (Fig. 5) that appear to differ from that generated by the 10-gene MLST data (Fig. 4); however, except for betL, these differences did not receive enough bootstrap support (>70%) to be considered significant. DNA sequence data for betL yielded a polyphyletic lineage III (strains FSL J1-031 and FSL J2-071 group with lineage I instead of with the other lineage III strains) (Fig. 5A), thus differing significantly from the MLST-generated phylogeny. When the genetic distance for each osmolyte transporter gene was compared to the pairwise difference in transcript levels, we found a significant association between transcript levels and genetic relatedness for opuCA (p = 0.019) and oppA (p = 0.002) (Fig. 5B, D). While a statistical association between transcript levels and genetic similarity exists for these two osmolyte transporters, differences in transcript levels for these genes do not explain the observed differences in growth rate among the lineages.
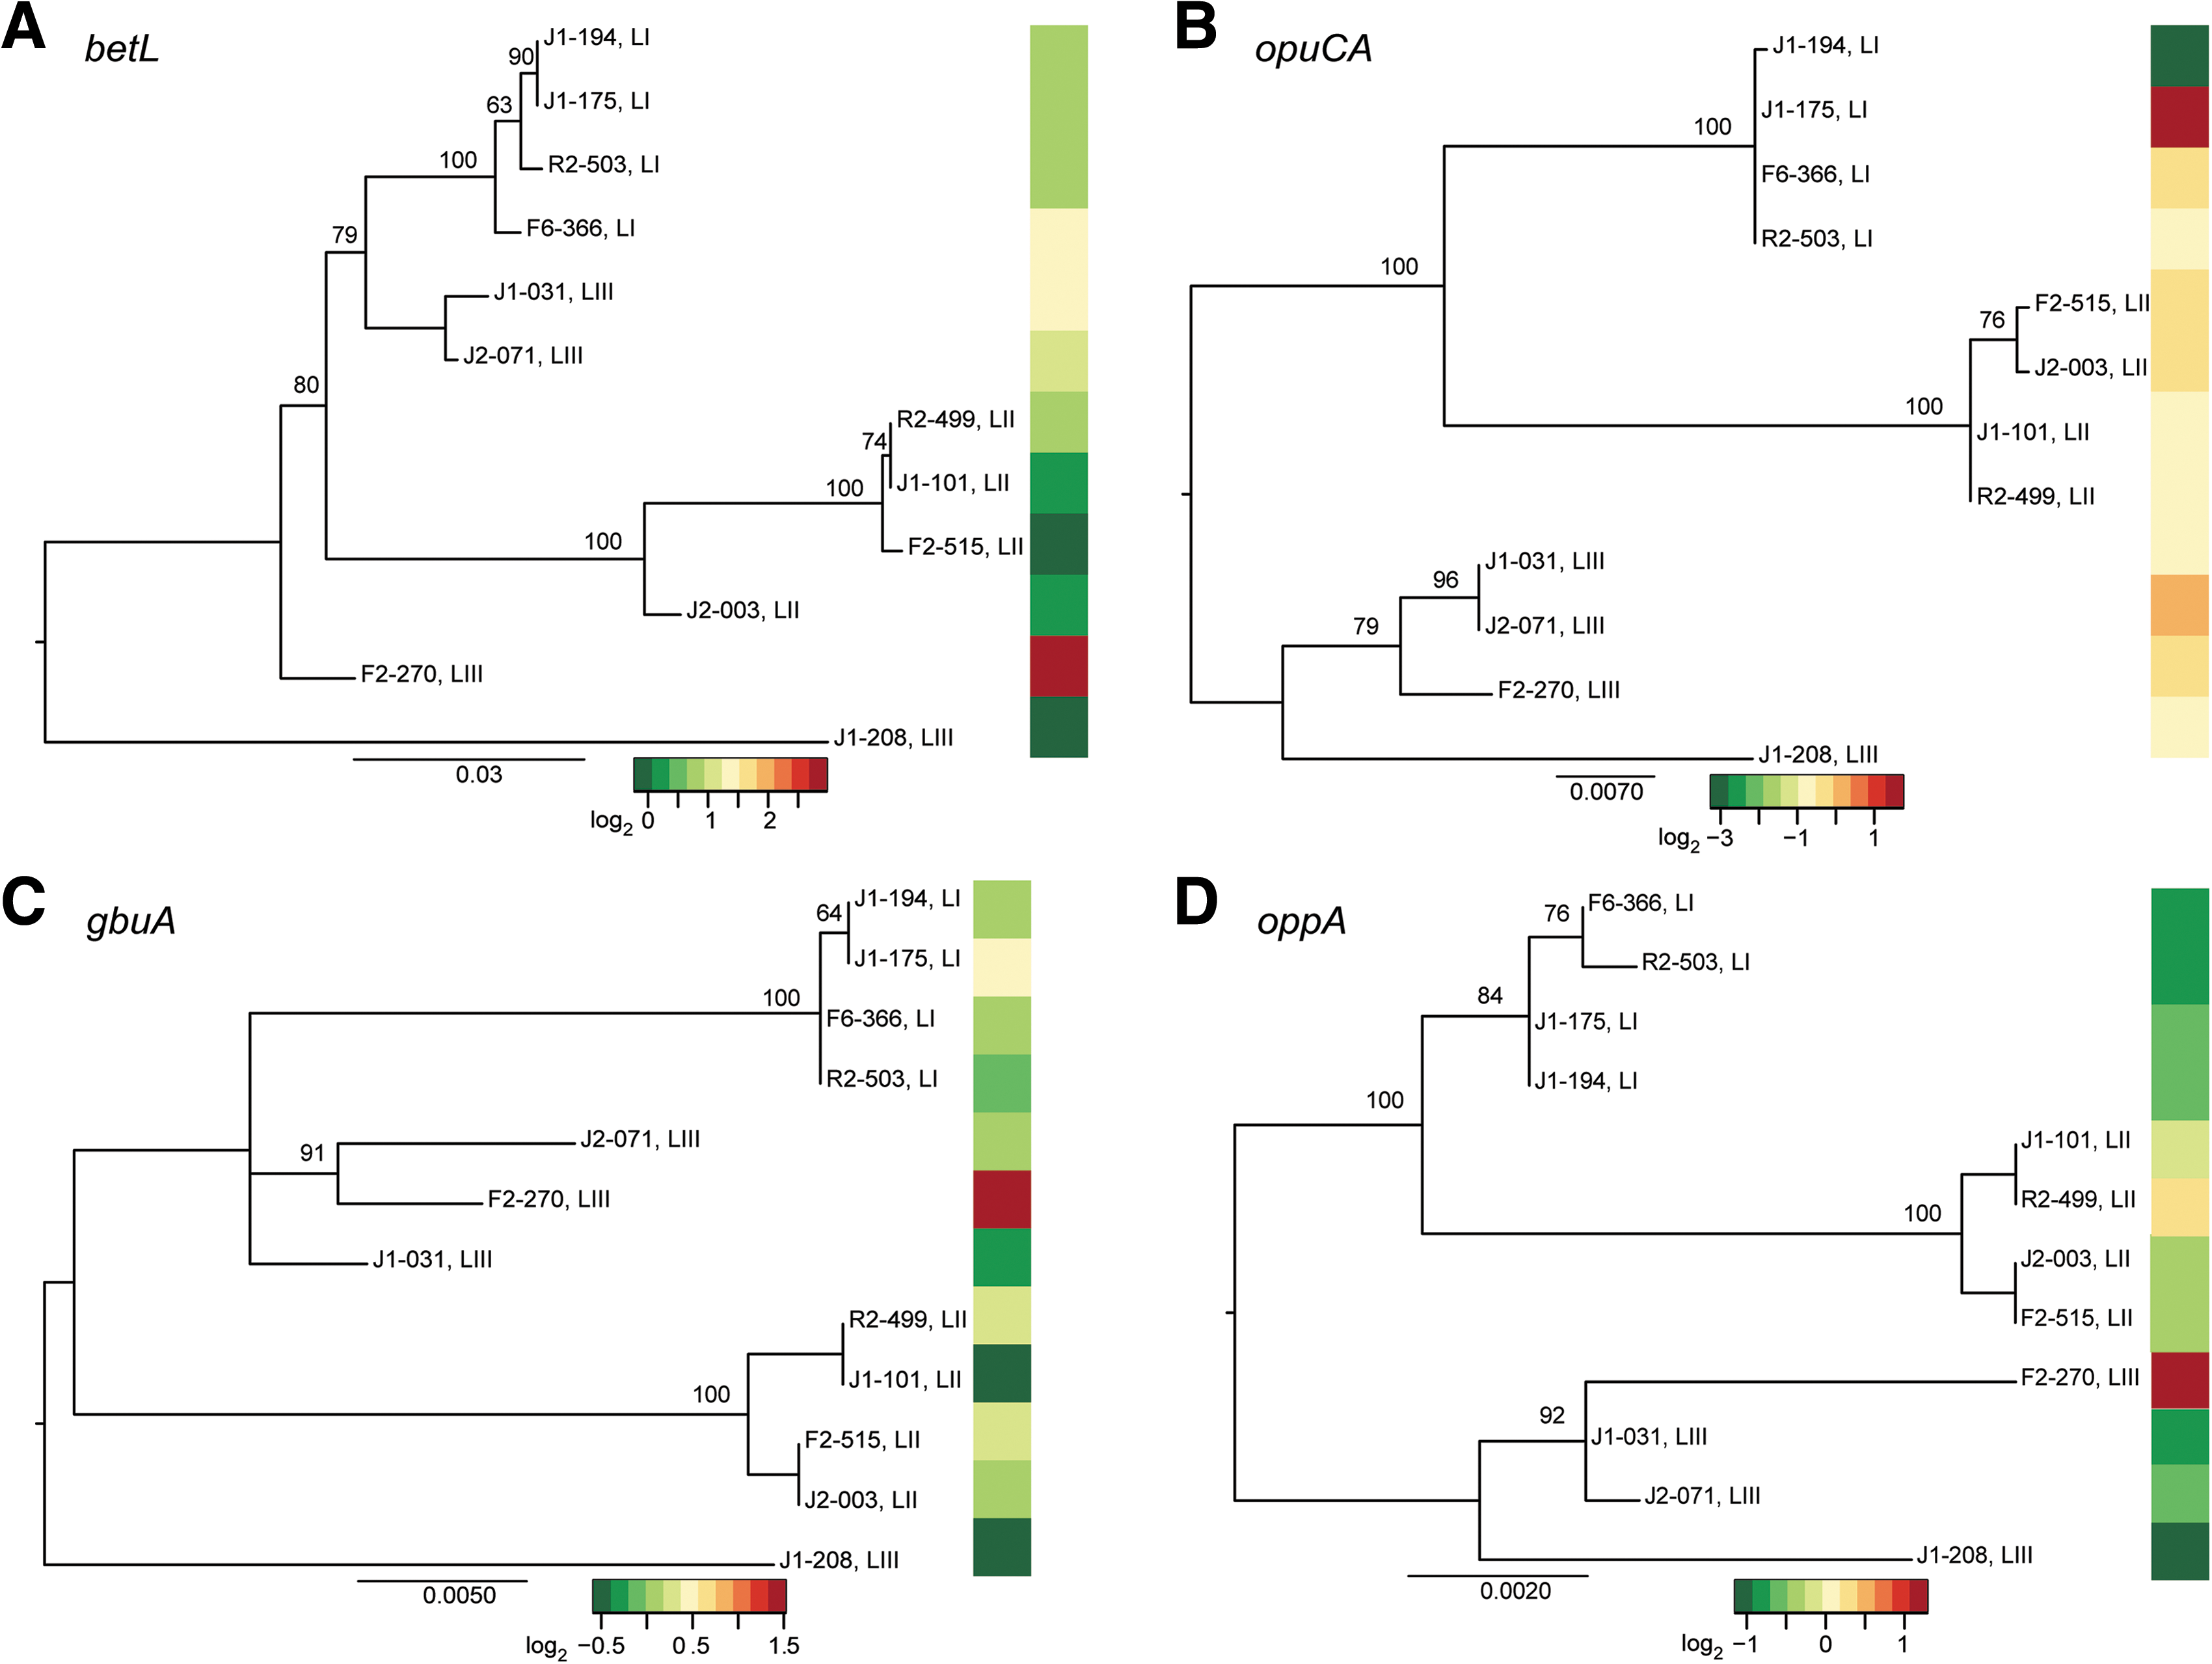
Maximum likelihood phylogenies for osmolyte uptake transporter genes (
Discussion
L. monocytogenes strains group into at least three phylogenetic lineages that vary in virulence potential and stress resistance (De Jesus and Whiting, 2003; Chen et al., 2006; Nightingale et al., 2006; Barmpalia-Davis et al., 2008). The relative abilities of certain L. monocytogenes subtypes to persist in specific ecological niches are likely to reflect phenotypic characteristics that are shared within a subtype (Boerlin and Piffaretti, 1991; Gray et al., 2004; Ward et al., 2004). To quantify variation in salt stress phenotypes among the major genetic L. monocytogenes lineages and to determine if salt stress phenotypes are associated with genetic relatedness, we measured the ability of strains to grow under salt stress at two different temperatures. While adaptation to salt stress at 7°C did not differ among the lineages, lineage I and II strains that were initially grown at 7°C appeared to transition to growth in a high-salt medium more effectively than strains that were initially grown at 37°C and then transferred to high-salt conditions at 37°C. Under salt stress at 37°C, lineage II strains had a significantly slower average growth rate than lineage I and III strains. This difference in growth was not related to differences in transcript levels for four osmolyte uptake transporters. Differences in growth parameters at 37°C in the high-salt medium were significantly associated with genetic relatedness of the strains.
Lineage-dependent differences in ability to grow under salt stress at 37°C
When analyzed by lineage, strains grown at 37°C differed in their abilities to adapt to exposure to a high-salt medium. Specifically, lineage II strains had an impaired ability to adapt to salt stress compared to both lineage I and lineage III strains. On average, lineage II strains grown to midexponential phase at 37°C and then exposed to 6% NaCl had 24% and 15% longer doubling times than lineage III and lineage I strains, respectively. Differences in growth rates among the lineages were not due to inherent differences in growth capabilities, as there were no differences in average growth rates at 37°C in BHI alone. As foodborne pathogens are subjected to osmotic stress in the host gastrointestinal tract, our data suggest that lineage II strains may be less effective at propagating under these conditions than lineage I and III strains.
It is well established that significant phenotypic variation exists among strains of L. monocytogenes, including ability to grow at different temperatures (Barbosa et al., 1994), or at different pH, a w, and temperatures (Begot et al., 1997), or to resist heat treatments (De Jesus and Whiting, 2003). Lineage-specific differences under host-related stresses have been observed; in one study, lineage II isolates had significantly higher inactivation rates in a dynamic gastric system than lineage I and III isolates (Barmpalia-Davis et al., 2008). Taken together with our data, these results suggest that lineage II strains are at a disadvantage under mammalian host-like stress conditions at 37°C compared to lineage I and lineage III strains.
While differences in phenotypic traits have been linked to lineage classification, variability in phenotype within a lineage may also be large (De Jesus and Whiting, 2003). Differing levels of genetic diversity can also exist within lineages (den Bakker et al., 2008). If phenotypic variability results from differences in gene content, or gene expression and regulation, closely related strains would be expected to have phenotypic similarities. Such relationships have been shown for the amphibian pathogen Batrachochytrium dendrobatidis, where genetic similarity is significantly associated with protein expression and sporangium morphology (Fisher et al., 2009). A similar relationship exists in Saccharomyces cerivisiae, where similarity in stress resistance among strains is related to genetic similarity of the strains (Kvitek et al., 2008). Our data show that differences in growth parameters under salt stress at 37°C are significantly associated with genetic relatedness of the strains, indicating that closely related strains have a similar salt stress phenotype at 37°C. Therefore, differences in ability to adapt to salt stress reflect the evolutionary history of the strains.
Differences in transcript levels of osmolyte uptake transporter genes do not account for growth differences under salt stress at 37°C among the lineages
Given the significant differences in growth at 37°C in the high-salt medium among the different lineages, we explored possible underlying molecular mechanisms that might contribute to the relative adaptation capabilities among the lineages. In L. monocytogenes, osmolyte uptake transporters are considered to be the main contributors to managing osmotic stress, with additional roles in cryotolerance and virulence (Sleator et al., 2003b). Specifically, the glycine betaine transporters BetL and Gbu as well as the carnitine transporter OpuC are used by L. monocytogenes to combat osmotic stress (Sleator et al., 2003b). The oligopeptide permease, Opp, as well as the Gbu and OpuC transporters are also involved in cryotolerance (Borezee et al., 2000; Sleator et al., 2003b). Conceivably, differences in expression (at the gene or protein level) and differences in uptake efficiency of these osmolyte uptake systems could contribute to the growth differences observed among lineages. While transcript levels for these four osmolyte uptake transporters varied across strains, we did not detect significant differences in gene expression among the lineages. While differences in transporter protein expression and activity have been observed between strains of L. monocytogenes (Dykes and Moorhead, 2000; Sleator et al., 2003a), our approach focused only on differences at the level of transcription. While we observed variation in transcript levels for the osmolyte transporter encoding genes, the differences in growth between the lineages could not be explained by differences in gene expression of these osmolyte uptake transporters. The faster growth rates of lineage I and III strains in high salt may be due to other factors, for example, differences in membrane fatty acid modifications or expression of surface proteins, two components of the salt stress response recently identified in Bacillus subtilis (Hahne et al., 2010).
While variation in transcript levels was significantly associated with genetic relatedness for two of the osmolyte uptake transporter genes (opuC and oppA), variation in gene expression was not related to sequence similarity for gbuA or betL. Interestingly, analysis of betL DNA sequences showed evidence of a number of recombination events, similar to results from analysis of some virulence-associated genes, such as inlA (den Bakker et al., 2008). We speculate that the lack of an association between transcript levels and nucleotide similarity for betL may be partially due to recombination. For example, recombination events can disrupt linkages between regulatory elements and gene sequences.
Growth at 7°C provides crossprotection to subsequent salt stress
We observed that the ability to adapt to salt stress at 7°C was similar across lineages, and that differences in growth parameters among the strains under these conditions were not associated with genotype. Nufer et al. also reported no correlation between growth at 4°C and REP and ERIC PCR genotypes of six L. monocytogenes strains (Nufer et al., 2007). Our results provide strong phenotypic evidence supporting a regulatory overlap between the L. monocytogenes responses to osmotic and to low temperature stresses. Proteins such as the glycine betaine transporter Gbu (Ko and Smith, 1999), the carnitine transporter OpuC (Fraser et al., 2000), the alternative sigma factor SigL (Raimann et al., 2009), and the cold-shock protein CspD (Schmid et al., 2009) are involved in the osmotic stress response, and are also important for growth of L. monocytogenes at low temperatures (Angelidis and Smith, 2003; Raimann et al., 2009; Schmid et al., 2009). Because of these known overlaps in stress response, exposure to low temperature may lead to crossprotection against subsequent osmotic stress. Our data demonstrate that growth at 7°C enhances the long-term adaptation to salt stress, as the increase in doubling time due to the shift to a high-salt medium was significantly smaller for lineage I and II strains at 7°C than at 37°C. The crossprotective effect of cold on salt tolerance was affected by the genetic background of the strains, as the increase in doubling time due to salt shift was similar at both 7°C and 37°C for lineage III strains. While no differences exist among lineages in the ability to adapt to salt stress at 7°C, growth at 7°C appears to provide some crossprotection to salt stress for lineage I and II strains. Consistent with our data, others have shown that the inoculum state (e.g., different stress exposures of the inoculum) can provide preadaptation to subsequent stress conditions that result in improved growth rates. For example, Tigantis et al. (2009) have found that L. monocytogenes grown at pH 6.0 showed increased growth rates under osmotic stress as compared to bacteria when grown at pH 7.2 before osmotic stress exposure, and others have shown that stationary-phase L. monocytogenes exhibit higher growth rates under temperature, pH, and osmotic stress than exponential-phase cells (Vialette et al., 2003). In addition to the well-documented effect of inoculum state on lag phase duration (Uyttendaele et al., 2004; Geornaras et al., 2006), a few initial studies have also shown an effect of inoculum state on L. monocytogenes growth rates, and further work is required to fully explore these events, including the impact of genetic background on preadaptation effects.
Conclusions
In a comparison of growth parameters among lineages of L. monocytogenes, we have shown that the ability of these lineages to adapt to salt stress is dependent on growth temperature before salt exposure. All three lineages had a similar ability to manage salt stress after growth at 7°C. However, when grown at 37°C, lineage II strains did not adapt to subsequent salt stress at 37°C as well as lineage I and III strains. Therefore, lineage I and III strains have an advantage under osmotic stress at host body temperature, which may contribute to successful survival and spread in the host. The significant association between growth rate under salt stress at 37°C and genetic relatedness supports the idea that the ability to adapt to salt stress is linked to evolutionary history of the strains. Ultimately, the approaches applied and observations generated from this study will provide a useful framework for identifying and elucidating novel molecular mechanisms that contribute to differences in osmotic stress response among L. monocytogenes strains.
Footnotes
Acknowledgments
The authors thank Catharine Gensel for assistance with DNA sequencing for MLST. The authors also thank Galeb Abu-Ali and Peter Bergholz for critical review of earlier versions of the article. This research was supported by USDA Special Research Grant 2005-34459-15625 and by NIH-NIAID R01 AI052151.
Disclosure Statement
No competing financial interests exist.