
Abstract
The objective of this longitudinal controlled trial was to determine the effect of systemic treatment with ceftiofur on antimicrobial susceptibility of fecal Escherichia coli isolates in dairy cows. Cows with metritis or interdigital necrobacillosis requiring systemic antimicrobial treatment were sequentially assigned to two treatment groups. The first group was treated with ceftiofur hydrochloride and the second with penicillin G procaine. Untreated healthy control cows were selected for sampling on the same schedule as treated cows. Fecal samples were collected on days 0, 2, 7, 14, 21, and 28. In total, 21983 E. coli isolates from 42 cows were analyzed for susceptibility to ampicillin, tetracycline, and ceftiofur using a hydrophobic grid membrane filter system to assess growth on agar containing selected antimicrobial drugs. Temporal changes in both the concentration of E. coli in feces and the susceptibility of E. coli to each drug were analyzed. A significant decrease in the concentration of fecal E. coli on days 2 and 7 post-treatment (but not thereafter) was detected in animals treated with ceftiofur. The proportion of all isolates (95% confidence interval in parentheses) showing reduced susceptibility at day 0 was 3.0% (2.5, 3.6) for ampicillin, 10.6% (9.7, 11.6) for tetracycline, and 4.8% (4.2, 5.6) for ceftiofur; 1.7% (1.3, 2.1) of isolates were resistant to ceftiofur based on growth at 8 μg/mL. Treatment did not have any significant effect on the proportion of isolates expressing reduced susceptibility to antibiotics with the exception of decreased tetracycline susceptibility in the ceftiofur-treated group on day 2. Although we found the potential for selection pressure by documenting the change in E. coli concentration after ceftiofur treatment, an increase in ceftiofur resistance was not found.
Introduction
T
Escherichia coli often is used as a model for changes in other bacterial species such as Salmonella because of similarities in their microbial physiology, frequently identical genetic determinants of resistance, and similar mechanisms of genetic dissemination (Lowrance et al., 2007). Several studies showed that the blaCMY-2 gene is responsible for cephalosporin resistance in both Salmonella and E. coli isolates (Donaldson et al., 2006; Frye and Fedorka-Cray, 2007; Daniels et al., 2009). It is also likely that many resistance genes can be exchanged within the family of Enterobacteriaceae (Neuwirth et al., 2001). For every Salmonella bacterium in the intestine of humans and animals there are thousands of E. coli, subject to the same antimicrobial selection and capable of carrying and spreading the same or similar genetic resistance elements (O'Brien, 2002).
Our objective was to scan large numbers of isolates to determine whether systemic ceftiofur or penicillin treatment of dairy cows under field conditions resulted in changes in antimicrobial susceptibility of fecal E. coli.
Materials and Methods
Study population and design
We enrolled cows from two New York State dairy herds in a longitudinal controlled trial. Herd sizes were 140 and 300 milking cows. The dominant breed was Holstein-Friesian; all other cows were Ayrshires. A herd survey filled out by the owners showed that antimicrobial usage practices for these herds were similar to those reported for conventional farms by Zwald et al. (2004). Ceftiofur was used on both farms before the study for typical purposes such as treatment of respiratory disease, metritis, retained placenta, and foot problems. Lactating cows with metritis or interdigital necrobacillosis as identified by the herd owner or veterinarian were enrolled sequentially in one of two treatment groups: ceftiofur or penicillin. The treatment for the first animal within each herd was selected at random. Healthy animals served as untreated controls and were paired with antibiotic-treated animals, alternating groups, and matching calving date and parity whenever possible.
Samples were collected from each animal at enrollment (day 0) and subsequently five times in a 4-week period. The target sampling days were 2, 7, 14, 21, and 28 days after enrollment. The study was conducted between July 2008 and July 2009.
Treatment protocol
Treatment for cows in the ceftiofur group consisted of a subcutaneous injection of 1 g of ceftiofur hydrochloride suspension (Excenel RTU; Pharmacia & Upjohn Co, Division of Pfizer Inc.) once per day for a total of 4 days. Cows enrolled in the penicillin group received 9 million IU of a penicillin G procaine suspension (PenOnePro, Vet One, MWI) intramuscularly once per day for a total of 4 days.
Sample collection and processing
Fecal samples were collected before treatment by the herd owner or veterinarian (day 0) and on days 2, 7, 14, 21, and 28 after enrollment by the veterinarian. Approximately 50 g of feces was collected directly from the rectum of each cow with a clean plastic sleeve. Samples were placed immediately into a sterile sample container and transported refrigerated to the laboratory to be processed on the day of collection.
Those administering treatments and collecting samples were not blinded to treatment group. Study personnel carrying out laboratory procedures were unaware of the assignment of animals.
Fifteen grams of fecal material from each sample was placed in a sterile Whirl-Pak filter bag (Nasco) and mixed with 40 mL of a sterile 0.9% saline. The sample was then mixed in a stomacher for 2 minutes. The filtrate was placed in a second sterile Whirl-Pak filter bag and processed for another 2 minutes. Five 1 mL replicates of the specimen were aseptically transferred from the filter pocket into 5 mL freezer vials prepared with 1 mL of glycerol (Fisher Scientific) and tryptose soy broth (Becton, Dickinson and Company) (1:1 vol/vol) and placed in a −80°C freezer for storage.
Production of hydrophobic grid membrane filter master grids
Hydrophobic grid membrane filter (HGMF) master grids were used to enumerate and replicate bacteria using a modification of a method described previously (Dunlop et al., 1998; Jordan et al., 2005). A master grid containing not >200 colonies was chosen to limit the probability of any one colony being derived from more than one bacterium (Jordan et al., 2005).
To generate a master grid, each frozen sample was thawed in a 30°C water bath. Fivefold serial dilutions were made in 0.1% peptone water containing 1% Tween 80 (Fisher Scientific). Approximately 1.5 mL of each diluted sample was filtered through a sterile HGMF grid (ISO-GRID®; QA Life Sciences) using an SF-1 Spreadfilter (Filtaflex).
HGMF grids were then aseptically transferred onto MacConkey agar (Northeast Laboratory Services) and incubated at 37°C for 18–24 hours to produce a master grid (Fig. 1).
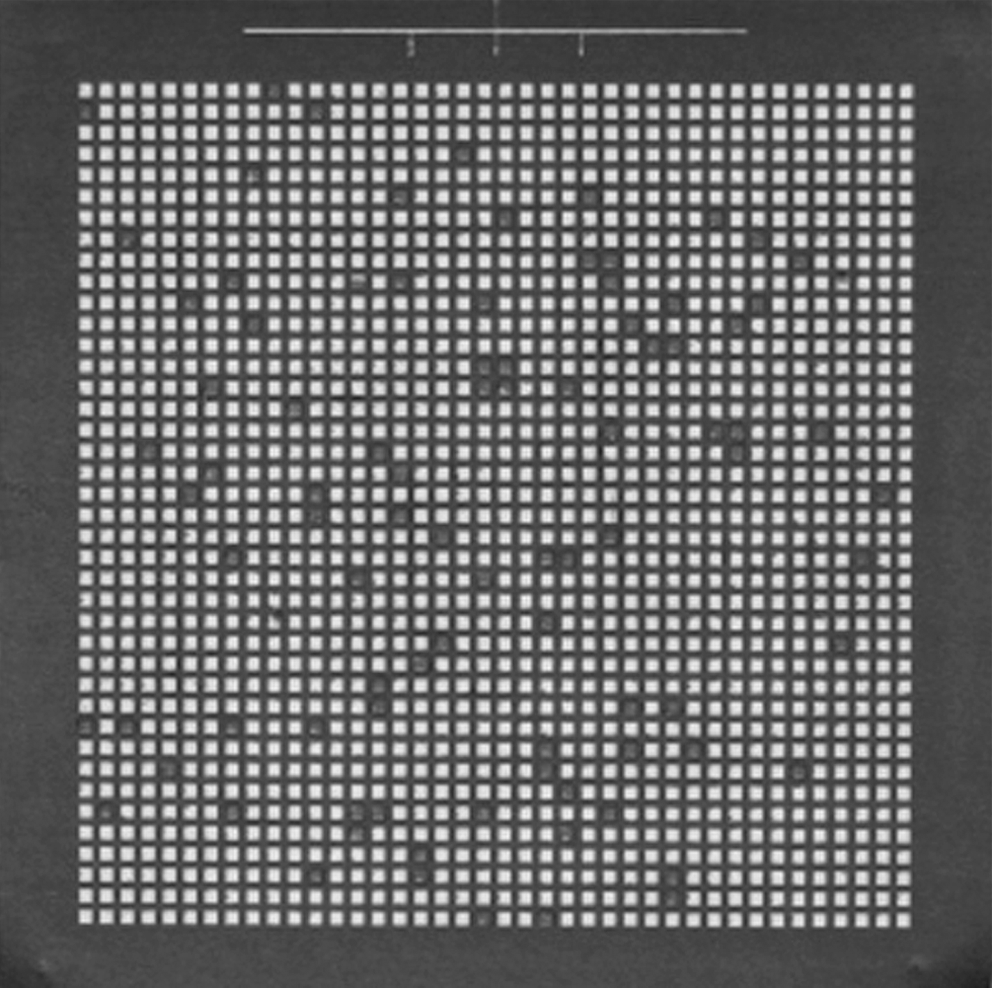
Typical master grid on MacConkey agar: Escherichia coli growth within grid cells on the hydrophobic grid membrane filter.
If the dilution process failed to produce a grid as described, another replicate of the sample was chosen and thawed, and more extended dilutions were carried out until the condition was met. In cases where the diluted sample yielded very low numbers of colonies, either the sample was enriched in GN broth (Hajna) or a dilution was incubated in the waterbath to increase the number of bacteria. Five-fold serial dilutions were then produced from the enriched sample.
Colony replication
Bacterial growth on the master grid was copied onto HGMF grids on a series of nine different agars using an RP-1 HGMF replicator (Filtaflex). In order of replication, these agars were Mueller-Hinton (MH) containing ceftiofur at three different concentrations—4, 8, and 16 μg/mL (Northeast Laboratory Services); chromogenic agar (BBL Chromagar Orientation; Becton, Dickinson and Company), MH agar containing ampicillin (16 μg/mL), tetracycline (8 μg/mL), sulfamethoxazole (256 or 512 μg/mL), or chloramphenicol (16 μg/mL) (Northeast Laboratory Services); and MH plates without an added antimicrobial agent (Northeast Laboratory Services) to ensure that the inoculum was transferred to all agar plates. All plates were incubated at 37°C for 18–24 hours. The chromogenic medium served as a control for E. coli (purple appearance).
Breakpoints were adopted from the Clinical and Laboratory Standards Institute (CLSI, 2008). The presence of the blaCMY-2 gene, which has been linked to ceftiofur resistance in Salmonella isolates, is strongly associated with a minimal inhibitory concentration of 8 μg/mL (Alcaine et al., 2005).
The concentration of sulfamethoxazole was switched from 256 to 512 μg/mL after the beginning of the study; information for this antimicrobial is therefore incomplete and was excluded.
Quality control
Identity of E. coli was confirmed for a subset of typical purple-colored isolates on chromogenic agar either in the Animal Health Diagnostic Center, Cornell University College of Veterinary Medicine, or by the Sulfide Indole Motility tube test. To ensure quality of the filter system, two E. coli isolates were chosen as positive and negative controls. These were cultured, processed, and replicated as described for replicate samples from study animals. The isolate serving as negative control (ATCC 25922) was confirmed to be susceptible to all study antimicrobials using the Sensititre Automated Microbiology System's A80 Panel (TREK Diagnostic Systems Inc.) in the Animal Health Diagnostic Center. The positive control, originating from a previous study, was characterized as multidrug resistant by the same method and as having the blaCMY-2 gene by polymerase chain reaction. For quality control of the plates and growth conditions, both isolates were streaked onto the side of the antimicrobial plates, outside the grid zone, for at least two sample days per cow.
Imaging and analysis of colony growth
Digital pictures of HGMF filters on agar were taken with a camera (Canon Power Shot SX110 IS) using remote picture software to enhance quality (PSRemote Version 1.6.4; Breeze Systems Limited). Customized software for image analysis (HGMFRES, NSW Department of Primary Industries) was then used to detect bacterial growth and identify the grid cell address (row and column position) of each colony as described previously (Jordan et al., 2005). A third software (HGMF Image Dr, NSW Department of Primary Industries) was used to exclude all colonies on the chromogenic agar not showing the typical E. coli color reaction.
Statistical analysis
Data were analyzed using SAS ver. 9.1 (SAS Institute Inc.). The distribution of parity and days in milk (DIM) among treatment groups was analyzed using Kruskal–Wallis tests. The pairwise associations of reduced susceptibility (RS) to tetracycline, ampicillin, and ceftiofur were analyzed at the isolate-level using chi-squared tests and at the cow-level using Spearman's rank correlation. Estimation of E. coli concentrations in fecal samples was achieved by applying the following formula:
where n is the count of isolates on the control grids, dil is the number of five-fold dilutions to reach the solution providing ∼50–150 isolates per grid, and the other values represent volumes transferred in the various steps of the procedure. In the case of enriched samples, dilution number was set to 0. Repeated measures analysis of variance (ANOVA; PROC MIXED) was used to analyze the treatment group effect on the log10 concentration over time. Cow was treated as a subject effect and a first-order autoregressive covariance structure was specified. Sample day (0, 2, 7, 14, 21, and 28) was included in the model as a fixed effect. The treatment-by-day interaction term was tested to determine whether changes in concentration over time depended on treatment group. Pairwise differences between treatment–day combinations were tested using Bonferroni-corrected p-values. Assessment of the normality of model residuals and plots of residual values against predicted values were used to evaluate model assumptions and were considered acceptable for this model.
Treatment group effects on reduced antimicrobial susceptibility were analyzed by first calculating the proportion of isolates with growth on the applicable antimicrobial plate among those grid cells with growth on both the MH and chromogenic agar control plates. This was done for each cow–sample day combination. For each combination of antimicrobial and drug-concentration, the change from the pretreatment measurement in proportion RS was calculated within cow for each post-treatment day. The data were analyzed initially using repeated measure ANOVA as described above, but model assumptions were not met. Therefore Kruskal–Wallis tests were used to compare treatment groups on each sample day. The effect was also evaluated by calculating the maximum change from baseline for each drug for each cow. The effects of treatment group, DIM at enrollment, lactation group (1, 2, or ≥3), and breed on maximum change were evaluated using Kruskal–Wallis tests.
Results
Of 44 animals enrolled, 2 were excluded because of sale or treatment changes (Table 1). The animals retained in the study included 32 Holstein-Friesians and 10 Ayrshires. All except two cows were enrolled within 14 days after calving. None of the cows received systemic antimicrobial treatment directly before enrollment, but one animal started in the study 1 week after dry treatment. One cow received ceftiofur for 6 days; another cow was treated with oxytetracycline starting 8 days after treatment with ceftiofur was completed. These were not excluded from the analysis.
A total of 240 individual fecal samples and 21983 E. coli isolates were included in the statistical analysis. The distribution of isolates between the treatment groups was 7,237, 8,222, and 6,524 for ceftiofur, control, and penicillin, respectively, and there was approximately even distribution of isolates across sample days. There were no significant differences in DIM or lactation number between treatment groups (p > 0.15). The median and mean true sample intervals are displayed in Table 2. The median number of isolates from each sample was 82 and ranged from 21 to 238. Quality control measures for laboratory outcomes were all consistent with the expected results except that a concentration problem was detected with some chloramphenicol plates, which lead us to exclude those data from the analysis.
Effect of antimicrobial treatment on E. coli concentration
Information about dilution was missing for eight samples and calculations were therefore based on 232 samples. A significant effect of ceftiofur treatment on E. coli concentration in the feces as estimated by dilution number was detected. The repeated measure ANOVA treatment-by-day interaction was significant (p < 0.0001). Based on pairwise comparisons, this effect was due to a significant decrease in concentration for samples collected on days 2 and 7 from cows in the ceftiofur group, but we also noted a moderate increase in estimated cfu on day 7 in the penicillin group (Fig. 2). Because of arbitrary assignment of a dilution of 0 to 15 samples requiring enrichment, this analysis was also checked using a nonparametric rank-based method. This confirmed significant differences among treatment groups on day 2 and 7. Ten of these 15 were from ceftiofur-treated cows on days 2, 7, and 14.
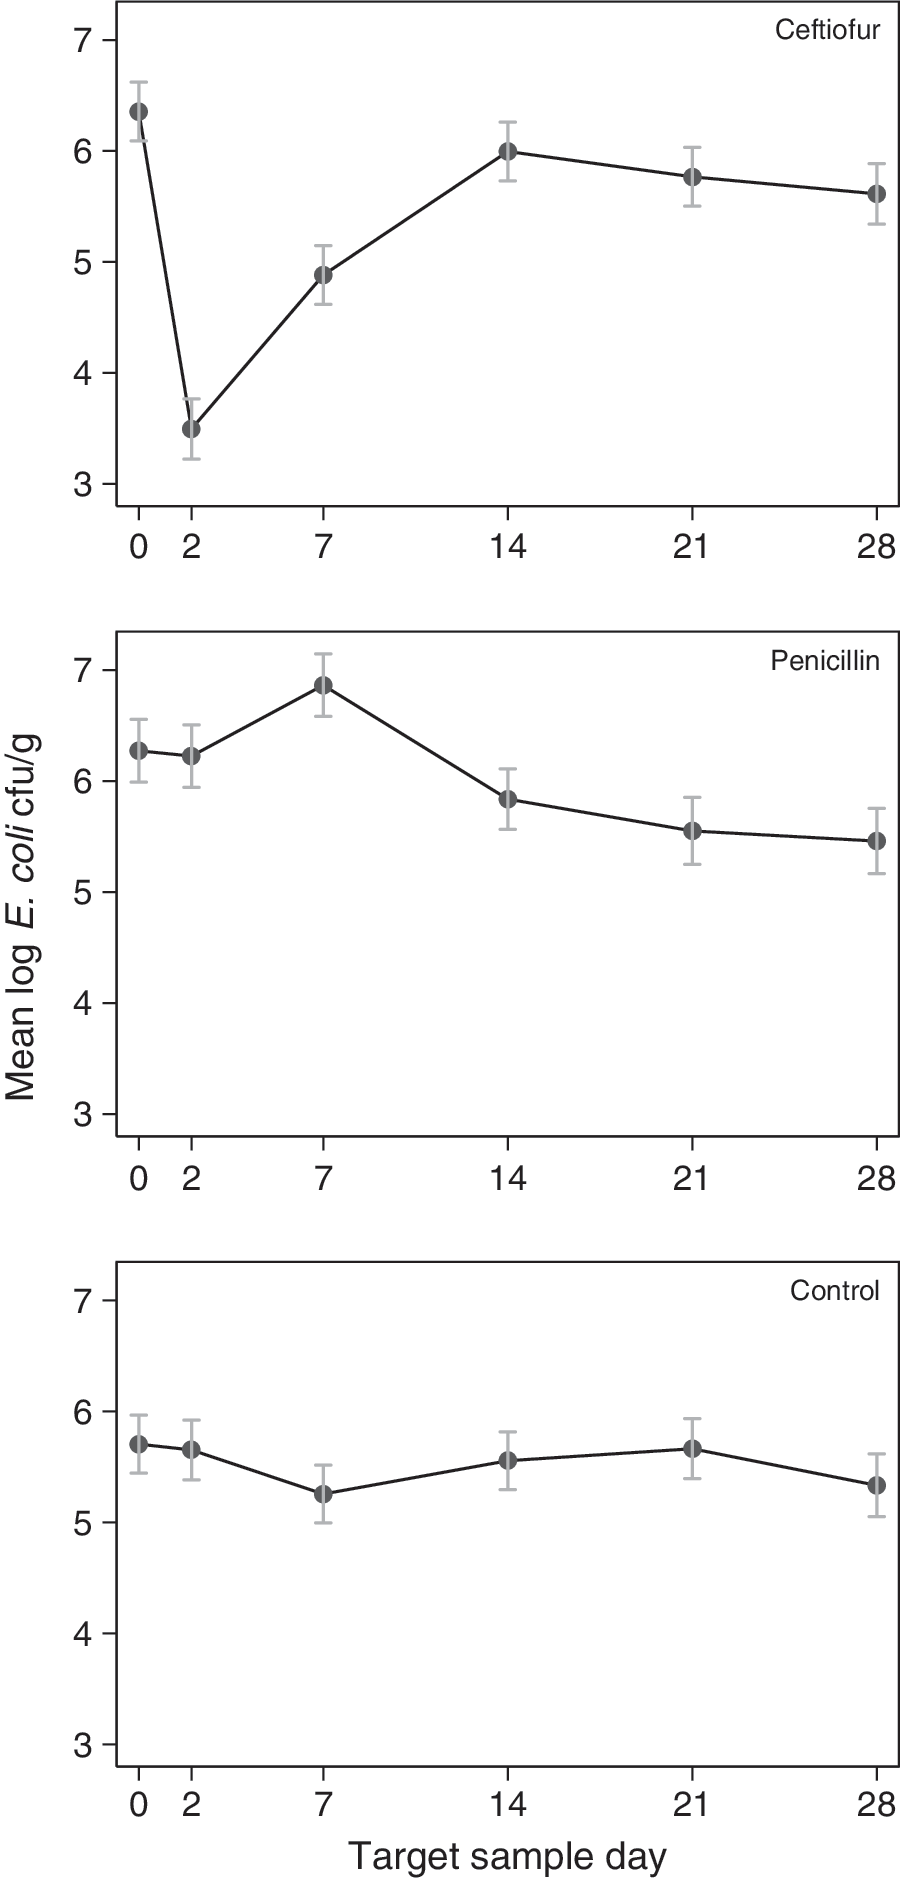
Effect of treating dairy cows with ceftiofur as compared to treatment with penicillin or no treatment (control) on the mean concentration of fecal Escherichia coli concentration (cfu/g) over time. Data obtained as predictions from linear mixed models, with error bars representing ∼95% confidence interval for the mean effects.
Prevalence of isolates with RS to antimicrobials
The percentages (95% confidence intervals in parentheses) of RS isolates at day of enrollment were 3.0% (2.5, 3.6) for ampicillin, 10.6% (9.7, 11.6) for tetracycline, and 4.8% (4.2, 5.6) for 4 μg/mL ceftiofur (cef 4); 1.7% (1.3, 2.1) showed ceftiofur resistance with growth at 8 μg/mL ceftiofur (cef8) and 0.7% (0.4, 1.0) for 16 μg/mL ceftiofur (cef16). Growth on two or more antimicrobial plates was found for 1.5% (1.1, 1.9) of isolates. Differences in percentage of growth between herds at enrollment were significant for tetracycline, cef4, and cef8 as listed in Table 3. For all sample dates combined, of the 21983 E. coli isolates, 1.8% (1.6, 1.9), 12.6% (12.2, 13.1), 4.0% (3.7, 4.2), 0.9% (0.8, 1.0), and 0.3% (0.2, 0.4) exhibited growth on ampicillin, tetracycline, cef4, cef8, and cef16, respectively. Growth on two or more plates was found for 1.8% (1.6, 1.9) of isolates and the percentage of isolates growing on at least one of the antimicrobial agar plates was 16.9% (16.4, 17.4).
p-Values are calculated for differences between farm A and B. p-values test for the hypothesis that percentage of reduced susceptible isolates from Farm A ≠Farm B for each antimicrobial.
Isolates showing RS or resistance to ceftiofur were significantly more likely to show RS to ampicillin or tetracycline (p < 0.0001). Isolates growing on cef16 were significantly more likely to also grow on cef8 or cef4 (relative risk (RR) 125.5 and 19.8, respectively) and the same was true for isolates growing on cef8 to also grow on cef4 (RR 17.6). Isolates growing on tetracycline plates were significantly more likely to also grow on ampicillin (RR 3.3) and the reverse situation had an even more pronounced effect (RR 4.6). RS or resistant ceftiofur isolates were more likely to show RS to ampicillin (RR 2.6), whereas there was a weaker association with tetracycline RS (RR 1.4). All RR had a p-value <0.0001 in isolate-level analyses.
Effect of antimicrobial treatment on susceptibility of E. coli
The Kruskal–Wallis test for individual treatment days was significant only for the change in tetracycline susceptibility on day 2 (p-value = 0.01) with the ceftiofur-treated group having the largest increase from baseline, penicillin-treated cows intermediate and the control group the lowest. The change in the proportion isolates growing on cef16 followed a similar pattern, though less significant (p-value = 0.1) because of increases from day 0 to 2 in three cows in the ceftiofur group. The proportion growth at a concentration of 16 μg/mL ceftiofur for these three cows increased from 2% to 8%, 0% to 14%, and 0% to 6%, respectively, and were 0% on all sampling days thereafter. There were no significant differences in maximum change from baseline among treatment groups (p ≥ 0.15). Additionally, none of DIM at enrollment (0–7, with >7 set equal to 7), lactation group (1, 2, 3, or greater), or herd had a significant effect on the maximum change from baseline (≥0.19).
No significant changes were found in the susceptibility of isolates from untreated control cows that were enrolled paired with treated cows and sampled on the same schedule.
Individual cow and herd effect
Cow-level average percentages of RS and resistance for each antimicrobial drug are displayed in Figure 3. The proportion of isolates showing RS was highly variable among cows, with a few cows yielding a high percentage of RS isolates across multiple sampling days. In cow-level analyses, parity, DIM, and breed did not have statistically significant effects on maximum change in susceptibility of E. coli isolates (p > 0.05).
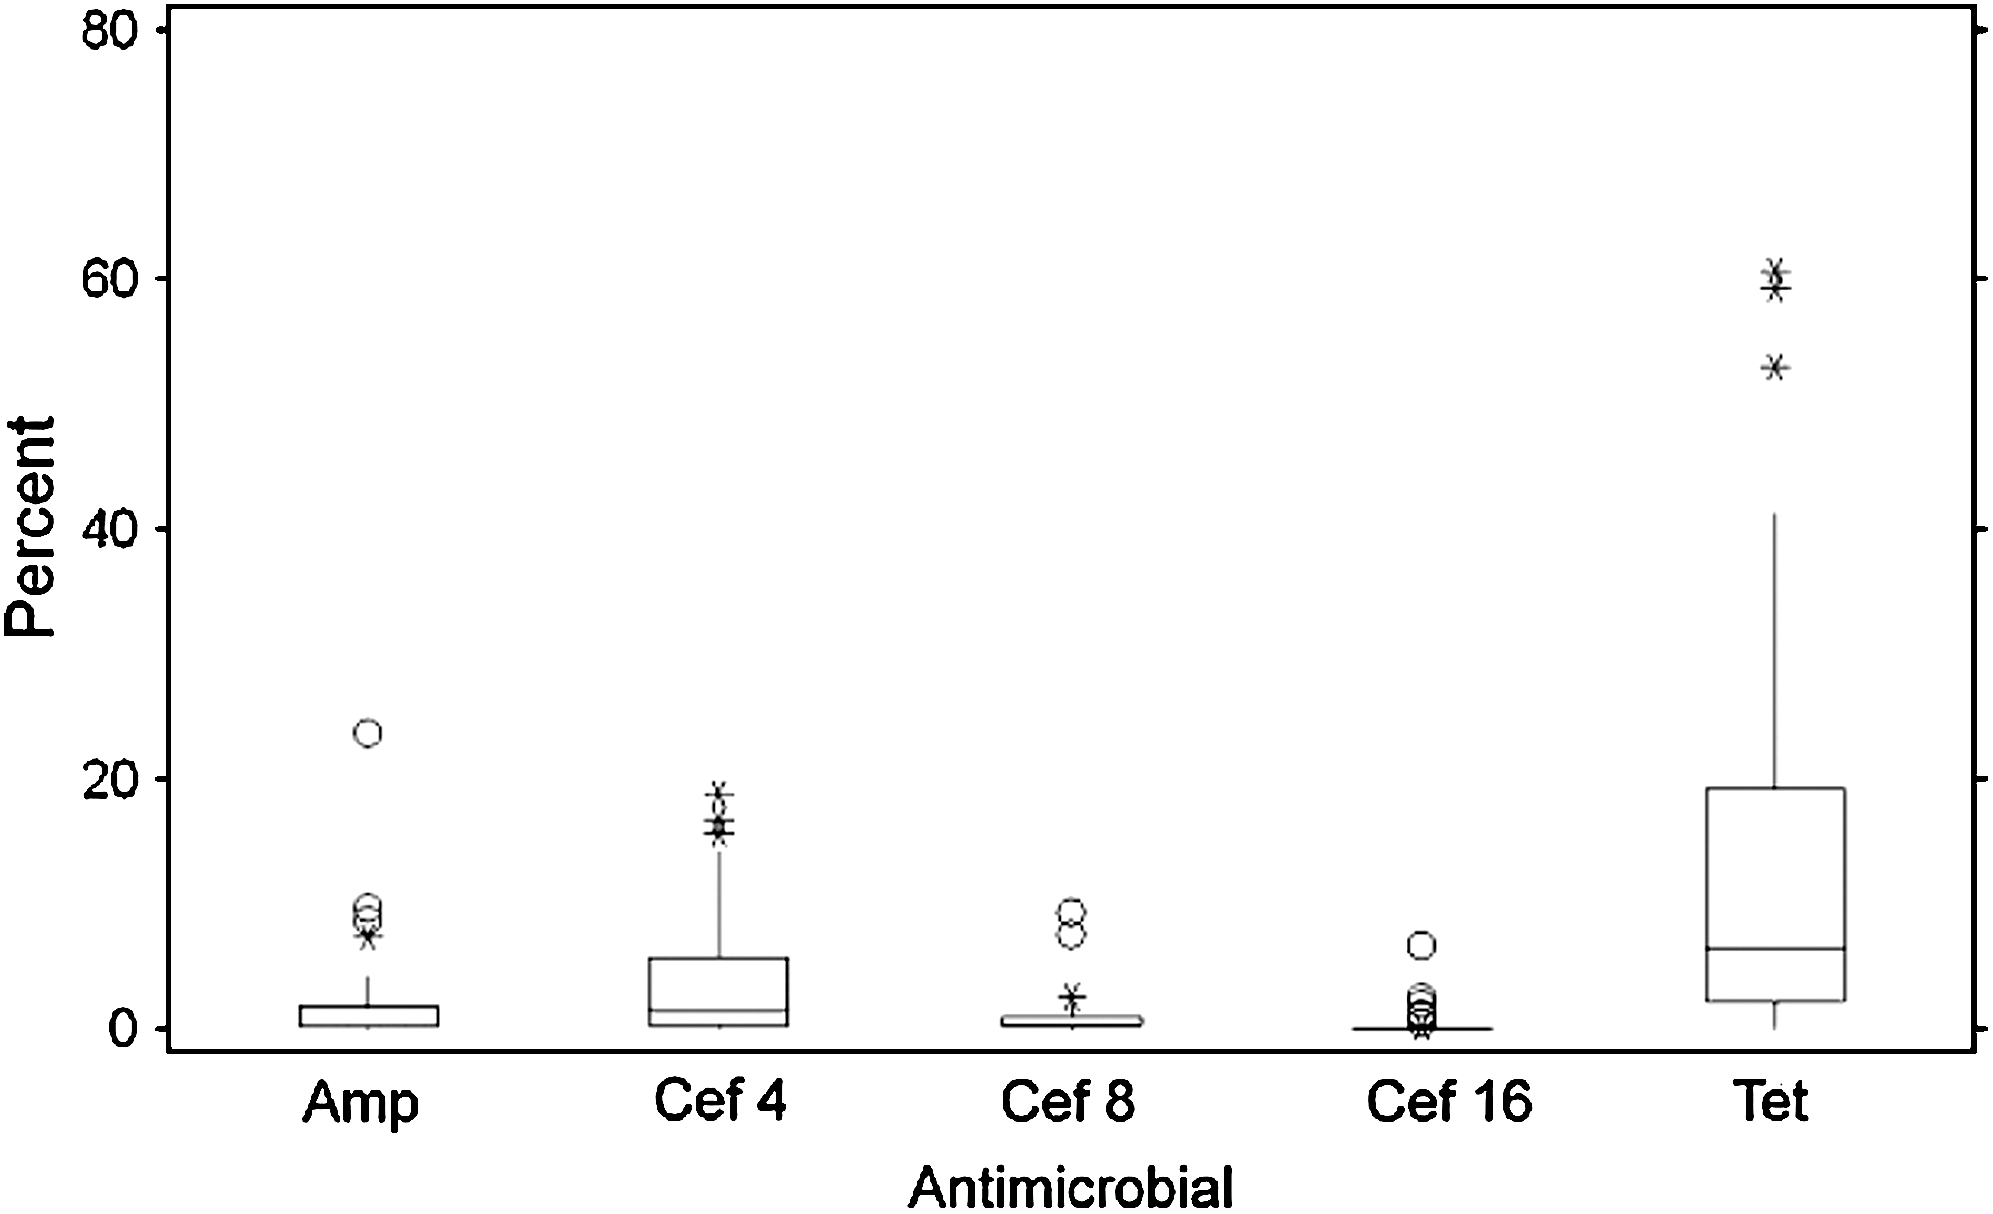
Box and whiskers plots of the cow-level percentages of Escherichia coli isolates growing on plates containing antimicrobial agents (n = 42 cows). Amp, ampicillin (16 μg/mL); Cef4, ceftiofur (4 μg/mL); Cef8, ceftiofur (8 μg/mL); Cef16, ceftiofur (16 μg/mL); Tet, tetracycline (8 μg/mL).
Discussion
The reduction in the concentration of E. coli in fecal samples during systemic treatment with ceftiofur found in day 2 and 7 samples is consistent with previous reports (Singer et al., 2008; Daniels et al., 2009) and signifies a very large selection pressure induced by the presence of the drug.
The frequency of isolates with RS found in our study population was equal to or less than the percentage of resistant E. coli isolated from dairy herds using conventional production methods in the United States previously reported by DeFrancesco et al. (2004), Sato et al. (2005), and Lundin et al. (2008). However, the observation that certain cows shed much higher levels of reduced susceptible E. coli isolates warrants further investigation to see if this is a permanent or transient biological effect.
We did not find a significant change in ceftiofur susceptibility among E. coli isolates during or after treatment with ceftiofur. This may be due to several factors. First, the emergence and spread of resistance under selection pressure might be such a rare event that even our study design, which targeted a large number of isolates per sample and used repeated sampling as well as control animals, was unable to detect. This would be consistent with Tragesser et al. (2006) finding a herd-level but not an individual-cow effect in a study investigating ceftiofur use and isolation of E. coli with RS to ceftriaxone. Second, the number of ceftiofur-resistant E. coli in the population before treatment might determine the amount of change observed after treatment. Lowrance et al. (2007) reported a transient increase in the population of ceftiofur-resistant isolates in a cohort study of feedlot cattle treated with ceftiofur crystalline-free acid. Systemic treatment with ceftiofur may allow E. coli isolates already in possession of resistance genes to temporarily dominate the intestinal flora while proportionally killing larger numbers of susceptible strains. Although the proportion of E. coli with RS to ceftiofur did not increase significantly in our study during or after treatment, the percentage of isolates with resistance to ceftiofur (16 μg/mL) tended to be higher in day 2 samples when the E. coli concentration was greatly reduced.
An advantage of this study was the ability to repeatedly test a relatively large sample of the gut E. coli population for traits of resistance and RS after antimicrobial therapy. Although our study design allowed for good estimates of the proportion resistant isolates in each sample, we recognize that having a sample size of about 14 cows per group and reliance on nonparametric statistical methods may have limited the study power for detecting differences among treatments.
Conclusions
In this study, most E. coli isolates were susceptible to all antimicrobials tested; however, there was wide cow-to-cow variation of antimicrobial susceptibility within the E. coli population. Ceftiofur treatment significantly reduced the concentration of fecal E. coli for several days after treatment, but the proportion of isolates susceptible to ampicillin, tetracycline, or ceftiofur was largely unaffected except for a change in tetracycline resistance noted in the ceftiofur-treated group on day 2. The large number of isolates evaluated provided a high probability of detecting major effects of ceftiofur treatment on fecal E. coli antibiotic susceptibility in the treated cows. The population dynamics of intestinal microbial flora is complex, and unmeasured factors may account for differences among studies evaluating antimicrobial drug treatment effects on the emergence of resistance.
Footnotes
Acknowledgments
We thank the farm owners for their readiness to participate and their assistance in carrying out this study; Dr. Jessica McArt and Lisa Holz for assisting with sample collection and preliminary studies; as well as Dr. Craig Altier and his lab for advice concerning quality control methods.
This research was supported in part by the Cornell University Agricultural Experiment Station federal formula funds (Project No. NYC-478863) received from Cooperative State Research, Education and Extension Service, U.S. Department of Agriculture. Any opinions, findings, conclusions, or recommendations expressed in this publication are those of the authors and do not necessarily reflect the views of the U.S. Department of Agriculture. We also thank the Ambulatory and Production Medicine Clinic at Cornell University for its financial support.
Disclosure Statement
No competing financial interests exist.