
Abstract
The genus Campylobacter contains several, widespread pathogens causing food-borne diseases of zoonotic nature in humans. In case of outbreaks, the differentiation of closely related Campylobacter is essential for epidemiological studies, which investigate the routes of geographical spread and ways of transmission. Recent advances in mass spectrometry (MS) have shown that matrix-assisted laser desorption/ionization–time-of-flight (MALDI-TOF) MS is a valuable tool for speciation of bacteria such as Campylobacter. Surface-enhanced laser desorption/ionization (SELDI)–TOF-MS is a specific MALDI-TOF application that combines a chip-based chromatographic enrichment of proteins with TOF-MS. This pilot study aims at investigating for the first time whether SELDI-TOF-MS can be applied for discrimination of Campylobacter at the level of species and even strains. Campylobacter type-strains and isolates from different regions were cultured and subsequently subjected to physicochemical lysis. Protein lysates were then applied on CM10 and IMAC30 ProteinChip Array surfaces and analyzed using a PCS 4000 SELDI Protein Chip System (Bio-Rad Laboratories). By comparison of the spectra from Campylobacter jejuni, Campylobacter coli, Campylobacter upsaliensis, and Campylobacter lari, 166 and 160 different protein peaks were observed (p<0.05) using CM10 and IMAC30 chips, respectively. Development of classification trees, comprising 2–4 of these peaks, allows for discrimination of different Campylobacter species and even strains. Moreover, species and strains can be sufficiently separated from each other by hierarchical cluster analysis. Thus, SELDI-TOF-MS is a promising tool to differentiate Campylobacter species and even strains. Species/strain-specific ions observed in addition to well-established markers identified by MALDI-TOF might be of value for future Campylobacter-identifying algorithms. To further clarify the potential advantages of this method, our results have to be validated against several independent test datasets of, preferably, a multitude of prospectively collected different isolates and compared with other typing techniques.
Introduction
C
It is crucial to differentiate closely related Campylobacter for epidemiological investigations to determine the primary sources of bacterial contamination, the geographical distribution, and modes of transmission. Methods that have been described for characterization of bacterial isolates are based on bacterial phenotyping (serotyping and antibiotic susceptibility profiles) or genotyping (Nielsen et al., 2000; Duim et al., 2001; Nayak et al., 2006; Price et al., 2006; Levesque et al., 2008; Foley et al., 2009). However, these techniques differ in discriminatory power, hands-on time, and reproducibility and are limited for a number of reasons (Foley et al., 2009; McEllistrem, 2009). For instance, typing of Campylobacter jejuni strains by pulsed field gel electrophoresis (PFGE) is complicated by resistance against certain restriction enzymes (Gilpin et al., 2006; French et al., 2009) and PFGE, multilocus sequence typing, and repetitive sequence polymerase chain reaction (PCR) have different capabilities for discrimination of C. jejuni isolates (Wilson et al., 2009).
In addition to molecular typing techniques, matrix-assisted laser desorption/ionization–time-of-flight (MALDI-TOF) mass spectrometry (MS) has gained attraction for rapid and accurate classification and identification of bacteria (Claydon et al., 1996; Dworzanski and Snyder, 2005; Murray, 2010), for example, Campylobacter (Winkler et al., 1999; Barzaghi et al., 2004; Mandrell et al., 2005; Fagerquist et al., 2006, 2007; Kolinska et al., 2008; Alispahic et al., 2010).
Surface-enhanced laser desorption/ionization–TOF-MS (SELDI-TOF-MS) is a specific MALDI-TOF application (Tang et al., 2004; Wiesner 2004; Kiehntopf et al., 2007; Caffrey 2010) that has been used for identification of bacterial isolates as well (Lundquist et al., 2005; Schmid et al., 2005; Seibold et al., 2007; Yang et al., 2009). It combines a chip-based solid-phase chromatographic enrichment of proteins from complex samples with TOF-MS. Protein separation and analysis are performed within the same system with the object to permit sensitive detection in parallel of a multitude of distinct proteins in biological samples. So far, no study that uses SELDI-TOF-MS for differentiation of Campylobacter has been reported.
The aim of this study was to exemplarily demonstrate the feasibility of SELDI-TOF-MS in combination with classification and regression tree (CART)–based classification models to discriminate between species and even strains within the genus Campylobacter. To this end, bacterial lysates from different strains of C. jejuni subsp. jejuni, C. jejuni subsp. doylei, Campylobacter lari, Campylobacter coli, and Campylobacter upsaliensis were analyzed. Differentially expressed peaks observed were used for CART analysis and allowed for differentiation of Campylobacter at the species and even the strain level. Further relationship of different strains at inter- and intraspecies levels could be demonstrated by hierarchical cluster analysis (HCA). Based on these promising results, first, validation of the decision trees against several independent test datasets of, preferably, a multitude of prospectively collected different isolates is necessary, and second, a more systematic comparison of SELDI-TOF-MS with other typing techniques seems reasonable, to clarify the potential advantages of this method.
Materials and Methods
Bacterial strains
Campylobacter strains used in this study were provided by the Friedrich-Loeffler-Institut, Institute of Bacterial Infections and Zoonoses, and the Federal Institute for Risk Assessment (BfR). They comprised human and animal field isolates from Great Britain, North America, and different regions in Germany. In addition, type strains of C. jejuni subsp. jejuni. (DSM4688), C. jejuni subsp. doylei (NCTC11951), C. coli (DSM 4689), C. upsaliensis (DSM5365), and C. lari (DSM11375) obtained from DSMZ (Deutsche Sammlung von Mikroorganismen und Zellkulturen GmbH) and the National Collection of Type Cultures (NCTC) were included in the study. Isolates were characterized by their biochemical reaction profiles (API Campy; API-bioMérieux SA). For confirmation and differentiation between C. jejuni and C. coli, a multiplex PCR according to Denis et al. (2001) was performed. For identification of C. lari and C. upsaliensis strains, parts of the 16S rRNA genes were amplified (primers: 16 SUNI-L: 5′-AGA GTTTGATCATGGCTCAG-3′, 16 SUNI-R: 5′-GTGTGACGGGCGGTG TGTAC-3′), followed by sequencing with the same primers (Kuhnert et al., 1996). Cultures were initiated by placing a single bead from Microbank® vials on a fresh Mueller-Hinton (MH) agar plate. Plates were incubated at 37°C for 48 h under microaerophilic growth conditions (10% CO2, 85% N2, 5% O2). Single colonies were transferred to MH broth and cultivated for additional 24 h. One hundred microliters of bacterial solution was applied on MH agar plates and incubated for further 24 h.
flaA typing
Campylobacter genomic DNA was isolated from a 24 h bacterial culture on MH blood agar plates supplemented with 10% bovine citrated blood and purified using High Pure PCR Template Preparation Kit (Roche Diagnostics GmbH) according to the manufacturer's instructions.
Flagellin gene (flaA) typing was performed as previously described (Nachamkin et al., 1996) with modified primers (fla A1: 5′-GGATTTCGTATTAACA-3′; fla 2: 5′-CTGTARYAATCTTAAAACATTTTG-3′) using 1 unit of Taq DNA polymerase (Jena Bioscience GmbH). Only the annealing temperature was changed to 45°C for 1 min. The PCR products were analyzed on a 1.5% agarose gel for 1 h at 200 V. The amplified flaA gene PCR products (1.7 kb) were digested with DdeI (Roche Diagnostics GmbH) according to Ayling et al. (1996). The amplified products were analyzed on 2.5% agarose gels stained with ethidium bromide (0.5 μg/mL) and visualized using a Bio Imaging System (Syngene).
Preparation of lysates
Bacteria were harvested by scraping and transferred into 3 mL buffer (20 mM Tris [pH 7.5]). After centrifugation at 21,000 g for 20 min, bacteria were resuspended in 1.5 mL U9 buffer (8 M urea, 1% CHAPS, and 50 mM Tris-HCl [pH 9]) and lysed by five freeze–thawing cycles (30 min, −80°C; 30 min, RT). Lysates were centrifuged (20 min, 4°C, 21,000 g); the supernatant was aliquoted and stored at −80°C until use. Protein concentrations were determined on an Abbott Architect ci8200 system according to the instructions of the manufacturer (Abbott Laboratories).
Preparation of ProteinChip arrays
Chip pretreatment and washing was performed using a bioprocessor module (Bio-Rad Laboratories). IMAC30 chips were preloaded with 50 μL of 100 mM CuSO4. Lysates were adjusted to a final protein concentration of 1.2 mg/mL with U9 buffer; 20 μL of protein lysate (24 μg) was further diluted 1 to 5 in 0.1 M Na acetate (pH 4) or Dulbecco's phosphate-buffered saline and centrifuged (60 s, 16,100 g) for removal of any precipitate. One hundred microliters of aliquots of the supernatant were loaded on CM10 and IMAC30 ProteinChip Arrays (Bio-Rad Laboratories). After 30 min of incubation of the sample at RT on a DPC MicroMix5 shaker (Promega), chips were washed 2× with appropriate buffers and rinsed with water. To remove remaining liquid, ProteinChips were centrifuged (10 s, 2950 rpm) and air dried for ∼6 min.
Before the chips were analyzed, we applied 2×1 μL of matrix solution (5 mg sinapinic acid dissolved in 200 μL acetonitrile and 200 μL of 1% trifluoroacetic acid) spiked with bovine insulin, giving a final concentration of 10 fmol insulin/μL of matrix solution to the spot surface.
SELDI-TOF-MS
Mass analysis was performed in a ProteinChip Reader (PCS 4000; Ciphergen Biosystems, Inc.) with an automated data collection protocol (source voltage: 25,000 V, detector voltage: 3044 V, detector blanking: 500 Da, ion focus mass: 10,000 Da) including 583 laser shots per spot. A 0–200 kDa mass range was used. Laser energy was set to 3200 and 3500 nanojoules (nJ) for CM10 chips and 3250 and 5250 nJ for IMAC30 chips for the 1–30 and 30–200 kDa measurements, respectively. For each point, the data were averaged to a spectrum. Mass accuracy was calibrated externally using all-in-one peptide/protein molecular weight standards (Bio-Rad Laboratories).
Analysis of data
Spectra were aligned to the mass of the internally spiked bovine insulin peak at 5733.6 Da and normalized by total ion current, using an external normalization coefficient of 1. Spectra with normalization factors >3.44 and <0.344 times the mean normalization factor were excluded from the analysis. ProteinChip Data Manager Software (version 3.5; Bio-Rad Laboratories) package was used for analysis of spectra and also for statistical comparison of peak intensities between species and strains. Peak clusters were detected after baseline subtraction as follows: S/N ratio >5: minimum peak threshold of 4% and 10% for the first pass for species and strain differentiation, respectively; S/N ratio >2: cluster mass window of 0.5 peak width for cluster completion in the second pass. Intensity values of peaks were averaged for duplicate samples. Peak data were exported as CSV files into Microsoft Excel (Microsoft).
CART analysis
CART analysis was performed using Ciphergen Biomarker Patterns software (BPS) version 5.0.1. CSV files containing peak data within the mass range from 1.5 to 20 kDa were imported into the BPS and a classification tree was set up as previously described (Vlahou et al., 2003; Wadsworth et al., 2004). Briefly, BPS identifies peaks that are different between the study groups (strains); peak intensities of respective peaks are first put in order of relevance. Then, a decision tree is constructed using a combination of several parameters (peaks). The respective node points and set limits of the peak intensity are used for classification. Peaks included in the CART models were chosen from the BPS algorithm according to their relevance. For classification of single strains, the data from averaged spectra for each duplicate sample pair analyzed were doubled to avoid a BPS error message that was observed when comparing only five averaged spectra from each strain against each other.
Cluster analysis
HCA was performed using ProteinChip Data Manager Software (version 3.5; Bio-Rad Laboratories). All peaks that have been identified by the peak detection algorithm (see earlier) were used for HCA. Peaks were clustered according to their intensities. The dendrogram illustrates the relationship of different strains at inter- and intraspecies level.
Results
The ability of SELDI-TOF-MS to differentiate thermophilic Campylobacter on the species and strains levels was determined by analysis of mass spectra of bacterial lysates. Lysates were prepared from unrelated strains, as confirmed by fla–restriction fragment length polymorphism (RFLP) (Fig. 1), epidemiological data, and origin of strains. Every strain was prepared five times independently and each preparation was analyzed in duplicate, resulting in 10 spectra for a single strain at a single array condition. In total, 420 spectra were obtained; three spectra were excluded from the analysis because of extreme deviation of the calculated value from the average normalization factor. Peaks were predominantly observed in the m/z range of ∼1.5–20 kDa for both chip types. On CM10 and IMAC30 chips, in total, 174 and 162 peaks were detected when clustering was performed across the different species, respectively. Peak detection and clustering on CM10/IMAC30 across the different strains of C. coli, C. jejuni, C. lari, and C. upsaliensis resulted in 89/89, 98/92, 101/93, and 92/80 peaks, respectively.
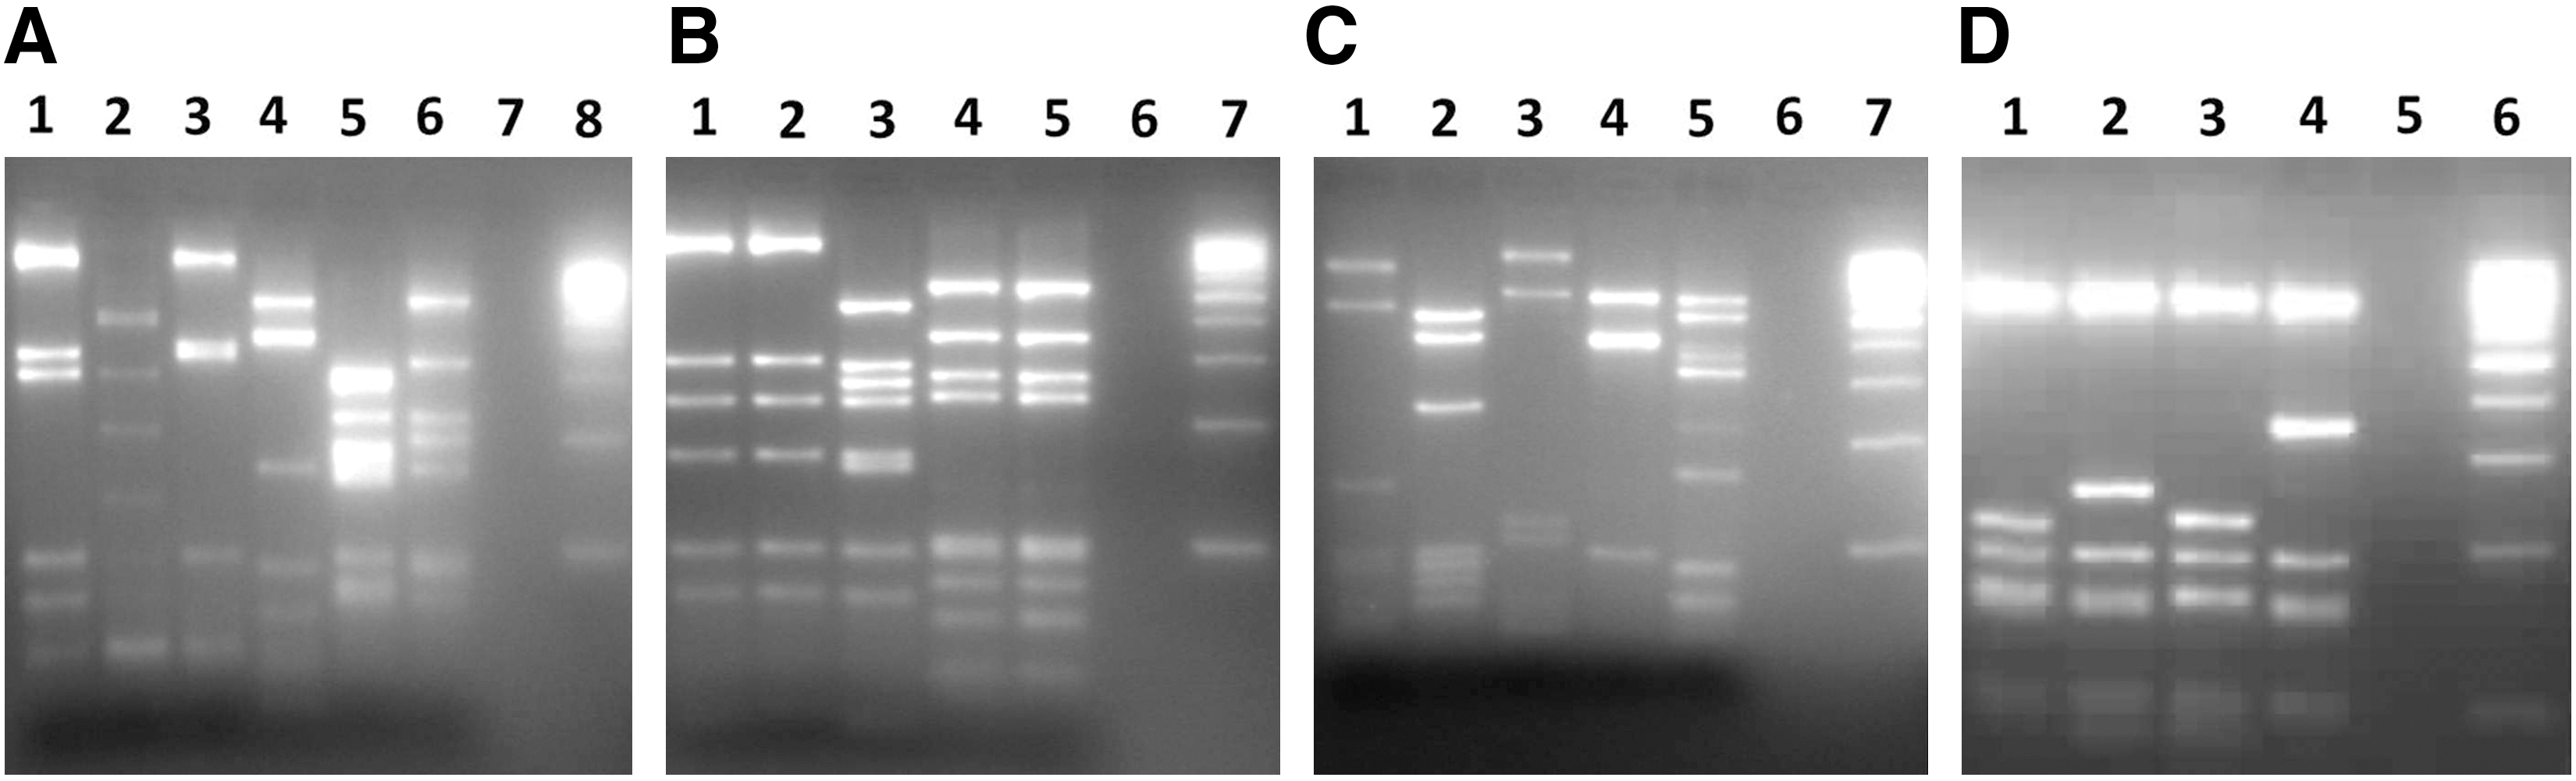
Molecular characterization (flaA genotyping). An amplification product was obtained for all Campylobacter isolates with a PCR assay targeting the flaA gene. DdeI-based restriction fragment length polymorphism analysis of the flaA gene gave specific band patterns for all isolates
Differentiation of Campylobacter species by SELDI-TOF-MS
Spectra obtained from the analysis of the different strains (Table 1 and Fig. 1) belonging to a specific species were grouped together. By comparison of the spectra from C. jejuni, C. coli, C. upsaliensis, and C. lari, different peak intensities for at least one species (p<0.05) were detected in 166 and 160 peak clusters on CM10 and IMAC30 chips, respectively. Representative spectra are shown in Figure 2. For identification of peaks important for discrimination of the different species, first, CART analysis was performed using differences in relative peak intensities at a given m/z value from the CM10 spectra of the 21 different Campylobacter strains. The classification algorithm that allows correct identification of 100% of the species comprises three clusters with molecular masses of ∼2716, 3498, and 3516 Da (Fig. 3A). Representative examples of normalized mass spectra are shown in Figure 3B. Mean peak intensities of the three relevant markers were significantly different (p<0.001) between the two sample groups (data not shown). On IMAC30 ProteinChip arrays, a peak at 2766 Da was specific for C. lari, whereas C. upsaliensis exhibited a typical peak at 3532 Da. C. jejuni and C. coli can be differentiated by splitting at 5014 Da with a threshold of relative intensity ratios of 9.8 (Fig. 3C). The corresponding gel-views of normalized mass spectra are shown in Figure 3D.

Representative examples of normalized ProteinChip array profiles of members of the genus Campylobacter. Representative surface-enhanced laser desorption/ionization–time-of-flight mass spectrometry spectra and virtual gel-view obtained after analysis of protein lysates from C. jejuni, C. coli, C. upsaliensis, and C. lari. Chip type IMAC30, mw range: 1.5–20.5 kDa (upper panels); chip type CM10, mw range: 1.5–20.5 kDa (lower panels).

Classification of Campylobacter species by protein profiling and classification and regression tree analysis.
In addition to the aforementioned differentiating peaks in the molecular range <5.1 kDa, we observed several biomarkers for speciation of Campylobacter by MALDI-TOF-MS already described in the literature (Winkler et al., 1999; Mandrell et al., 2005; Fagerquist et al., 2006, 2007; Kolinska et al., 2008; Alispahic et al., 2010) (Table 2).
Bold-faced numbers denote ions that correspond to biomarkers shown to be important for speciation of members of the genus Campylobacter by other researchers.
Differentiation of single strains by CART analysis
To investigate whether the strains could be further stratified, CART analysis was performed using IMAC30 spectra from individual C. coli strains (Fig. 4A). On the basis of four molecular markers at 2624.56, 3504.1, 3406.0, and 5168.6 Da (Fig. 4B), we were able to discriminate all five C. coli strains. Similarly, data from CM10 chips allowed differentiation of all five strains (Supplementary Fig. S1A, B; Supplementary Data are available online at

Discrimination of different C. coli strains by surface-enhanced laser desorption/ionization–time-of-flight profiling and classification and regression tree analysis.
By comparing spectra from six individual strains of C. jejuni 77 and 81 different peaks could be detected on IMAC30 and CM10 ProteinChips, respectively. CART analysis revealed peaks at 2687.9, 2731.8, and 3789.3 Da as important discriminators on IMAC30 and at 2745.2, 3787.5, 2730.8, and 5045.8 Da on CM10 ProteinChips (Supplementary Fig. S2A, C, and 2B, D for representative gel-views).
For the differentiation of C. lari strains, peaks at 2766.9, 3898.4, 3547.3, and 4097.4 Da were identified as splitters on IMAC30 and peaks at 3694.3, 3495.5, 4372.2, and 4453.6 Da on CM10 ProteinChips, respectively (Supplementary Fig. S3A–D).
Finally, we tried to differentiate C. upsaliensis strains (Supplementary Fig. S4A–D). Most important splitters on CM10 chips were detected at 3400.2, 2751.4, and 3770.3 Da. On IMAC30 ProteinChips, different intensities of only two peaks with molecular masses of 3843.8 and 4100.9 Da were required for 100% discrimination of the five C. upsaliensis strains.
Cluster analysis of the genus Campylobacter
In addition to CART analysis, we performed HCA using the IMAC30 dataset to differentiate the four Campylobacter species and even strains analyzed. Figure 5 shows a heat map of representative spectra from five independent lysate preparations for every strain. Clustering of the selected peaks (m/z values) according to their intensity revealed that all strains grouped according to their species, demonstrating that the IMAC30 dataset alone sufficiently differentiated the species. Moreover, separation of strains was achieved in 100% of the five replicates for all C. lari, five C. jejuni, four C. upsaliensis, and three C. coli strains. However, one replicate from C. jejuni strain 121006ZH0033 (replicate 5:0033_5) grouped with spectra of strain 216/04, one replicate from C. upsaliensis strain 0021021 (replicate 4:21021_4) grouped with spectra of strain 14061, and two unrelated strains (08CS0039 and 07BS0016) of C. coli grouped together. In general, these data reveal that Campylobacter can be speciated and the different strains can be separated from each other by HCA.
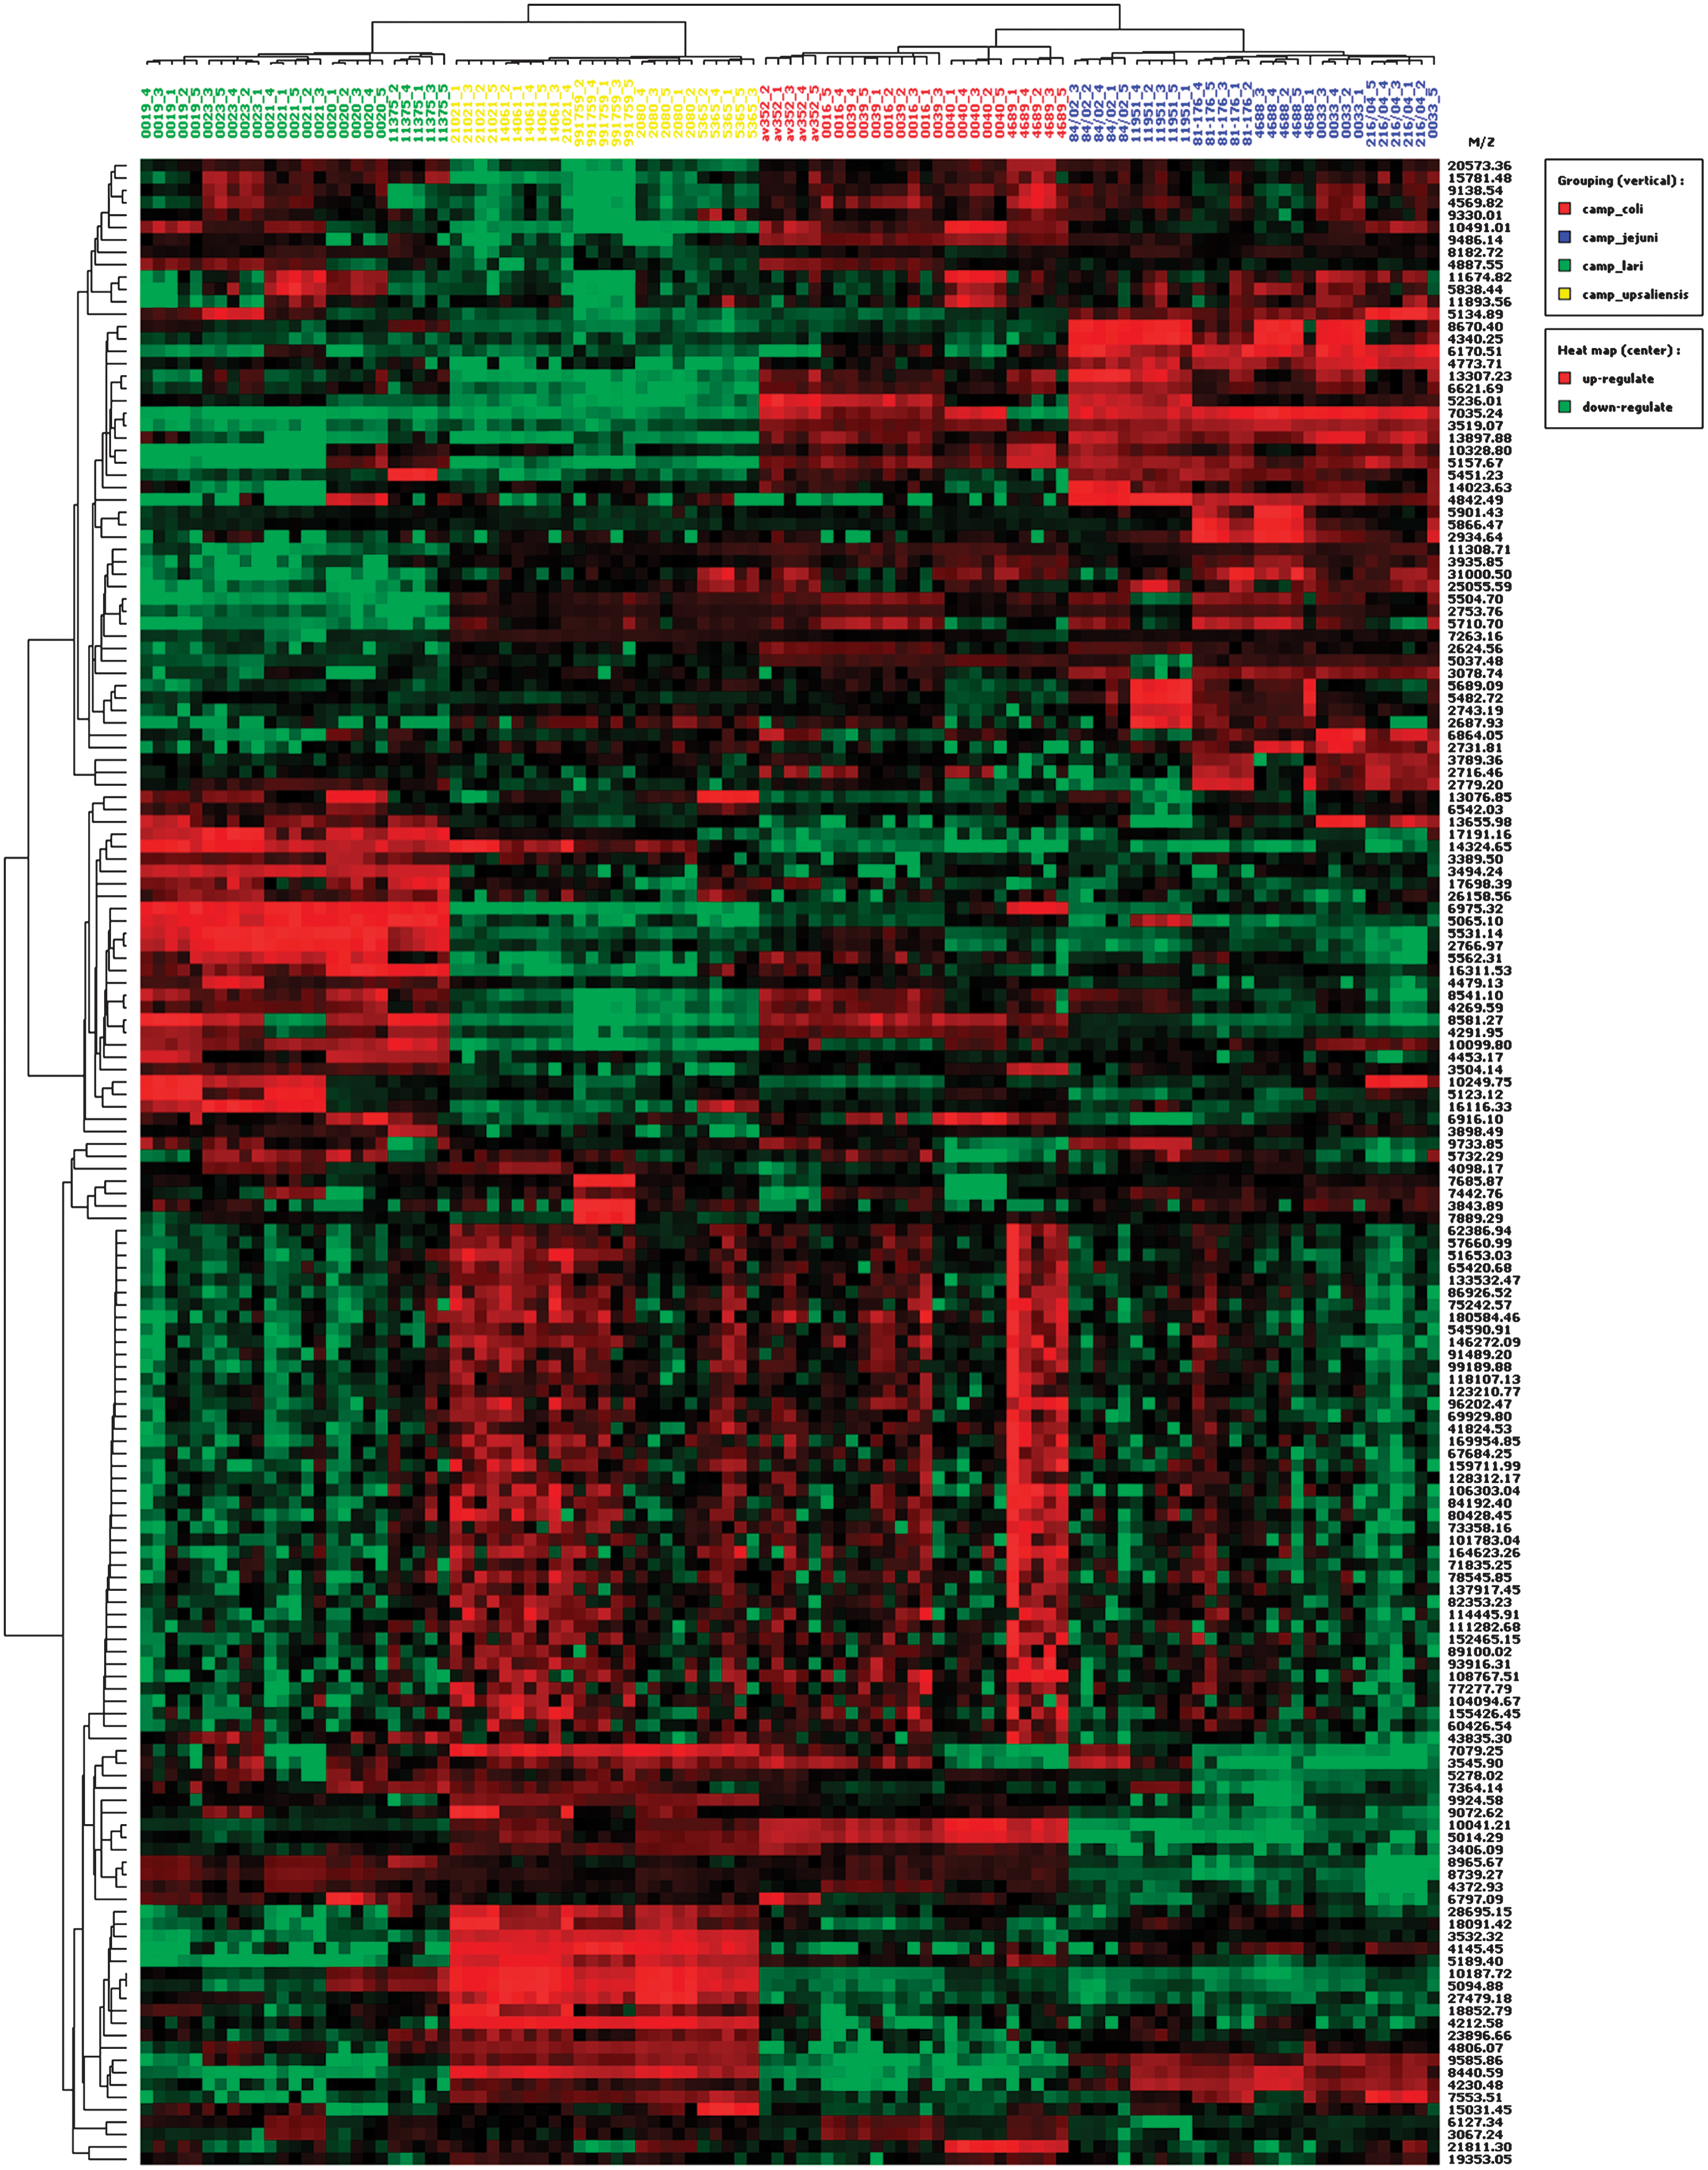
Hierarchical cluster analysis of the genus Campylobacter using the IMAC30 dataset. Heat map presentation of clustered IMAC30 peaks according to their intensity (green squares, black squares, and red squares indicate low, intermediate, and high peak intensity, respectively). Results of five independent lysates from each of the 21 strains analyzed are shown (Table 1). The numbers on the right are the m/z of the ions used in the analysis and the heat map shows the relative amount of that ion detected. The tree on the left depicts clustering of the m/z of the ions. Color images available online at
Discussion
The results presented here demonstrate for the first time that SELDI-TOF-MS can be instrumental for the classification and identification of Campylobacter isolates by analysis of bacterial protein lysates in combination with CART-based models. Correct speciation was observed in 100% of the 21 different Campylobacter strains analyzed. Moreover, by CART analysis of the proteomic data we have identified several algorithms containing peaks that clearly separate each of the five strains of each species. Among 166 and 160 peak clusters showing different peak intensities for at least one species (p<0.05), detected on CM10 and IMAC30 chips, respectively, 29 have been already identified by MALDI-TOF-MS (Table 2) and shown to be important for speciation of Campylobacter by other researchers (Winkler et al., 1999; Barzaghi et al., 2004; Mandrell et al., 2005; Fagerquist et al., 2006, 2007; Kolinska et al., 2008; Alispahic et al., 2010). Interestingly, none of these ions, with masses >7000, were part of the CART models developed in this study. This demonstrates that in addition to these biomarkers, peaks in the molecular range from 2.6 to 5.1 kDa observed by SELDI-TOF-MS were adequate for determining species and even strains. However, in this context, it is relevant to mention that peak clusters identified as important by BPS vary depending on the order they were analyzed by CART. This might be due to the fact that after identification of peak patterns that lead to perfect classification, the software stops looking for further peaks that may improve the classification tree. If peak clusters were ordered and analyzed according to their mass, as in this study, discriminatory peaks in the low molecular weight range were preferentially included in CART models. As we succeeded in species/strain differentiation using peaks below <5.1 kDa, we did not further evaluate the discriminatory power of peaks at higher masses although we observed numerous peaks with m/z ratios up to 180,584.46 that cluster with specific species/strains. Thus, we might have missed additional classification trees containing already described discriminatory biomarkers >7 kDa. Moreover, using five replicates of each strain we could demonstrate that 98% of the 105 replicates investigated grouped according to their designated strain. Although this does not prove the reproducibility of the whole system, for example, variation of mass spectra from day to day, this demonstrates that independent preparations of lysates are reproducible enough that ion masses can be used for differentiation of Campylobacter species.
Although this study shows for the first time that SELDI-TOF-MS allows successful discrimination of 21 strains from five Campylobacter species in parallel, it must be mentioned that our method is more time consuming with regard to sample preparation compared to MALDI-TOF-MS–based typing methods. However, as cultivation of bacteria is the most time-consuming step in MS-based typing methods, we believe that these limitations may be considered as insignificant. In addition, we want to point out that our study is limited, first, by the fact that we did not identify the underlying proteins of discriminatory peaks; second, that analysis of more isolates, for example, 50–100 with different characteristics will be needed for further evaluation of subtyping performance; and third, that a side-by-side comparison of our method with several other methods, beyond the flagellin gene (flaA) typing method used in this study, have to be performed under the same experimental conditions in independent laboratories to clarify for which purposes SELDI-TOF-MS should be used in preference to other methods. Studies addressing these topics are underway.
In conclusion, this first proof-of-principle study of SELDI-TOF-MS on thermophilic Campylobacter protein profiles demonstrates that SELDI-TOF-MS in combination with CART or HCA analysis can be applied for reliable identification and discrimination of species and even strains of the genus Campylobacter. Species/strain-specific ions observed in addition to well-established markers identified by MALDI-TOF might be of value for future Campylobacter-identifying algorithms. Thus, this study demonstrates that SELDI-TOF-MS might also be a valuable tool for pathogen identification with importance in surveillance studies as well as in outbreak investigations in the near future.
Footnotes
Acknowledgments
The authors thank K. Stoetzer and K. Kluge for excellent technical assistance. The research was supported by the Foundation for Pathobiochemistry and Molecular Diagnostics of the DGKL and the Deutsche Forschungsgemeinschaft (DE307/7-1 and PO 563/7-1).
Disclosure Statement
No competing financial interests exist.
References
Supplementary Material
Please find the following supplemental material available below.
For Open Access articles published under a Creative Commons License, all supplemental material carries the same license as the article it is associated with.
For non-Open Access articles published, all supplemental material carries a non-exclusive license, and permission requests for re-use of supplemental material or any part of supplemental material shall be sent directly to the copyright owner as specified in the copyright notice associated with the article.