
Abstract
The study used a structured expert elicitation survey to derive estimates of food-specific attribution for nine illnesses caused by enteric pathogens in Canada. It was based on a similar survey conducted in the United States and focused on Campylobacter spp., Escherichia coli O157:H7, Listeria monocytogenes, nontyphoidal Salmonella enterica, Shigella spp., Vibrio spp., Yersinia enterocolitica, Cryptosporidium parvum, and Norwalk-like virus. A snowball approach was used to identify food safety experts within Canada. Survey respondents provided background information as well as self-assessments of their expertise for each pathogen and the 12 food categories. Depending on the pathogen, food source attribution estimates were based on responses from between 10 and 35 experts. For each pathogen, experts divided their estimates of total foodborne illness across 12 food categories and they provided a best estimate for each category as well as 5th and 95th percentile limits for foods considered to be vehicles. Their responses were treated as triangular probability distributions, and linear aggregation was used to combine the opinions of each group of experts for each pathogen–food source group. Across the 108 pathogen–food groups, a majority of experts agreed on 30 sources and 48 nonsources for illness. The number of food groups considered to be pathogen sources by a majority of experts varied by pathogen from a low of one food source for Vibrio spp. (seafood) and C. parvum (produce) to a high of seven food sources for Salmonella spp. Beta distributions were fitted to the aggregated opinions and were reasonable representations for most of the pathogen–food group attributions. These results will be used to quantitatively assess the burden of foodborne illness in Canada as well as to analyze the uncertainty in our estimates.
Introduction
Many of these illnesses are transmitted from zoonotic sources that enter the food supply. However, all foods do not have the same potential to transmit a given pathogen. Food attribution aims at quantifying the number or proportion of cases of a given illness that can be attributed to a source, either a reservoir or a food (Pires et al., 2009). Food attribution is key in estimating the food-specific burden of the illness, which in turn informs decision making for effective prevention and control measures on food safety (Batz et al., 2004, 2007; Doyle and Erickson, 2006; Anonymous, 2007; Havelaar et al., 2007; Hird et al., 2009; Kuchenmüller et al., 2009). Several methodological approaches have been identified to tackle the scientific challenge of food attribution (Batz et al., 2005; Anonymous, 2007; Pires et al., 2009). Expert elicitation is recognized as a reasonable methodology to cover gaps in data or when resources are not available for epidemiological and molecular approaches. It has been used for food attribution in various countries (Henson, 1997; Hoffmann et al., 2006; Hoffmann et al., 2007; Karns et al., 2007; Havelaar et al., 2008; Lake et al., 2010) but thus far not in Canada. Food attribution estimates from these studies are difficult to compare and to extrapolate to other countries because of differences in methodology (especially the food categorization scheme) as well as potential differences between countries in their food production systems, food safety regulations and practices, and food consumption behavior.
This study was undertaken to estimate food-specific attribution (i.e., proportion of illnesses associated with specific food categories) for nine enteric illnesses in Canada using a structured expert elicitation. A secondary objective was to characterize uncertainty in the estimates as well as the level of agreement among experts on food source attribution. The first part of this study focused on the proportion of cases attributed to all food sources (i.e., via foodborne route) and the analysis was presented in an earlier article (Ravel et al., 2010). This second article reports the experts' attributions of illness to specific food sources and compares these opinions by pathogen–food combinations.
Materials and Methods
A one-round survey of a comprehensive panel of food safety experts in Canada was used to elicit opinions about the foodborne proportions of gastrointestinal illnesses as well as food sources for a set of nine enteric pathogens. There were no consultations among the panelists or with the investigators during or after completion of the survey. It replicated a similar expert elicitation on food attribution conducted in the United States (Hoffmann et al., 2006).
The pathogens targeted were Campylobacter spp., Escherichia coli O157:H7, Listeria monocytogenes, nontyphoidal Salmonella enterica, Shigella spp., Vibrio spp., Yersinia enterocolitica, Cryptosporidium parvum, and Norwalk-like virus. In contrast with the U.S. elicitation, we did not include Cyclospora cayetanensis and Toxoplasma gondii as these diseases are rare in Canada. The food categories were defined according to Hoffmann et al. (2006) and are listed in Table 1.
Excluding water.
Survey tool
The tool for the Canadian survey was adapted from the work of Hoffmann et al. (2006) with permission of the authors and it is described in Ravel et al. (2010). In the first part of the survey, respondents provided details on their academic training and work experience and a self-assessment of their expertise with respect to each pathogen and each food group. Participants were asked to rate their expertise using a 5-point scale (1=low [e.g., no direct experience, anecdotal knowledge only] to 5=high [e.g., primary focus of my professional work]). The second part of the survey focused on attribution of illness to food sources. A separate form was provided for each targeted pathogen as well as a worked example (see Appendix 1). Experts were asked to perform the following tasks: 1. To classify each of the 12 food categories (as defined in survey tool) as a likely source of a specific pathogen (yes or no), and 2. To distribute total foodborne illnesses for each pathogen across the food categories that they believed to be likely sources. Experts provided their best estimates of food-specific attribution as well as low (5th percentile) and high (95th percentile) limits for their estimates. They were asked to check that the sum of their best estimates over all food categories was 100% for each pathogen. Experts were instructed to ignore travel-related cases and to consider the source to be the food that was consumed and not a food that may have caused illness indirectly (e.g., by cross-contamination). Water was not to be included as a source of food contamination. There was a general category (Other) for foods that did not fit into the defined groups, and when they used this category, experts were asked to provide details to explain their estimates. If an expert identified water as a likely source in the “Other” category, this estimate was disregarded and the attribution estimates for the remaining sources were adjusted proportionately to maintain 100% attribution across all foods. In five cases, this adjustment caused a problem because the modified best estimate was not within the 5th/95th percentile limits. These responses were not included in the linear aggregation of individual estimates.
Expert selection and survey administration
The method used to select the food safety experts was also adapted from the work of Hoffmann et al. (2006).
Briefly, a snowball sampling approach was used to identify potential food safety experts within Canada. For the purpose of the study, food safety expertise was based on professional experience as recognized by peers in industry, academia, and government institutions; knowledge of food safety hazards in specific food sectors and ability to provide estimates of illness attribution; and working experience in Canada. Three rounds of snowball sampling produced a list of 135 Canadian food safety experts.
The survey packages consisting of an introduction letter, the survey tool, and a prepaid envelope were mailed on October 2008. Seventeen additional experts were identified by the responding experts and were sent the survey package as well. The data collection was stopped in early December 2008 after three reminders emailed to the nonrespondents. More details are reported in the work of Ravel et al. (2010).
Data analysis
In our earlier report on survey responses for foodborne proportion of illness (Ravel et al., 2010), only experts who self-assessed their pathogen expertise as 3 (=medium, some direct experience but wide reading) or higher were used in the analysis. Although we recognized that some self-assessments may have been inflated, there was no correlation between expertise level (3, 4, or 5) and estimates of foodborne proportion of illness. For reliability and consistency, the same group of experts was used as a starting point for analysis of food-specific attributions of illness.
For each pathogen and food category, the experts' estimates were aggregated into linear opinion pools as described by Clemen and Winkler (1999). A triangular probability distribution was defined for each expert's estimate for food source attribution using the best estimate value as the mode and geometrically deriving minimum and maximum limits from the 5th and 95th percentile estimates. Experts who provided best estimates without 5th and 95th limits were not included in the analysis. Each probability distribution was discretized from 0% to 100% attribution at intervals of 1%. As the questionnaire asked for a binary classification of each food group as a source (i.e., yes or no response), we treated the “no” responses as point estimates and assumed a uniform probability density between 0% and 1%. The linear opinion pool for attribution of illness to a particular pathogen and food group was calculated as
where n is the number of experts, pi (θ) is expert i's probability density for attribution (θ) to a specific pathogen and food group, wi is a weight for each expert, and p(θ) is the combined probability density. For each interval on the percentage attribution scale (i.e., 100 intervals between 0% and 100%), the individual probabilities representing experts' estimates were combined using equal weights for all experts in the group to estimate a linear opinion pool for a pathogen–food source combination.
For each pathogen and food category, we fitted a beta distribution to the combined distribution of the food-specific attribution estimates. A maximum likelihood method (fitdistr function written in R language: Main Package of Venables and Ripley's MASS, Version 7.3-4, accessed at
Results
Selection of experts for food source attribution
As reported by Ravel et al. (2010), there were two distinct clusters of estimates of the foodborne proportion of illness for six of the nine pathogens (Campylobacter spp., E. coli O157:H7, L. monocytogenes, nontyphoidal S. enterica, Vibrio spp., and Y. enterocolitica). The clusters were identified as Group 1 and Group 2 but experts were not necessarily in the same group across all six pathogens. For these pathogens, the linear Kolmogorov-Smirnov test (Chavarti et al., 1967) was used to determine whether the two groups differed for their food-specific attribution estimates. In Table 2, the mean values for each group of experts are shown and cases wherein the null hypothesis was rejected (i.e., difference between cumulative distributions for the two groups of experts was statistically significant) are highlighted with an asterisk. It can be seen that there was limited agreement on food source attribution between the two groups of experts across six pathogens. The number of food categories for which no significant differences were observed ranged from 1 (Vibrio spp.) to 6 (Campylobacter spp.).
Numbers in parenthesis indicate number of responses in each subgroup. Note that an expert in Group 1 for one pathogen may be in Group 2 for other pathogens.
Significant difference between Group 1 and Group 2 experts for this food source. The Kolmogorov-Smirnov test uses the maximum difference (D) between the cumulative distributions for each group and the null hypothesis is rejected at level α if
In this analysis, n 1=n 2=500 and α=0.05.
As there were significant discrepancies between the two subgroups in terms of the distributions for food-specific attributions, it was clear that we needed to select one of the subgroups before continuing with the characterization of variability in the estimates. To help with this decision, we compared background information collected by the survey for the two subgroups for each pathogen. Based on Pearson chi-square tests and likelihood ratios, there were no significant differences between Group 1 and Group 2 experts in terms of self-assessed expertise for all six pathogens. Employment sector at the time of the survey (i.e., academic, government, or industry) was significant only for Campylobacter spp. because of the fact that the three industry experts were in Group 1. Mean values of food safety experience were 13 or more years for all groups and the only pathogen that had a significant difference between groups was nontyphoidal S. enterica (Group 1: mean=22.0 years, standard deviation=9.4; Group 2: mean=13.0 years, standard deviation=9.4) Although Group 1 had a higher mean value for years of experience, Group 2 had sufficient experience to be considered credible.
As a next step, we used external information, that is, the foodborne proportion reported by previous expert elicitation studies (Ravel et al., 2010). For all six pathogens, the subgroups with higher mean values for foodborne proportion (i.e., Group 2 experts) were more consistent with the comparison data. For this reason, we decided to select the Group 2 experts for every pathogen with two subgroups of estimates for the food-source attribution analysis. Depending on the pathogen, there were estimates from 10 to 35 experts for each food source.
Participating experts
As previously reported (Ravel et al., 2010), the survey package was mailed to 152 experts and 66 of them provided usable data for at least one pathogen. With the selection of a specific subgroup of experts for six of the pathogens, the dataset used for the food-specific attribution analysis included the responses from 54 experts. Those experts had various scientific or medical degrees (32 Ph.D., 9 M.Sc., 4 B.Sc., 5 D.M.V., 2 M.P.H., 1 M.D., and 1 Fellow of the Royal College of Physicians and Surgeons of Canada) with diverse educational background, mainly in microbiology (n=21) or epidemiology (n=14). At the time of the survey, 24 experts worked for the federal government, 16 in academic institutions, 11 for a provincial government, and 3 in the agri-food industry. The low number of experts working in industry was disappointing and we recognized that increased representation in this employment sector must be addressed in future surveys. Seven experts had spent part of their career in more than one of the employment sectors. Their years of experience in the area of food safety was normally distributed with a mean of 15 years (standard deviation=10 years; Shapiro-Wilks statistics=0.94; p=0.016). Their self-rated expertise for food groups was varied (Table 3). It was relatively high for poultry and beef and low for seafood, game, breads and bakery products, and beverages.
From 1=low (e.g., no direct experience, anecdotal knowledge only) to 5=high (e.g., primary focus of my professional work).
Food attribution estimates
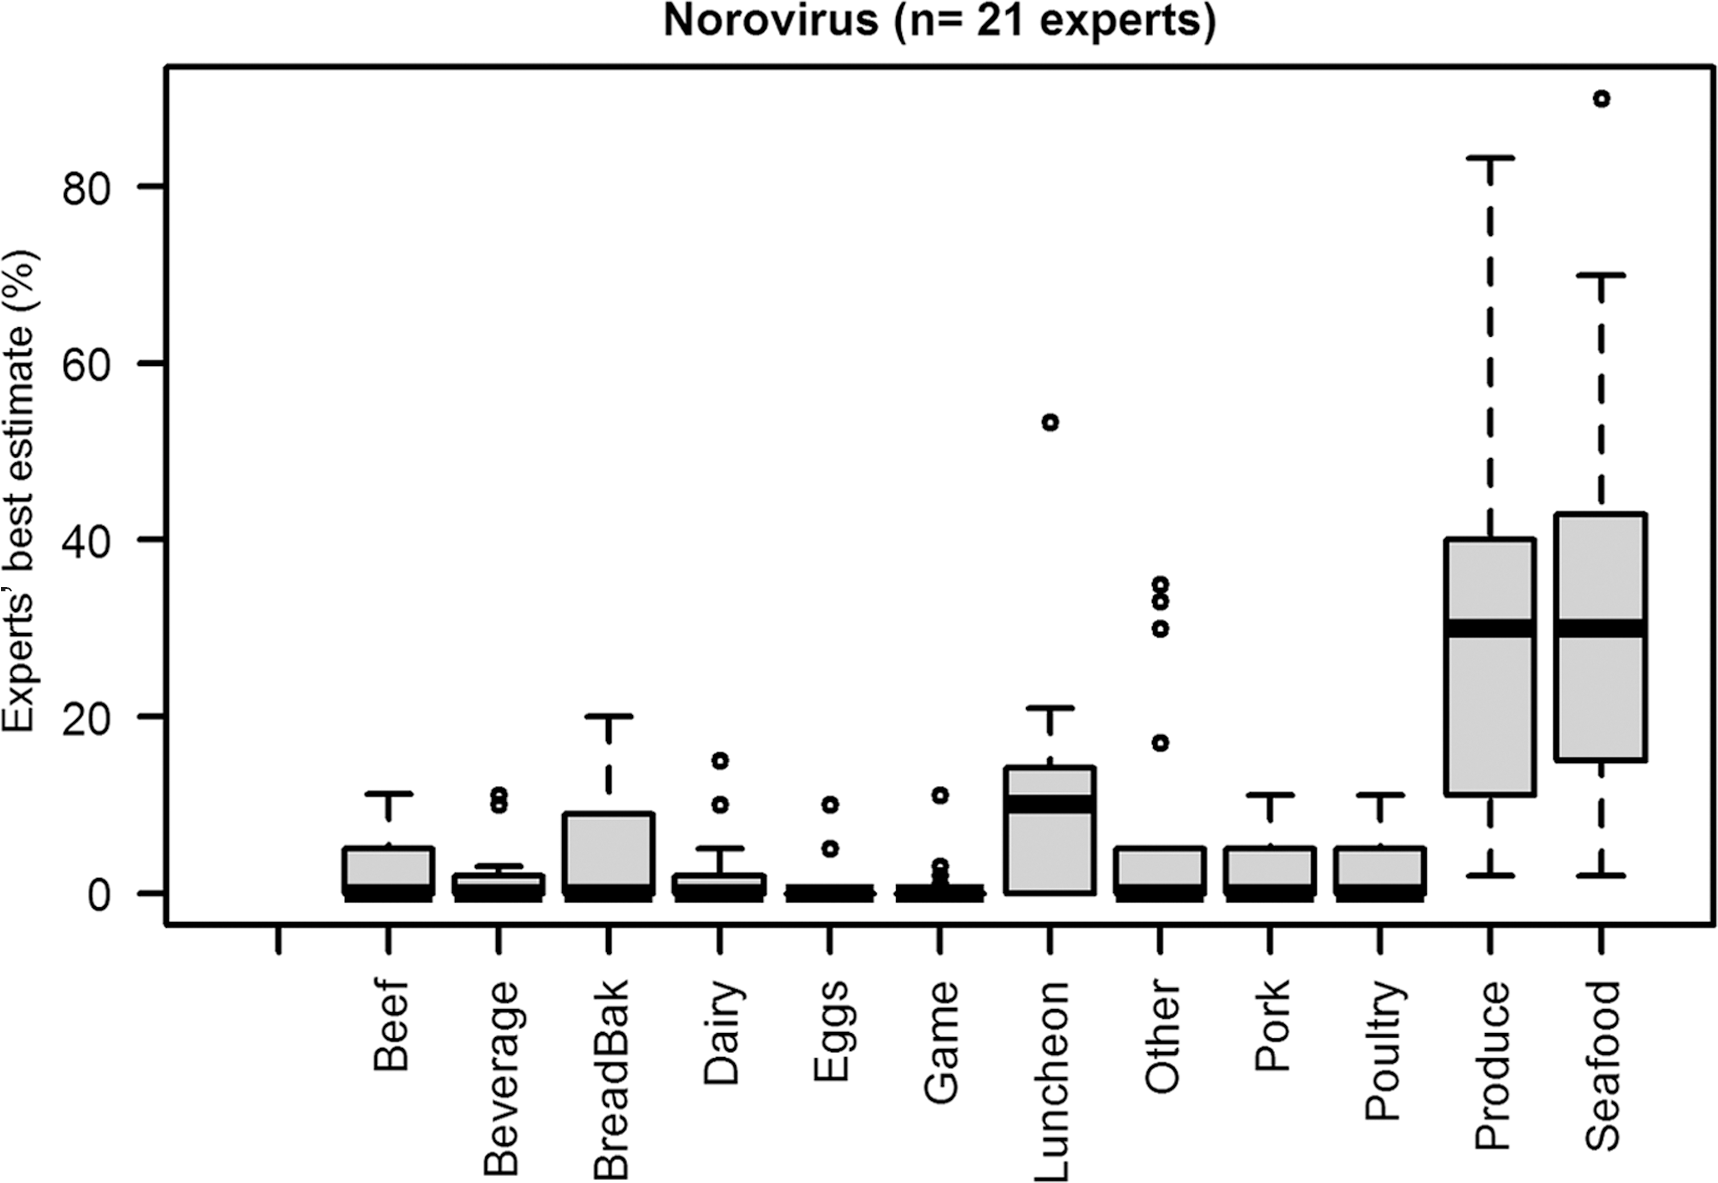
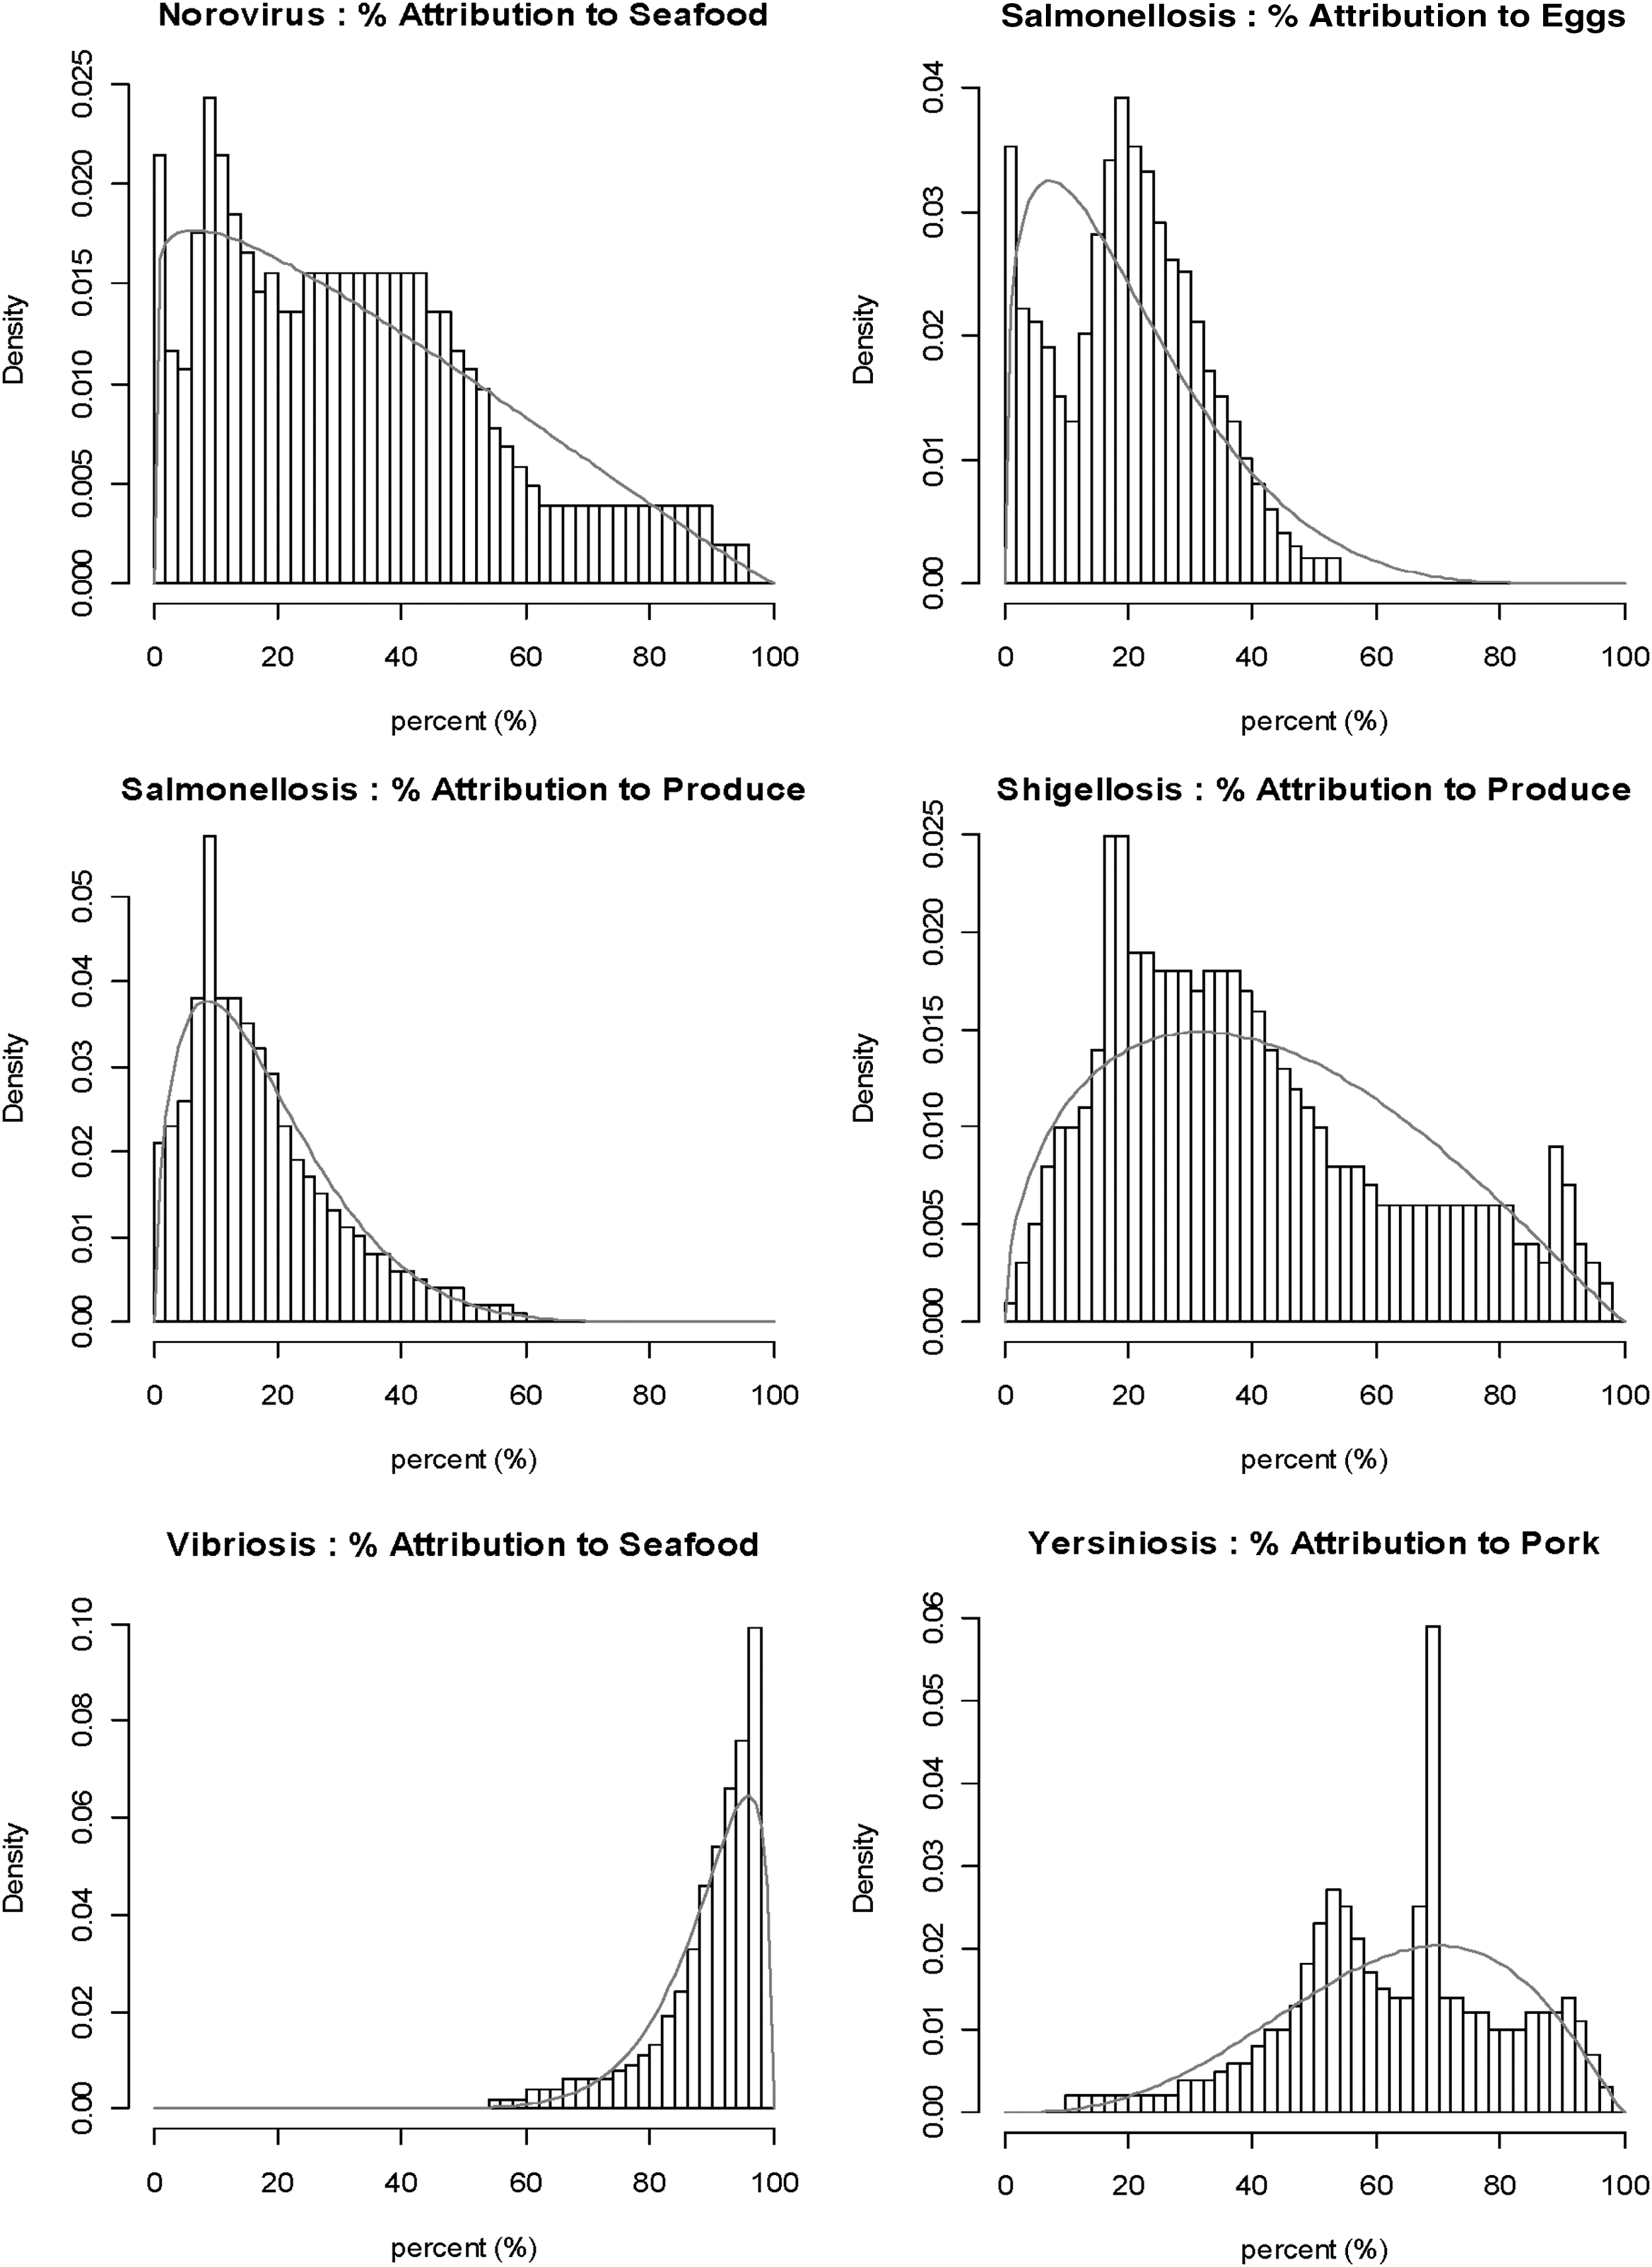
Table 4 shows the results for the binary classification of food groups into sources and nonsources for each of the nine pathogens. Across the 108 pathogen–food groups, two of three experts agreed on 30 sources and 48 nonsources for illness. The number of food groups considered to be pathogen sources by two of three experts varied by pathogen from a low of one food source for Vibrio spp. (seafood) and C. parvum (produce) to a high of seven food sources for Salmonella spp. The distributions of experts' best estimates for food-specific attribution are shown in Figure 1 for all nine pathogens. These graphs illustrate some typical features of the food source estimates: asymmetric distributions and large ranges in the experts' opinions for many food sources.
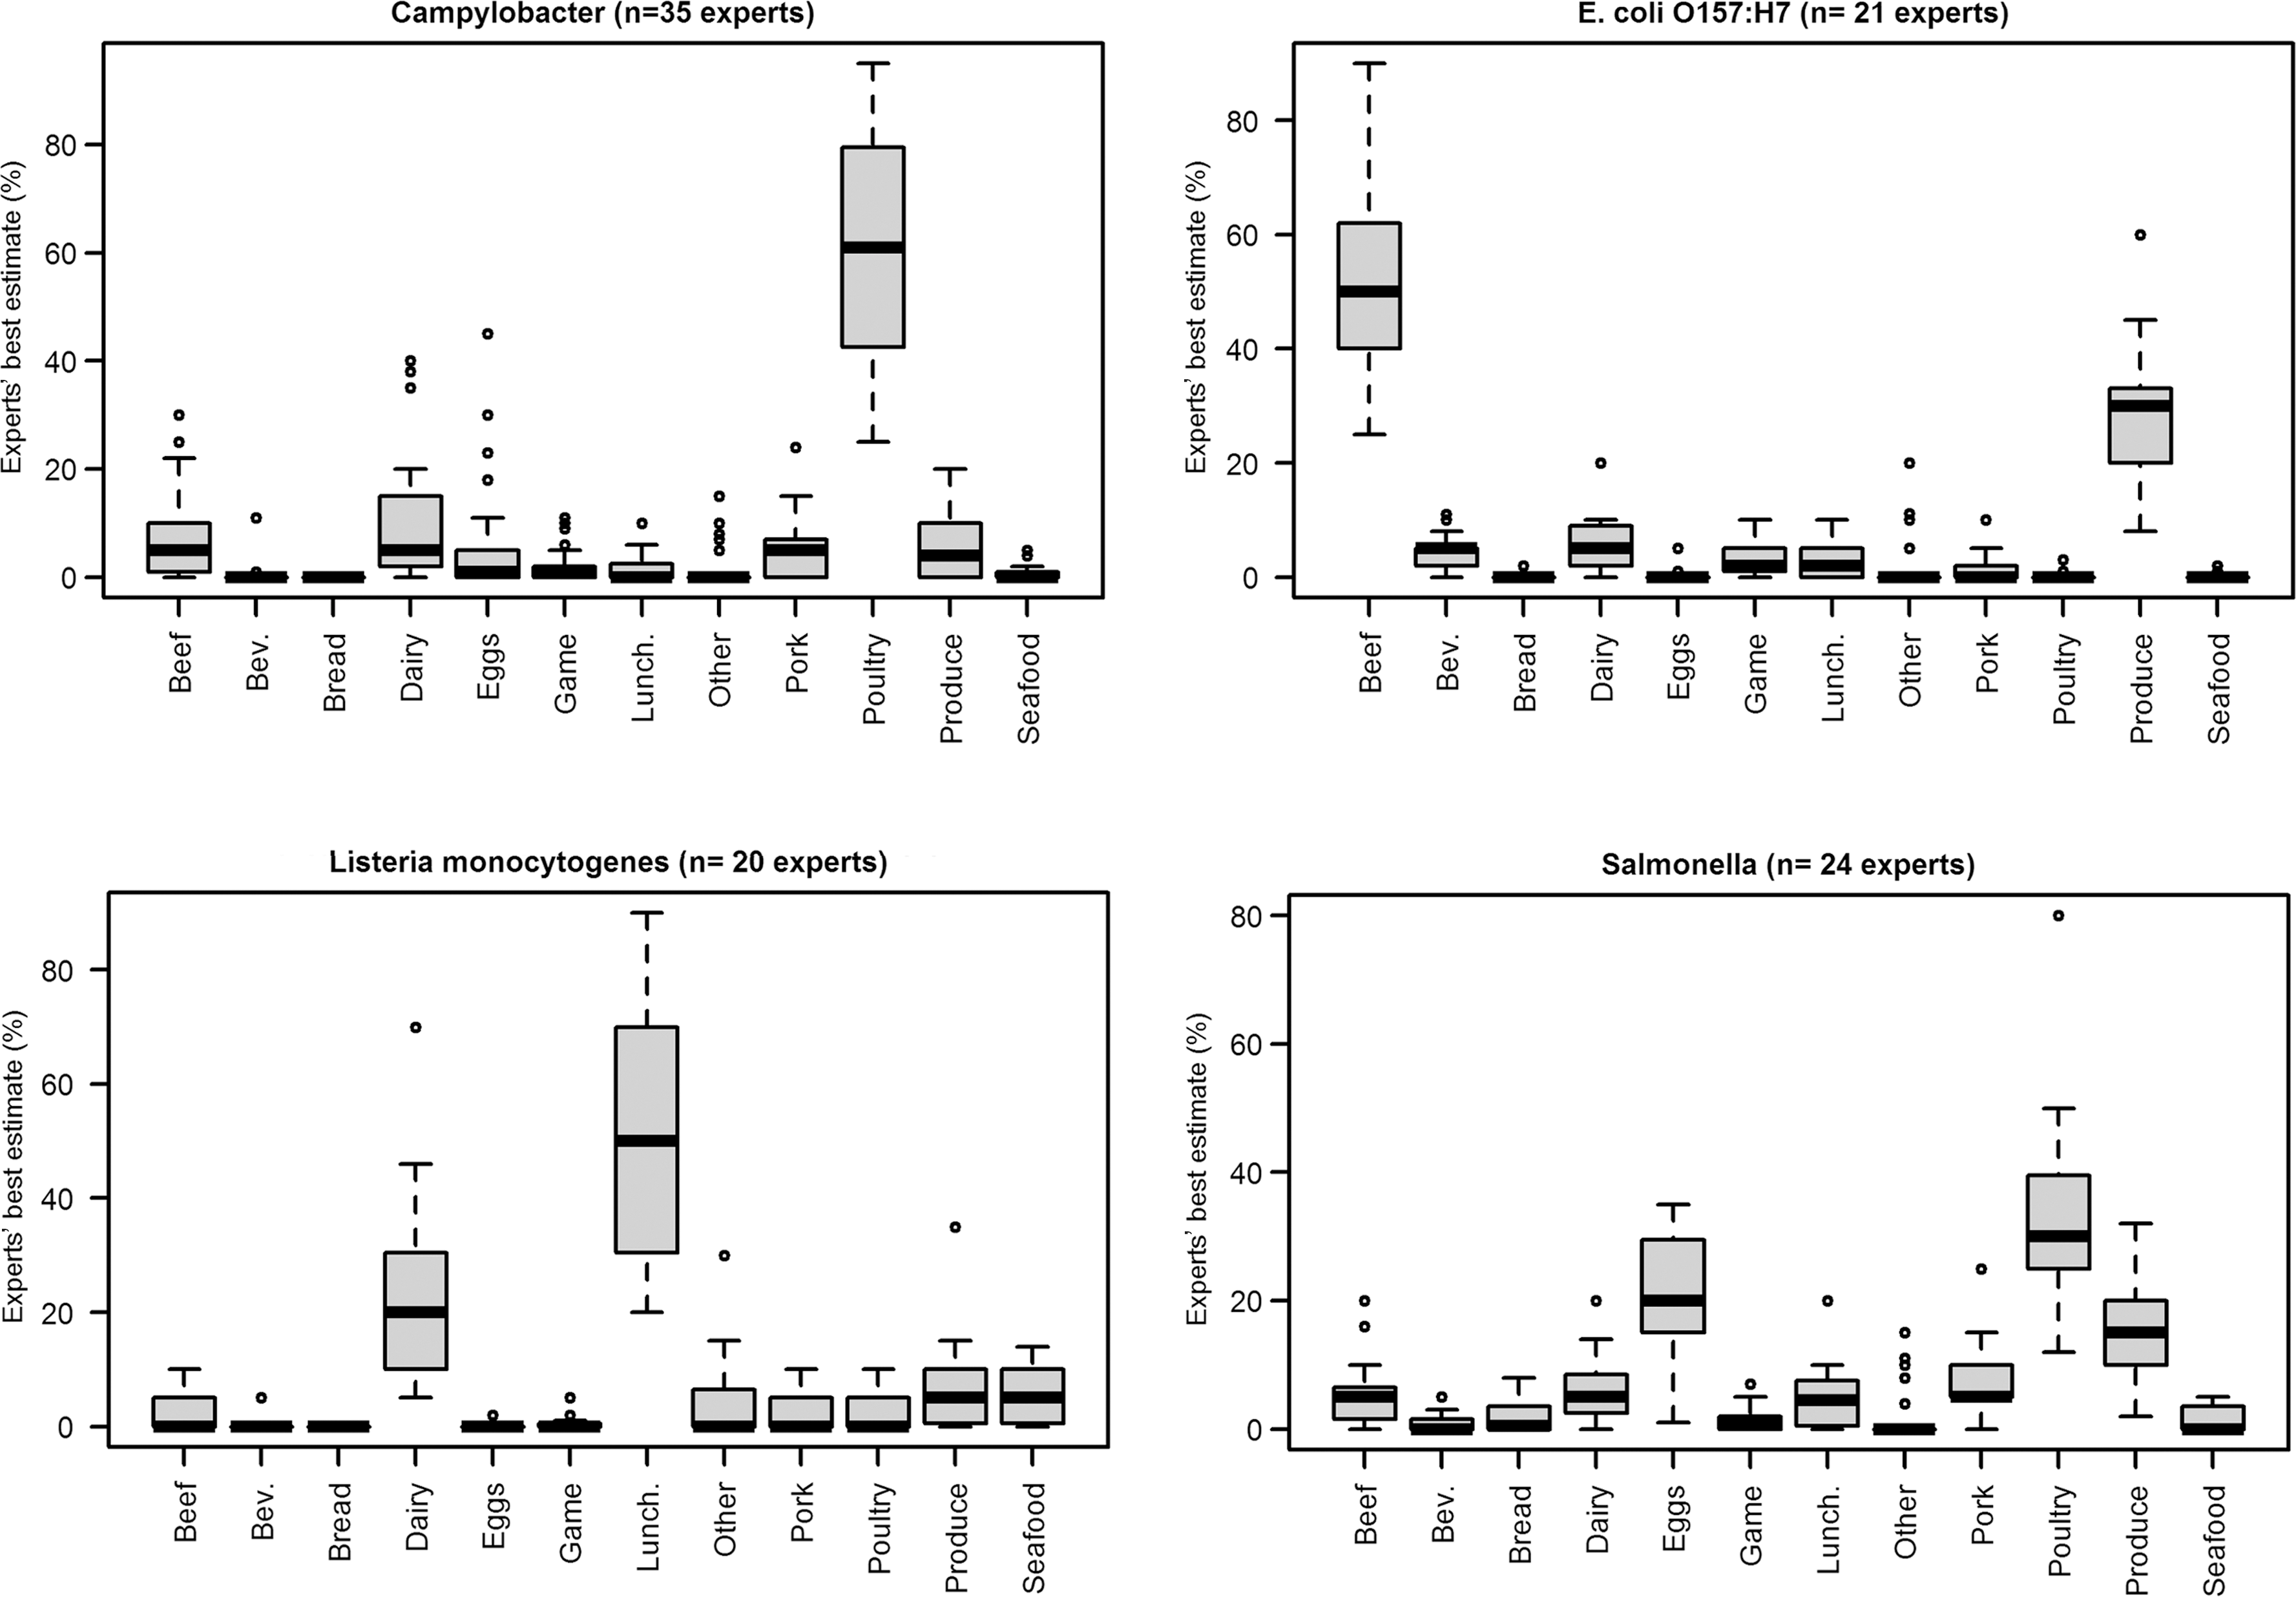
Distributions of experts' food-specific attribution estimates (best) for selected enteric pathogens (food categories [in order left to right]: Beef, Bev. [beverage], Bread [breads and bakery], Dairy, Eggs, Game, Lunch. [luncheon meats], Other, Pork, Poultry, Seafood).
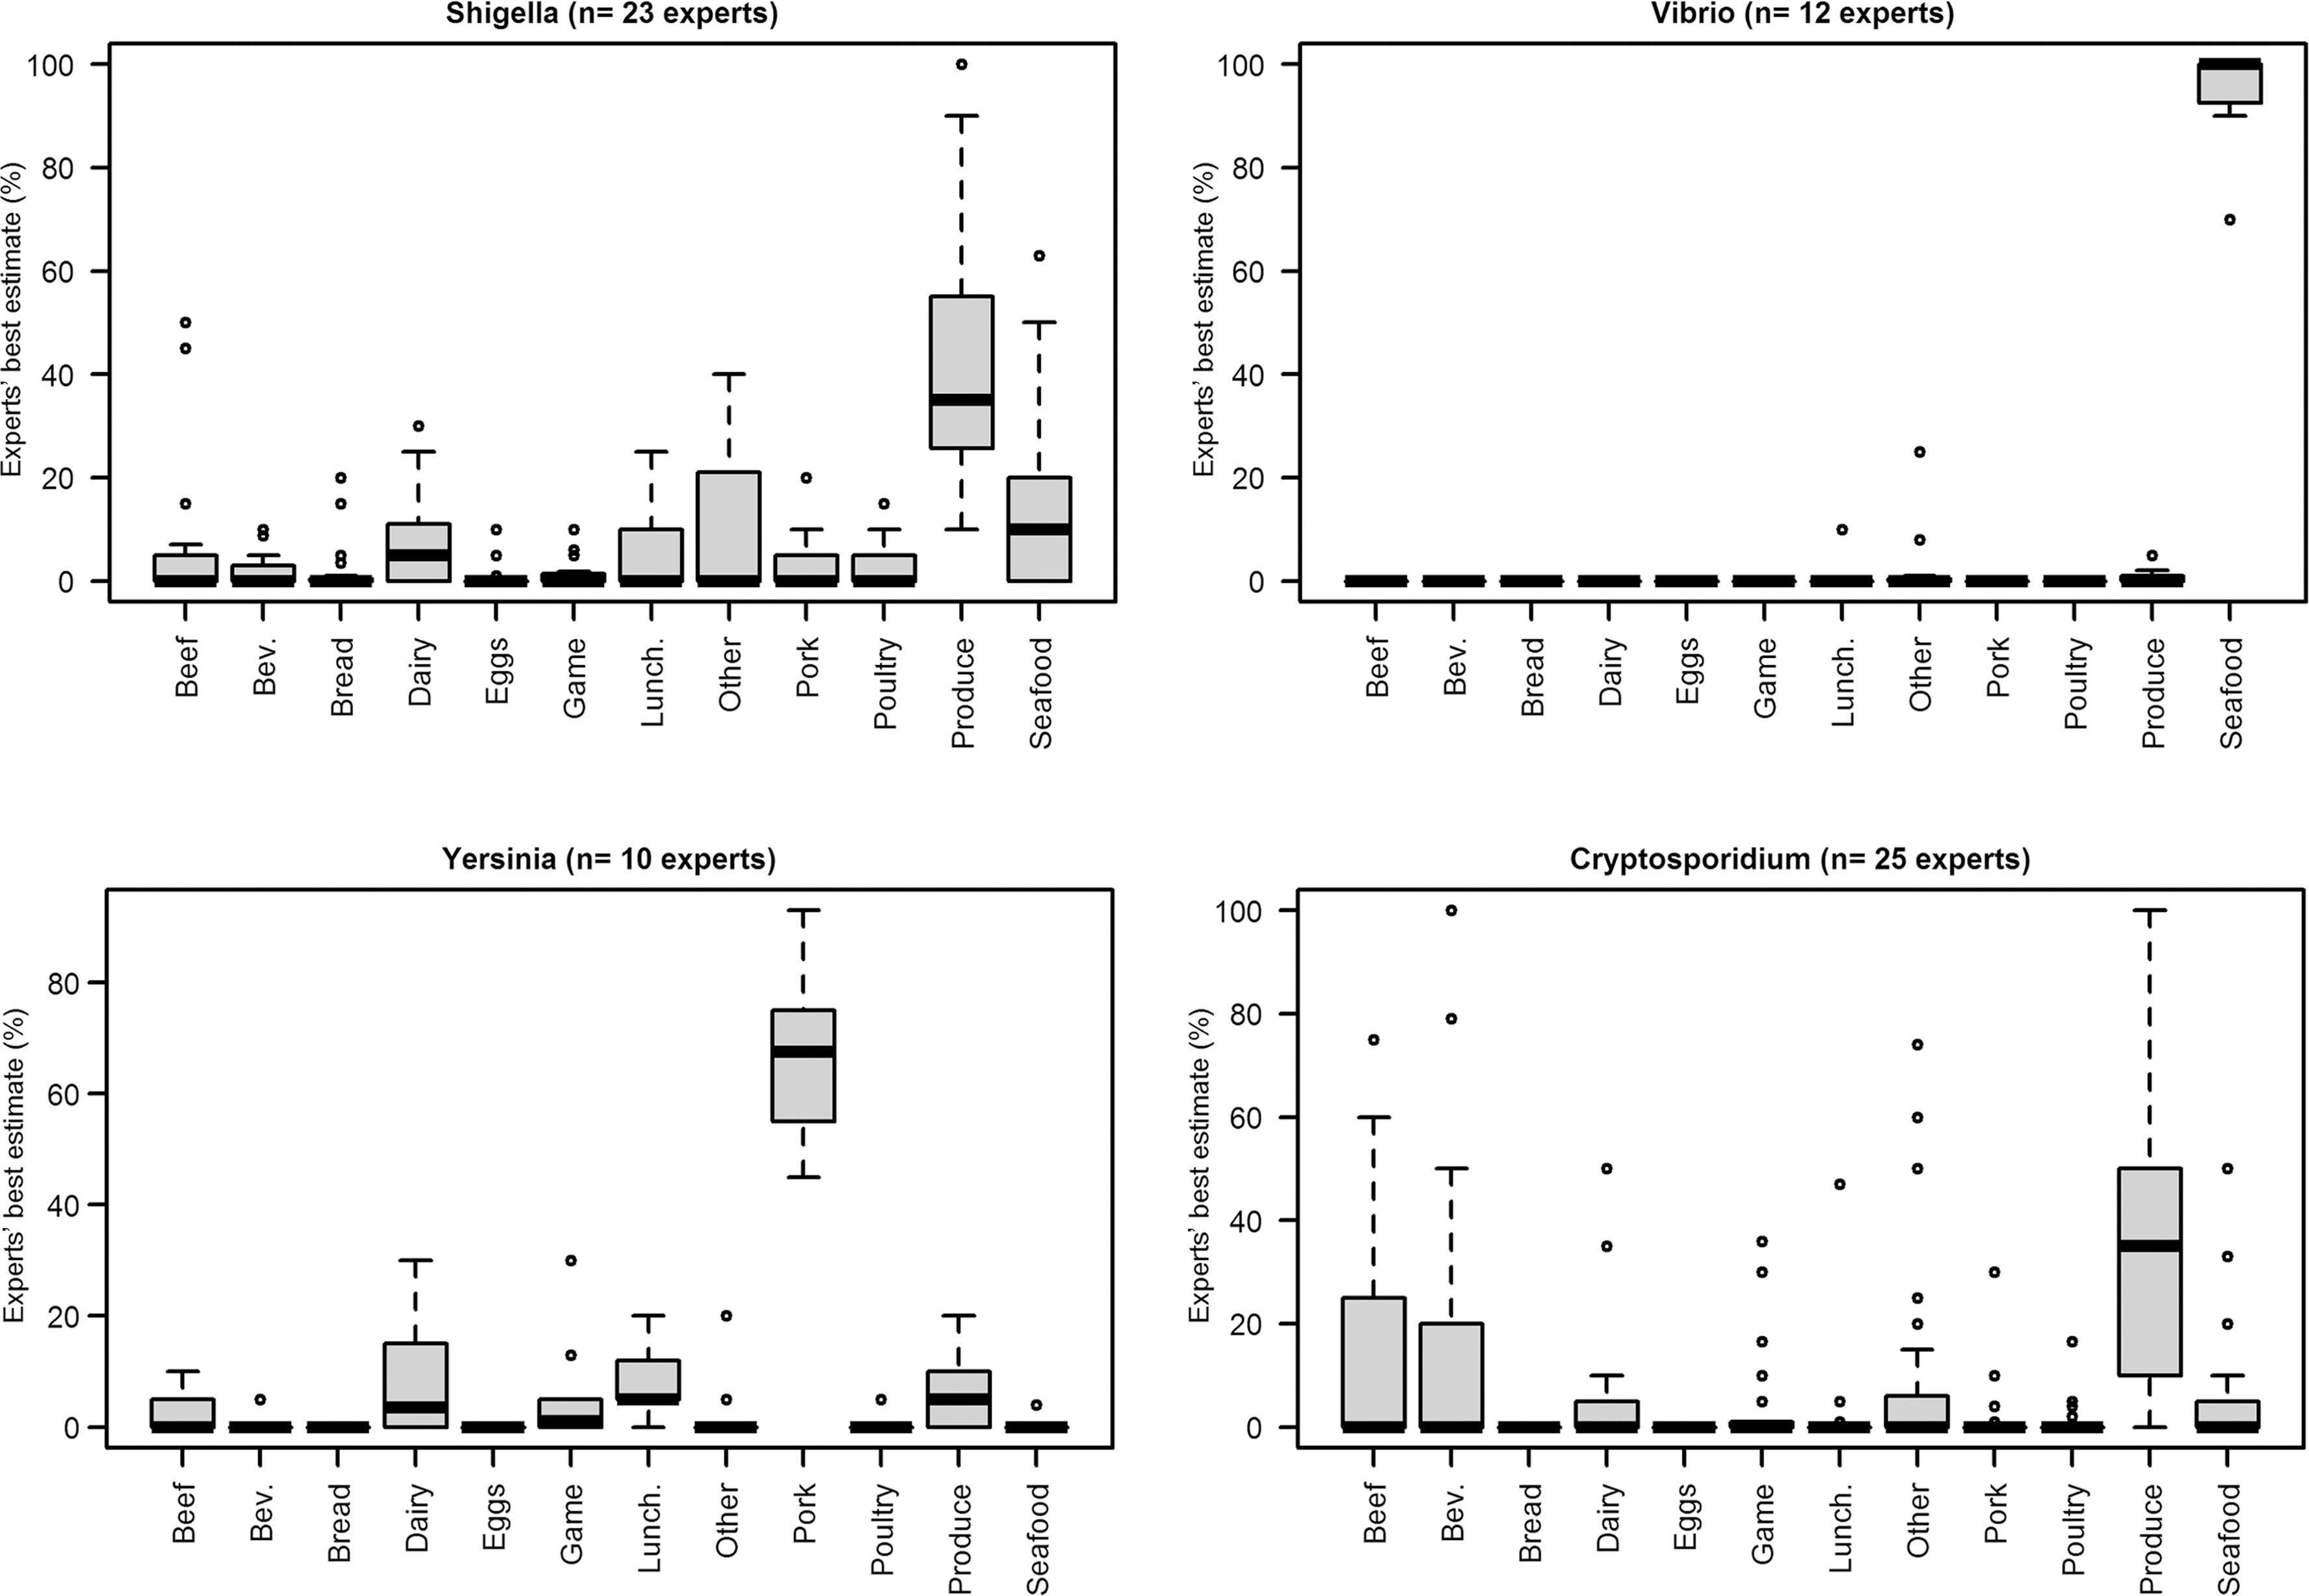
Two of three experts agreed.
The linear opinion pools for food source attributions combined the best estimates as well as the uncertainty each expert provided for their estimates. Equal weighting was given to each expert's distribution because their self-assessments of pathogen expertise were 3 or higher and assigning different weights would have been entirely subjective. We did not include experts who provided a best estimate but not 5th and 95th confidence intervals because we could not estimate a probability distribution without knowledge of the uncertainty in their estimate.
For all nine pathogens, we used fitted beta distributions to characterize the variability in experts' estimates for each food category. Beta distributions were chosen because the linear opinion pools were generally nonsymmetrical distributions as shown in Figure 2. Figure 2 includes examples selected to show fitted and actual distributions for low and high attribution estimates as well as the extent of uncertainty in the estimates. The fitted parameters (a and b) as well as the mean values for the beta distributions are compared with the mean and median values for the observed linear opinion pools in Table 5. Based on visual comparisons of the fitted distributions and the aggregated distributions of experts' opinions, beta distributions were reasonable approximations in many cases. However, beta distributions were not good representations for some food source–pathogen combinations (e.g., salmonellosis in eggs shown in Fig. 2) and alternative representations of the uncertainty in attribution proportion should be considered for these cases. The entire set of graphs (nine pathogens by 12 food categories) is available online at
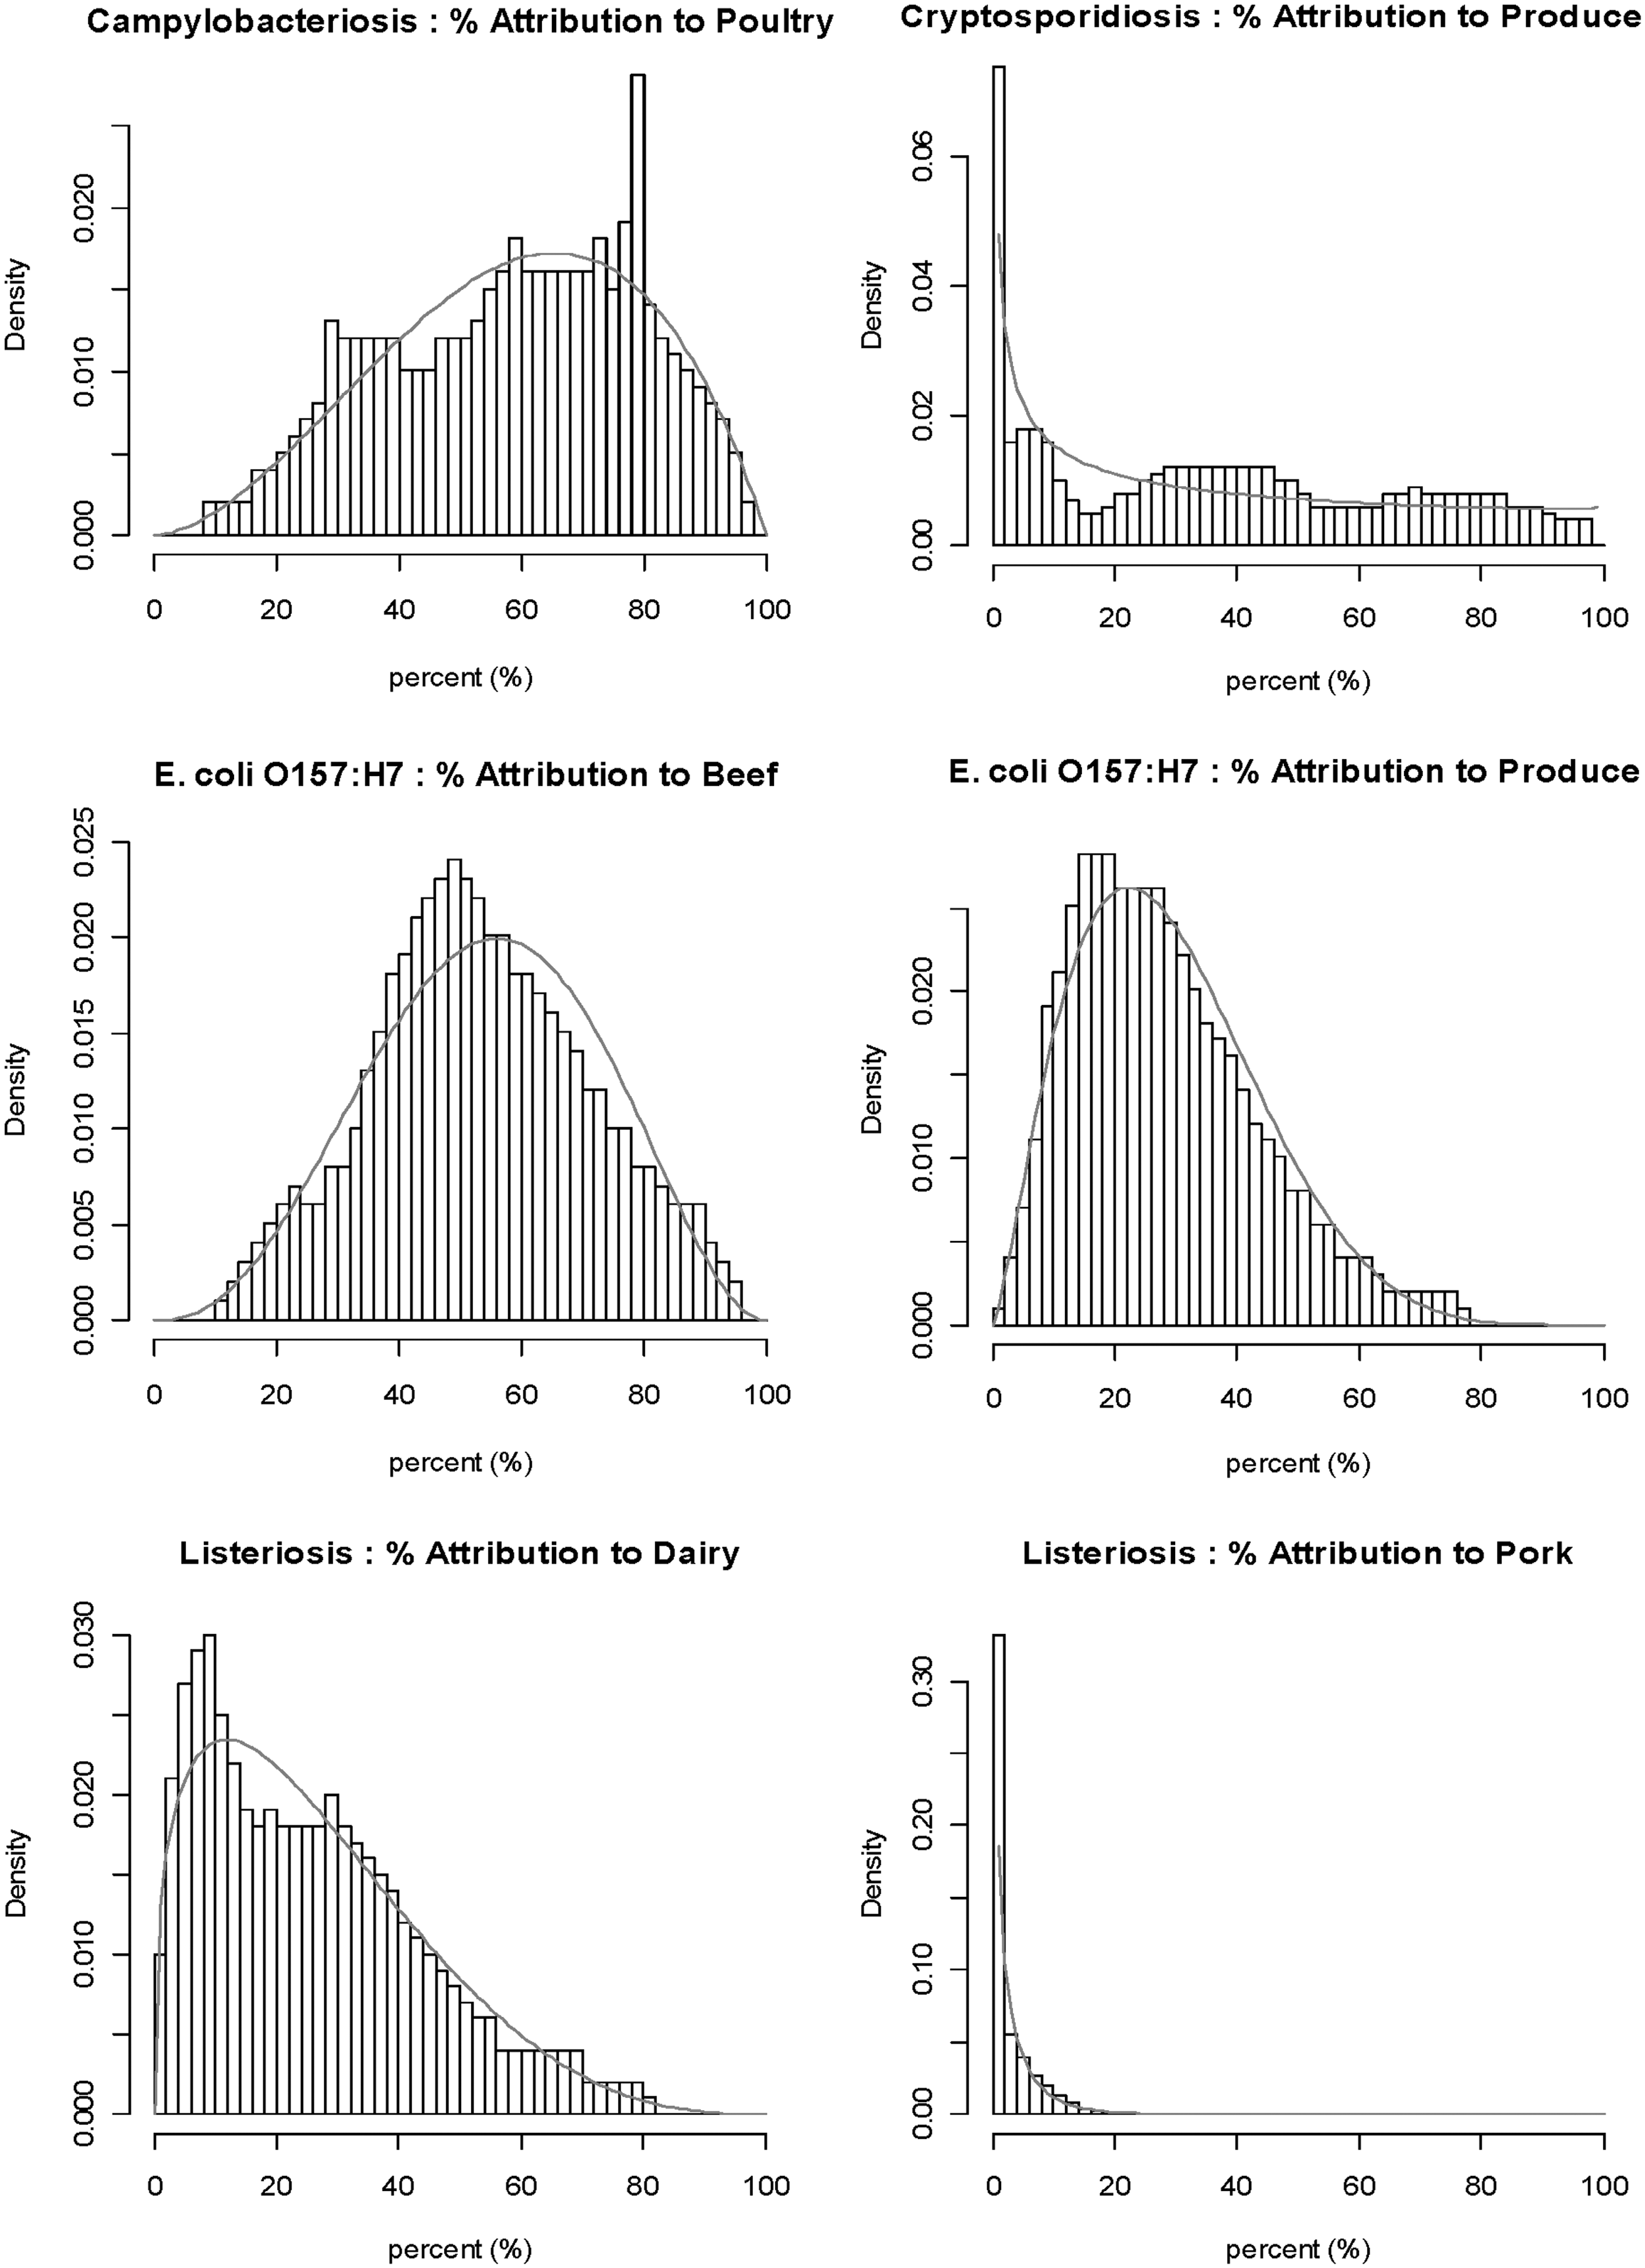
Examples of combined distributions and fitted beta distributions.
Mean of fitted beta distribution calculated as a/(a+b).
The mean attribution value for each food source showed that certain foods are considered major sources of some pathogens. The experts attributed more than 50% of the foodborne illnesses to the following sources: poultry for Campylobacter spp., beef for E. coli O157:H7, luncheon meat for L. monocytogenes, seafood for Vibrio spp., and pork for Y. enterocolitica (Table 5). For E. coli O157:H7 and L. monocytogenes, produce and dairy were also identified as important food categories compared with others. For nontyphoidal Salmonella, three food categories were identified as important food vehicles: poultry, eggs, and produce. A few categories were identified as important vehicles of Shigella spp., C. parvum, and Norwalk-like virus but with large variability between experts and significant uncertainty in the pooled estimates (Fig. 1 and Table 5). Experts indicated that the “other” category was a minor contribution to foodborne illness for most of the pathogens; only two pathogens, C. parvum and Shigella spp., had mean estimates above 10% for this category. Prepared foods, particularly multi-ingredient salads and various ready-to-eat foods, were listed in the “other” category for Shigella spp. Although eight experts indicated “other” foods as sources of C. parvum, no one provided details about specific foods.
Discussion
This elicitation survey included a large number of experts compared with others that have been reported in recent literature (Havelaar et al., 2008; Lake et al., 2010). It was not surprising to find diversity in the experts' opinions for foodborne proportion as well as food source attribution of illness. The extent of the disagreement with experts clustered in two distinct subgroups for certain pathogens was not expected, however, and has not been reported by others. We used external information to choose one subgroup so that we could characterize uncertainty in the food-specific attributions due to experts' uncertainty and lack of agreement within a subgroup. We recognize that others may prefer to pool all of the opinions for both subgroups and these data can be obtained from the authors.
As each expert provided a best estimate as well as the 5th and 95th confidence limits for their estimate, a triangular probability distribution was an appropriate representation of the uncertainty in each expert's estimate and we could use linear aggregation to estimate an overall summary of the opinions. Clemen and Winkler (1999) discussed a variety of methods to combine probability distributions from experts in risk analysis and recognize that the linear opinion pool is easily understood and satisfies “unanimity” and “marginalization” properties. Another mathematical approach is logarithmic or multiplicative averaging. However, many of the response sets for pathogen–food categories included some experts who did not consider the food as a source and other experts who did. If a food is considered as a nonsource, then pi(θ) is zero for all attribution values (θ) above 1% and multiplicative averaging produces a trivial result.
Linear aggregation was a useful approach for including the uncertainty in experts' estimates. It represented conflicting opinions but did not resolve differences or bring the experts to closer consensus. This would require interactions among the experts to share information and discuss their estimates. Although this was not part of the protocol for this elicitation survey, we think that future surveys should include some discussion among experts through face-to-face meetings or electronic communication methods, particularly for large groups of experts. However, recognizing the potential to introduce bias, the interactions must be carefully planned and monitored.
Comparisons with results from other expert elicitations are difficult because different methodologies have been used, an important point being dissimilar food categories, and there are inherent differences between countries because of methods of food production and consumption patterns. Despite the fact that this first expert elicitation on food attribution in Canada followed a methodology applied in the United States (Hoffmann et al., 2006), only a limited comparison of the results was possible. Hoffmann et al. (2008) suggested the creation of a mixture probability distribution based on triangular probability distributions for experts' opinions. However, they showed an example for Campylobacter–poultry only. Although characteristics such as the mean and percentiles of the mixture distribution were not defined, it is clear that the mode (about 87%) was higher than the mode estimate of 60% in our study. Mean values of the attribution estimates reported for pathogen–food pairs in the U.S. survey (Hoffmann et al., 2006) were based on the experts' best estimates and so they are not directly comparable to the mean values of the pooled distributions based on best estimates as well as the uncertainty of individual experts. However, both studies highlight the same top food vehicle for all nine illnesses and the same second highest source for five of them. Experts in both countries had similar opinions for some illnesses such as listeriosis or nontyphoidal salmonellosis.
We chose beta distributions to represent the aggregated estimates because the upper and lower bounds were 0% and 100%, respectively, and the distribution shape was flexible. The fitted distributions were reasonable approximations for most of the food source attributions and they are useful for further analyses that we plan to carry out. For example, we will use the distributions for foodborne proportion (Ravel et al., 2010) and food source attribution to estimate the uncertainty in DALY estimates for food–pathogen combinations. This is an important factor in the ranking of microbial risks in terms of health impact.
Footnotes
Acknowledgments
The authors thank Sandra Hoffmann from Resources for the Future, Washington, DC, and Paul Fishbeck from Carnegie Mellon University, Pittsburgh, PA, for their advice and permission to use their survey tool. The authors also thank all experts who helped build the expert list and those who answered the survey. Financial support from the Strategic Grants program of the Natural Sciences and Engineering Research Council (NSERC) of Canada to undertake this work is gratefully acknowledged.
Disclosure Statement
No competing financial interests exist.