
Abstract
Cross-contamination to fruit and vegetables can readily occur through contaminated surfaces; thus, there is a need to develop methods to inactivate microorganisms on the surfaces of various materials. The aim of this study was to develop methods to reduce the levels of Escherichia coli on the surfaces of various materials and to develop a predictive model as a function of chlorine concentration and exposure time. The reduction of E. coli on the surfaces of stainless steel, plastic, wood, rubber, glass, and ceramic at various chlorine concentrations (0–200 ppm) after a 0–5-min exposure was evaluated. The surface treatment at the maximum chlorine concentration (200 ppm) over a 5-min exposure reduced the E. coli contamination levels to 5.30, 5.18, 3.34, 4.69, 5.05, and 5.53 log CFU/cm2 on the surfaces of stainless steel, plastic, wood, rubber, glass, and ceramic, respectively. Using these results, predictive models for the reduction of E. coli on surfaces of various materials using chlorine treatment were developed. Each model was significant (p<0.05) and defined as fit by the lack of fit and probability of normal residuals. It has measured the R 2 value to 0.9746. Therefore, the models presented in this study could be used to determine the minimum concentrations of chlorine and exposure times needed to control E. coli on the surfaces of various materials.
Introduction
P
A previous study (Kusumaningrum et al., 2002) reported that pathogenic microorganisms contaminated on the surface of stainless steel can cross-contaminate fruits or vegetables. Stauffer (1971) previously emphasized the need to develop countermeasures against cross-contamination from hands, sinks, knifes, and chopping boards. Bryan (1982) analyzed the factors responsible for foodborne outbreaks from school meals in the United States and found that the primary sources of outbreaks were cross-contamination (6%) and inadequately washed utensils (9%).
Thus, appropriate control to prevent pathogen contamination on the surface of utensils or equipment is necessary. A diverse range of different methods of disinfection have been developed to control pathogen contamination. Among these methods, the chemical method is preferred because it is convenient and economical (Kim et al., 2006). Ethanol, chlorine, quaternary ammonium, and peroxides are the principal chemical disinfectants, where chlorine is the most widely used disinfectant (83.6%) in Korea (KFDA, 2009; Ha and Ha, 2010). Chlorine is the most commonly used disinfectant due to its convenience, safety, low cost, residual biocide effect, and superior efficacy against the inactivation of bacteria. Internationally, the concentrations of chlorine at 50 to 200 ppm were popular in food manufacturing and food services. The legal maximum concentration of chlorine permitted is 200 ppm for food preparation in South Korea. However, it is difficult to estimate the efficiency of disinfectants used in actual conditions like in the food industry (Bloomfield et al., 1994) because the surface of materials can affect viability and the adhesive power of microorganisms (Peng and Tasi, 2001) and there are differences between experimental conditions and food industrial conditions (Cremieux et al., 2001).
Therefore, the goal of this study was to test methods for reducing E. coli on the surfaces of various materials and to develop a predictive model as a function of chlorine concentration and exposure time.
Materials and Methods
Test organisms and preparation of inoculum
The E. coli strain ATCC 10536 was used in this study, which is the official strain used in AOAC, European CEN, and KFDA for testing the sterilization efficacy of sanitizers. Stock cultures kept at −70°C in 15% (w/v) glycerol were inoculated into 10 mL of tryptic soy broth (Difco Laboratories) and incubated at 37°C±1°C for 24±1 h. Inoculated bacteria were transferred to tryptic soy agar (TSA; Difco Laboratories) and incubated at 37°C±1°C for 24±1 h to activate the bacteria. Bacteria cultured in TSA were suspended in an aqueous 0.1% (w/v) tryptone and 0.85% (w/v) sodium chloride solution using inoculating loops, and the initial number of bacteria was adjusted to 8 log CFU/mL using a UV-visible spectrophotometer at 600 nm (Agilent Technologies Inc.). After adjusting the log CFU/mL, the bacterial culture was maintained at 20°C±1°C for 2 h before the experiment was started. To measure the initial number of bacteria, l mL of the suspension was inoculated in TSA using the pour plate method and incubated at 37°C±1°C for 48 h.
Preparation of food-contact surface materials
Stainless steel (Posco Co., Ltd., SUS 304 2B), plastic (HDPE; Daesung Industry Co.), wood (Heilongjiang Zhongji IMP & EXP), rubber (KOMAX Industrial Co., Ltd.), glass (Gukje Yuri), and ceramic (HankookChinaware Co., Ltd.) were selected as representative materials used by the food industry. Coupons with dimensions of Φ 1 cm×5 mm were produced with the selected materials. Produced coupons were washed with quaternary ammonium. After rinsing with PBS, the coupons were soaked in 70% ethanol and dried on filter paper (Watman International Ltd.) at 37°C. Dried coupons were placed in a sealed bottle and autoclaved at 121°C. In the case of rubber, the coupon was soaked in 70% ethanol for 2 h and dried in a desiccator before the start of the experiment.
Treatment of coupon surfaces with chlorine
Chlorine was used as the effective component in the disinfectant. The disinfectant used in this study (4% of hypochlorous acid, sodium salt; Yuhanclorox Co.) is the most widely used disinfectant in the food industry. The concentrations of the chosen disinfectant were determined based on the guidelines outlined by the KFDA. The maximum concentration of chlorine was 200 ppm (KFDA, 2004) and the exposure time was 5 min. The concentrations and exposures used in this study were determined through the central composite experiment design (CCD). The actual CCD models of chlorine concentration and treatment time set from 0 to 200 ppm at the range of the factor and from 0 to 5 min, respectively. The predictive equation was designed for factors coded from −1 at the low to +1 to the high at the range of the factors too.
Hard water was used to dilute the disinfectants so that the experimental conditions were similar to the food industrial conditions. To produce hard water, 3 mL of solution A (MgCl2 19.84 g+CaCl2 46.24 g/L) and 8 mL of solution B (NaHCO3 35.02 g/L) were mixed with l L of sterilized water and filtered with 0.45 μm filter paper (pH 6.8).
To test the efficiency of chlorine as a disinfectant on each material, autoclaved coupons were put on a glass board (2.5×5 cm) in a clean bench. Ten microliters of the prepared suspension was inoculated on each coupon and dried for 30 min at room temperature. After drying, the coupons were treated with the disinfectant at each chlorine concentration and exposure time. The efficacy of disinfectants was estimated using a modified European CEN EN 1276 method (Dilution-Neutralization Method) based on quantitative suspension testing. The KFDA uses the CEN EN 1276 as an official method (Kim et al., 2005). Each coupon was then placed in tubes containing 9.95 mL of neutralizer (lecithin 3 g, polysorbate80 30 g, sodium thiosulfate 5 g, L-histidine 1 g, and saponine 30 g were mixed in distilled water 1 L and autoclaved) to neutralize the effective components. Sterilized saline solution was used in the negative control.
Analysis of bacteria
After neutralizing, tubes including the coupons were sonicated (80 kHz) to separate E. coli from the coupons. One mL of the solution in the tubes was inoculated in TSA using the pour plate method and incubated at 37°C±1°C for 24±1 h. The population of cells surviving treatment was determined as counting colonies on the medium and expressed as log CFU/cm2. Reduction values (R) were calculated using the surviving cell difference data obtained from the experiment.
Statistical analysis
All experiments were replicated three times. In experiments involving chlorine treatment, six coupons were examined in each replicate. Data were analyzed using the response surface methodology (RSM) of Design Expert 7 (version 7.1.5, Sate-Ease Inc.) to measure the reduction of E. coli on each material by chlorine treatment and to form predictive models. In addition, analysis of variance (ANOVA) was performed to verify the significance and compatibility of the models.
Results
Effect on concentrations and exposure times of chlorine
Figure 1 shows the results of reduction values of E. coli on various materials with treatment of chlorine. The reduction values after treating each contaminated coupon with the maximum chlorine concentration (200 ppm) and exposure times (5 min) were 5.13, 5.18, 3.34, 4.69, 5.05, and 5.53 log CFU/cm2 on the surfaces of stainless steel, plastic, wood, rubber, glass, and ceramic, respectively. Moreover, the reduction value increased when the exposure time was increased. On stainless steel, the reduction value was greater than 5 log when the exposure time was 4.7 min at the maximum chlorine concentration (200 ppm). A reduction value greater than 5 log was also observed on plastic, glass, and ceramic at exposure times of 4.8, 4.8, and 4.4 min, respectively. However, wood and rubber showed reduction values that were <5 log at an exposure time of 5 min. Figure 2 shows the results of treating the surfaces of stainless steel and ceramic containing E. coli with chlorine. This figure indicates the significant effect of concentrations and exposure times on reduction of E. coli with treatment at up to 200 ppm chlorine and 5 min exposure.

Reduction values of Escherichia coli on various materials with treatment of chlorine at 200 ppm and 5 min exposure.
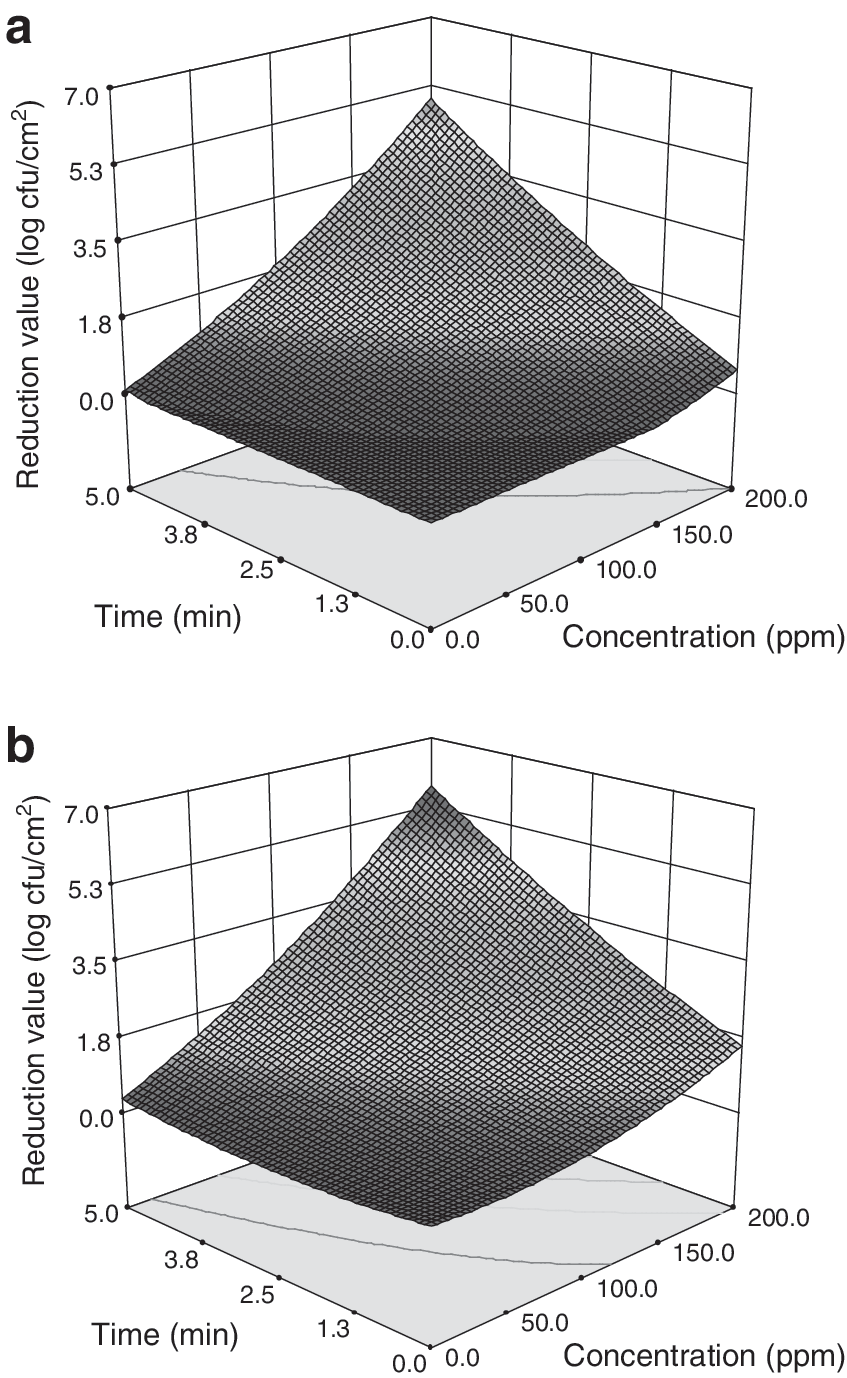
Response surface plots of the interaction of [concentration of chlorine]×[exposure time] for the reduction values of E. coli on various surfaces. (
Predictive model for the reduction of E. coli on each coupon with chlorine
Predictive models were developed to estimate the reduction of E. coli on surfaces by chlorine treatment. Table 1 shows the quadratic polynomial equations that were calculated using the RSM to predict the reduction of E. coli based on chlorine concentration and exposure time. Models were obtained for each material.
R, reduction value; χ1, concentration of chlorine; χ2, exposure time.
Analysis of variance
ANOVA was conducted to determine the efficiency and compatibility of the predictive models. The p-value of stainless steel model was below 0.05 and the lack of fit was 0.3891. The coefficient of determination (R-square) indicated that the certainty of the model's data was close to 1 (R 2=0.9746). The p-value of interaction between the concentration and exposure time was also below 0.05. In the case of plastic, the p-value of the model was below 0.05, lack of fit was 0.1927, and R 2 was 0.9488. The interaction between the concentration and exposure time of chlorine on plastic was significant (p<0.05). The model for wood was significant (p<0.05), the lack of fit was 0.6378, the R 2 was 0.9121, and the p-value of the interaction was above 0.05. The p-value for the model of rubber was below 0.05, and the lack of fit and R 2 were 0.0613 and 0.8424, respectively. The interaction between chlorine concentration and exposure time for rubber was not significant (p>0.05). In the model of glass, the p-value was below 0.05, the lack of fit was 0.2063, and the R 2 was 0.9416. In addition, the interaction between the chlorine concentration and exposure times on the surface of glass was significant (p<0.05). The model of ceramic was significant (p<0.05), and its lack of fit and R 2 were 0.9900 and 0.9803, respectively. Further, the interaction between chlorine concentration and exposure time for ceramic was significant (p<0.05).
Standardized residuals of the normal probability
Standardized residuals of the normal probability were used for diagnosing the fitness of the models (Fig. 2). When the error distribution of the model followed a normal distribution, the model was considered normal. Therefore, if residuals followed a straight line, a normality of errors was accepted. The plots in Figure 2 show that the residuals adopted a straight line; thus, normality of all models can be assumed.
Model validation
To evaluate the reliability of the models mathematically before practical application, an additional seven conditions were randomly evaluated within the range of the experimental design. Each condition (10 ppm, 4.5 min; 25 ppm, 4 min; 50 ppm, 3.5 min; 85 ppm, 3 min; 120 ppm, 2 min; 150 ppm, 1.5 min; 180 ppm, 1 min) was applied on all the materials. Figure 3 shows the comparative plot between the observed and predicted reduction value of E. coli for purposes of validation. Most of the points were relatively proportion to the y=x line, indicating satisfactory performance of the predictive model.
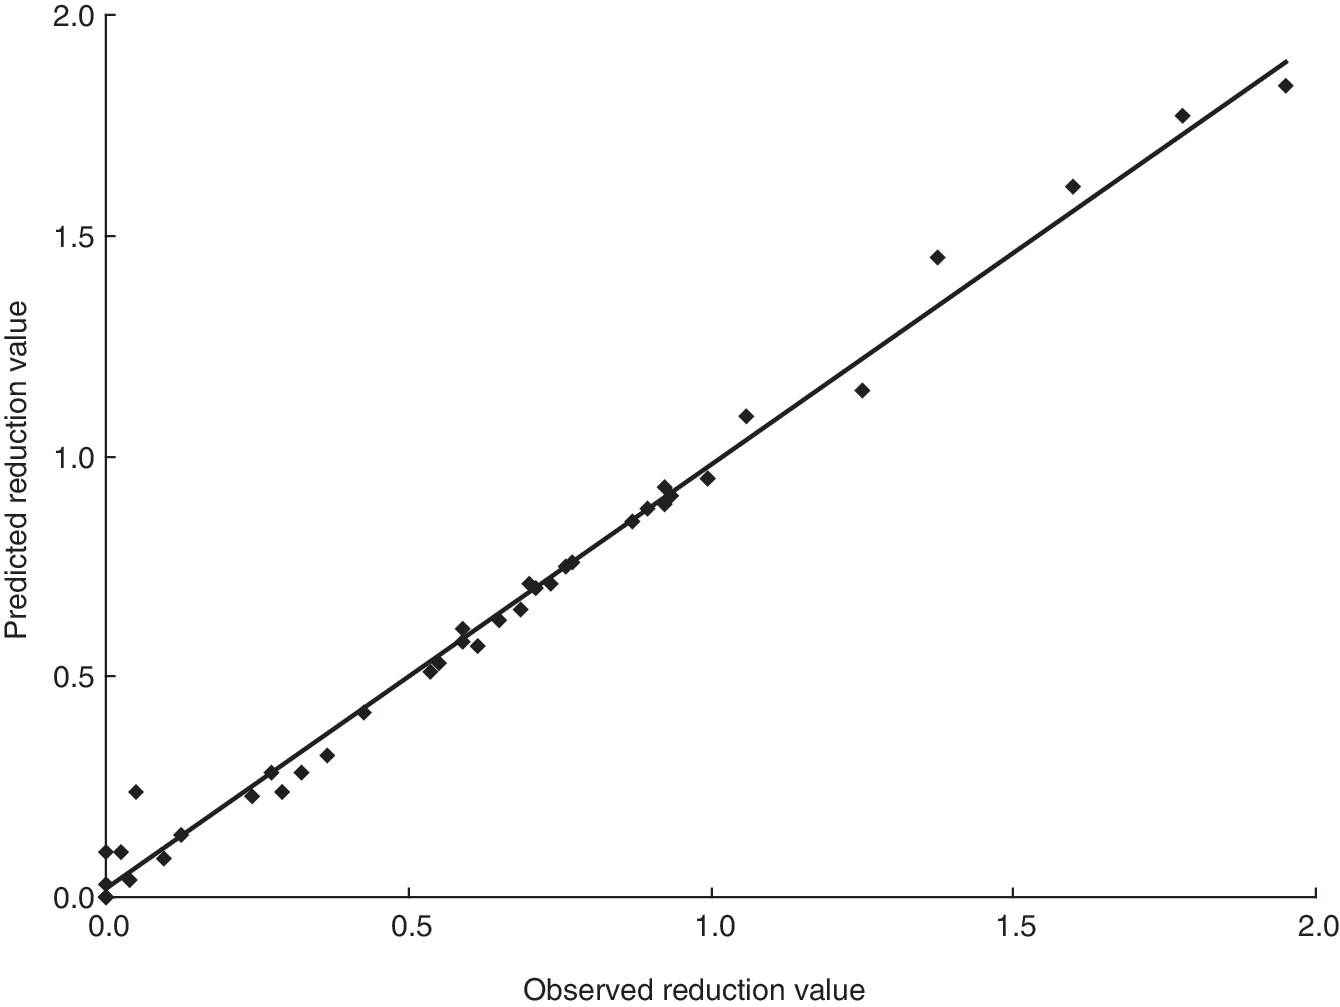
Comparison of the observed and predicted reduction value of E. coli on the surface of materials for validation.
Discussion
The KFDA stated that officially approved disinfectants have to reduce E. coli ATCC 10536 (or ATCC 11229) and S. aureus ATCC 6538 by over 99.999% (5 log) at 20°C±1°C and at an exposure time of 5 min in suspension (KFDA, 2004). In this study, treatment with chlorine fell within these guidelines for wood since chlorine reduced E. coli ATCC 10536 by <5 log.
Hypochlorous acid, which was used in this study, has significant germicidal power. Lee et al. (2010a, 2010b) reported that chlorine (100 ppm) can reduce Bacillus cereus spores on contaminated raw rice and stainless steel by >2 log after exposure for 5 min. Kim et al. (2006) found that 50 ppm of hypochlorous acid could reduce E. coli by 99.999% after exposure for 5 min in a test tube. In this study, when coupons contaminated with E. coli were treated with 50 ppm of hypochlorous acid, the reduction value of E. coli on each coupon was <1 log. The reason for this discrepancy was that the bacterial suspension was treated directly with chlorine (Kim et al., 2006). Ronner and Wong (1993) demonstrated that dried bacteria are more resistant to disinfectants than bacteria in suspension. Ryu and Beuchat (2005) and Kim et al. (2007) also reported that a biofilm of E. coli on stainless steel was resistant to chlorine treatment. In our study, we presumed that E. coli had formed biofilms because the reduction value of E. coli on each coupon was lower than previous reports of the examined E. coli reduction in suspension. Moreover, the durability of the germicidal power of chlorine is not longer than other disinfectants (Kang, 2005).
The effectiveness of chlorine was shown to depend on exposure time. Chlorine reduced E. coli on all of the coupons within 5 min except for rubber and wood. The reduction values on rubber were close to 5 log at an exposure time of 5 min. However, the reduction value on wood was not higher than 3.5 log at an exposure time of 5 min. These results can be explained by the fact that wood readily absorbed the bacterial suspension during the inoculation step; thus, although the wood appeared dry after 30 min of drying in sterile air, the inner region of the wood still remained wet and retained most of the bacteria. These findings are in agreement with the results of Deza et al. (2007). Friedrich et al. (2009) used chlorine to treat wooden boards contaminated with Alicyclobacillus spp. spores and found that the disinfectant had very little effect on reducing the number of spores on wood surfaces, which was attributed to the porous nature of wood. Therefore, flushing with sterilized gauze should also be used to disinfect the surface of wood (Lee et al., 2000). Plastic, glass, and ceramic are hydrophilic materials known to limit bacterial adhesion (Chamberlain, 1992). These materials have a low solid-solution interfacial energy and the cell and surface are similarly charged (Bower et al., 1996). In the present study, SUS 304 2B including copper was used as stainless steel. When copper decomposes to Cu2+ it can react with coenzyme A (CoA-SH), thereby acting as a catalyst in the respiratory process of bacteria, resulting in deactivation of the enzyme (Kim and Ryu, 2001). In addition, because these Cu ions extract electrons from the bacteria and act as a strong reduction, causing leakage of the cytoplasm and oxidization of the nucleus, Cu ions can eliminate bacteria (Jo et al., 2010). Therefore, E. coli can be more strongly inactivated on stainless steel than other materials, which was observed in this study.
ANOVA, standardized residuals of the normal probability, and model validation were used to validate the fitness and reproducibility of the models. These are same methods that were used by Heo et al. (2009), which predicted the growth of Bacillus cereus in cooked rice. All of models developed in this study were shown to be appropriate predictive models. Yeon et al. (2006) showed that the efficacy of disinfectants was affected by exposure time, concentration, temperature, pH, organic matter, strain of bacteria, and the contactable surfaces. Despite the findings, Lee et al. (2007) reported that most people in the food industry have not examined these other factors; thus, the disinfectants used by the food industry may not be completely effective.
In conclusion, we examined the ability of chlorine to eliminate E. coli on the surfaces of various materials and developed appropriate predictive models of the disinfectant power of chlorine as a function of concentration and exposure time. In addition, the models were validated using a statistical technique. Thus, the minimum chlorine concentration and exposure time for reduction of E. coli can be calculated using the developed predictive models. If these models are used by the food industry, they can save money by limiting the amount of disinfectants used while maximizing the germicidal effectiveness of the disinfectants.
Footnotes
Acknowledgments
This study was supported by the Basic Science Research Program through the National Research Foundation of Korea (NRF) funded by the Ministry of Education, Science and Technology (2009-0085532).
Disclosure Statement
No competing financial interests exist.