
Abstract
Data generated using different antimicrobial testing methods often have to be combined, but the equivalence of such results is difficult to assess. Here we compared two commonly used antimicrobial susceptibility testing methods, automated microbroth dilution and agar disk diffusion, for 8 common drugs, using 222 Salmonella isolates of serotypes Newport, Typhimurium, and 4,5,12:i-, which had been isolated from clinical salmonellosis cases among cattle and humans. Isolate classification corresponded well between tests, with 95% overall category agreement. Test results were significantly negatively correlated, and Spearman's correlation coefficients ranged from −0.98 to −0.38. Using Cox's proportional hazards model we determined that for most drugs, a 1 mm increase in zone diameter resulted in an estimated 20%–40% increase in the hazard of growth inhibition. However, additional parameters such as isolation year or serotype often impacted the hazard of growth inhibition as well. Comparison of economical feasibility showed that agar disk diffusion is clearly more cost-effective if the average sample throughput is small but that both methods are comparable at high sample throughput. In conclusion, for the Salmonella serotypes and antimicrobial drugs analyzed here, antimicrobial susceptibility data generated based on either test are qualitatively very comparable, and the current published break points for both methods are in excellent agreement. Economic feasibility clearly depends on the specific laboratory settings, and disk diffusion might be an attractive alternative for certain applications such as surveillance studies.
Introduction
Susceptibility testing methods can be grouped into three categories: diffusion, dilution, and diffusion-dilution methods (Alexander et al., 2009). Diffusion methods such as the method first described by Bauer et al. (1966) require little specialized equipment and are easily customizable (Bauer et al., 1966; Jorgensen, 1993; NCCLS, 2003b). Briefly, a test organism suspension is plated on bacterial culture plates, paper disks containing the test drug are deposited on the inoculated plate, and plates are incubated (Alexander et al., 2009). Plates are subsequently inspected for bacterial growth, and the zone of growth inhibition surrounding the paper disk is measured. Zone diameters are used for isolate classification according to standards established by the Clinical and Laboratory Standards Institute (CLSI). Several drugs can be tested on the same plate. However, results are not directly interpretable in terms of inhibitory drug concentration, and small variations in test procedure can distort results (Jorgensen, 1993).
In contrast, dilution methods allow for high sample throughput and quantitative inference regarding the minimal inhibitory concentration (MIC) needed to inhibit bacterial growth in vitro, but are associated with higher costs (Jorgensen, 1993). Wells containing dilutions of the test drug are inoculated with the test organism and incubated, and the MIC that inhibits bacterial growth in vitro is determined. Test drugs are most commonly diluted in twofold dilution series, potentially leading to broad ranges of concentrations being summarized by one MIC value (Turnidge and Paterson, 2007). CLSI has published interpretive standards for some drugs, which take the antimicrobial drug concentration attainable in blood or tissue under consideration (Alexander et al., 2009). However, CLSI standards are based on human data, and extrapolation to other species, serotypes or pathogens may not necessarily be appropriate (Constable, 2004).
Here we compare microbroth dilution and agar disk diffusion-based antimicrobial susceptibility testing for 8 common antimicrobial drugs and a set of 222 Salmonella isolates. Notably, Salmonella isolates were selected to represent the Newport, Typhimurium, and 4,5,12:i:- strains circulating among human and bovine cases of clinical salmonellosis in the north-eastern United States, and therefore likely represent realistic testing conditions. In addition to an analysis of category agreement and error rates, we compared MIC and zone diameter values using correlation coefficients and survival analysis. To explore financial feasibility, we calculated the per-sample costs associated with each test.
Materials and Methods
Isolate selection
Non-typhoidal Salmonella enterica subsp. enterica isolates from bovine (n=150) and human (n=72) sources representing serotypes Typhimurium (n=76), 4,5,12:i:- (n=32), and Newport (n=114) were collected as part of a previous study (Hoelzer et al., 2010). All isolates were collected between 2004 and 2005 from cases with clinical signs of salmonellosis; human-source isolates were obtained from the Wadsworth Center, New York State Department of Health, whereas bovine-source isolates were collected from dairy cattle on 57 farms in New York and Vermont and were obtained via the New York State Animal Health Diagnostic Center. Isolation was performed using standard culturing techniques as previously described (Cummings et al., 2010), and confirmed Salmonella isolates were sub-streaked to ascertain presence of pure cultures.
Agar disk diffusion based antimicrobial susceptibility testing
Agar disk diffusion based testing was performed at the Field Disease Investigation Unit, Washington State University College of Veterinary Medicine. Susceptibility was determined as described previously (Bauer et al., 1966). Isolates were cultured in brain heart infusion broth (Hardy Diagnostics, Santa Maria, CA) and adjusted to a McFarland Standard of 0.5. Bacterial lawns were streaked onto Mueller-Hinton agar plates (Hardy Diagnostics). Antibiotic disks (Hardy Diagnostics) containing the following antimicrobial agents were used: ampicillin [10 μg], amoxicillin-clavulanic acid [20 and 10 μg], chloramphenicol [30 μg], kanamycin [30 μg], gentamicin [10 μg], streptomycin [10 μg], trimethoprim-sulfamethoxazole [1.25 and 23.75 μg], tetracycline [30 μg]. After overnight incubation at 37°C inhibition zone diameters were read using a Fowler digital caliper (Newton, MA). Results have been reported previously (Hoelzer et al., 2010). Isolates were classified as resistant or susceptible using resistance breakpoints as reported by CLSI (Table 1) (NCCLS, 2003a, 2003b).
Results are based on microbroth dilution test.
Results at or above this zone diameter were interpreted as no resistance indicated.
Kappa is used to measure test agreement that exceeds chance agreement; a value of 1 would indicate perfect agreement while a value of 0 indicates no agreement beyond that expected by chance.
McNemar's Chi-square for paired data are used here to test whether both possible disagreements between the two test (i.e., classification as susceptible by test 1 and as resistant by test 2 and vice versa) occur with the same frequency; p-values<0.05 are taken to indicate statistically significant differences.
–, not applicable; MIC, minimum inhibitory concentration.
Automated microbroth dilution-based antimicrobial susceptibility testing
Microbroth dilution-based testing was performed at the New York State Animal Health Diagnostic Center (NYSAHDC). MICs for the same eight antimicrobial agents were established using the Sensititre system (TREK Diagnostic Systems, Cleveland, OH) as detailed previously (Cummings et al., 2010). CLSI guidelines were used to interpret MIC values if available, otherwise breakpoints detailed in the National Antimicrobial Resistance Monitoring System (NARMS) were used (Table 1) (CLSI, 2008; CDC, 2009). Weekly quality control was performed using four bacterial reference strains: Escherichia coli ATCC 25922, Staphylococcus aureus ATCC 29213, Enterococcus faecalis ATCC 29212, and Pseudomonas aeruginosa ATCC 27853, representing the standard quality controls used at NYSAHDC. Quality control was performed as recommended by CLSI. Isolates with disagreeing results were re-tested using both tests. If disagreement was resolved upon re-testing, very major and major error rates were calculated as described previously (Stuckey, 2007), but the original data were used for all other analyses.
Statistical analysis
All statistical analyses were performed using SAS version 9.2 (SAS, Cary, NJ). Exact 95% binominal confidence intervals, McNemar's Chi-squared test for paired data (McNemar, 1947), and the kappa statistic were calculated, with kappa defined as follows:
Data were visualized using scatter plots. Since MIC values are approximately log-normally distributed (Turnidge and Paterson, 2007), MIC values (except gentamicin and trimethoprim-sulfamethoxazole with most MIC values in the range of 0.1–1) were log-transformed before further analysis. Spearman's rank correlation coefficients were calculated to estimate correlations between zone diameters and MICs. Cox's semi-parametric proportional hazards model (Cox, 1972) was also used, with growth inhibition, the event of interest, and concentration to event (c) replacing time to event (Stegeman et al., 2006). Since the partial likelihood method only depends on event time ranks, log-transformed and original MIC values generate identical outputs (Allison, 1995; Kalbfleisch and Prentice, 2002). Right-censoring was accounted for, but only few observations were left-censored, and because the expected impact of including left censoring was marginal, it was omitted. Ties were handled using the exact method for continuous time data in SAS version 9.2, resulting in models of the general form below (Stegeman et al., 2006).
Parametric regression models (i.e., exponential, Weibull, lognormal, loglogistic, and Gamma) were also used. Graphical diagnostic methods (i.e., survivor plots and residual plots) allowed evaluation of model fit, and nested models were compared using generalized likelihood ratio tests. Product-limit estimators were calculated when the data allowed.
Economic cost analysis
Input values to calculate labor, equipment, and consumable costs were estimated based on expert judgment and standard rates applicable at Cornell University during fiscal year 2010. Staff at Cornell University and Washington State University with relevant expertise in antimicrobial susceptibility testing provided cost and time estimates and consulted on the overall cost analysis. All cost calculations were performed in Excel version 2007, with labor costs based on current rates at Cornell University.
Results
Category agreement analysis
In total, 11 of the 222 isolates (4.9%) showed some disagreement in category classification. Category disagreement usually only affected one drug, with the exception of one isolate for which disagreement affected two drugs. For the eight drugs tested, between 0% and 3% of isolates showed some category disagreement (Table 1). Kappa values, measuring better-than-chance agreement between tests, ranged from 0.95 to 0.99 (Table 1), indicating excellent agreement. To explore whether one test was consistently more likely to classify isolates as susceptible than the other, we calculated McNemar's Chi-squared statistic (Table 1). For the combination of amoxicillin and clavulanic acid, we detected evidence of this (p=0.03), with all five disagreeing results classified as resistant by disk diffusion but susceptible by microbroth dilution. We did not detect evidence for such differences for any other drug (Table 1).
All 11 isolates with disagreement were retested. For the combination of amoxicillin and clavulanic acid all isolates remained susceptible by microbroth dilution, whereas they now also appeared susceptible by disk diffusion. If microbroth dilution results were assumed to be correct, this translates into a major error rate of 5%. Disk diffusion results for isolates with disagreement for kanamycin remained unchanged upon re-testing. However, upon re-testing by microbroth dilution two isolates now appeared susceptible, and one isolate now appeared resistant, whereas one isolate remained susceptible. If disk diffusion results were assumed to be correct, this translates into a very major error rate of 1% and a major error rate of 2%. To avoid potential bias introduced by selective re-testing of some isolates, the initial data were used for all other analyses.
Comparison of zone diameters and MICs
MICs and zone diameters were negatively correlated (Fig. 1, Table 2). Correlations were nearly perfect for ampicillin, chloramphenicol, and streptomycin, evidenced by correlation coefficients exceeding −0.95 (Table 2). Correlations were considerably weaker, yet statistically significant, for the remaining drugs, indicating that higher MICs always tended to be associated with smaller zone diameters. MICs were often censored at the resistance breakpoint, leading to many isolates reported as exceeding the breakpoint, which may distort results.
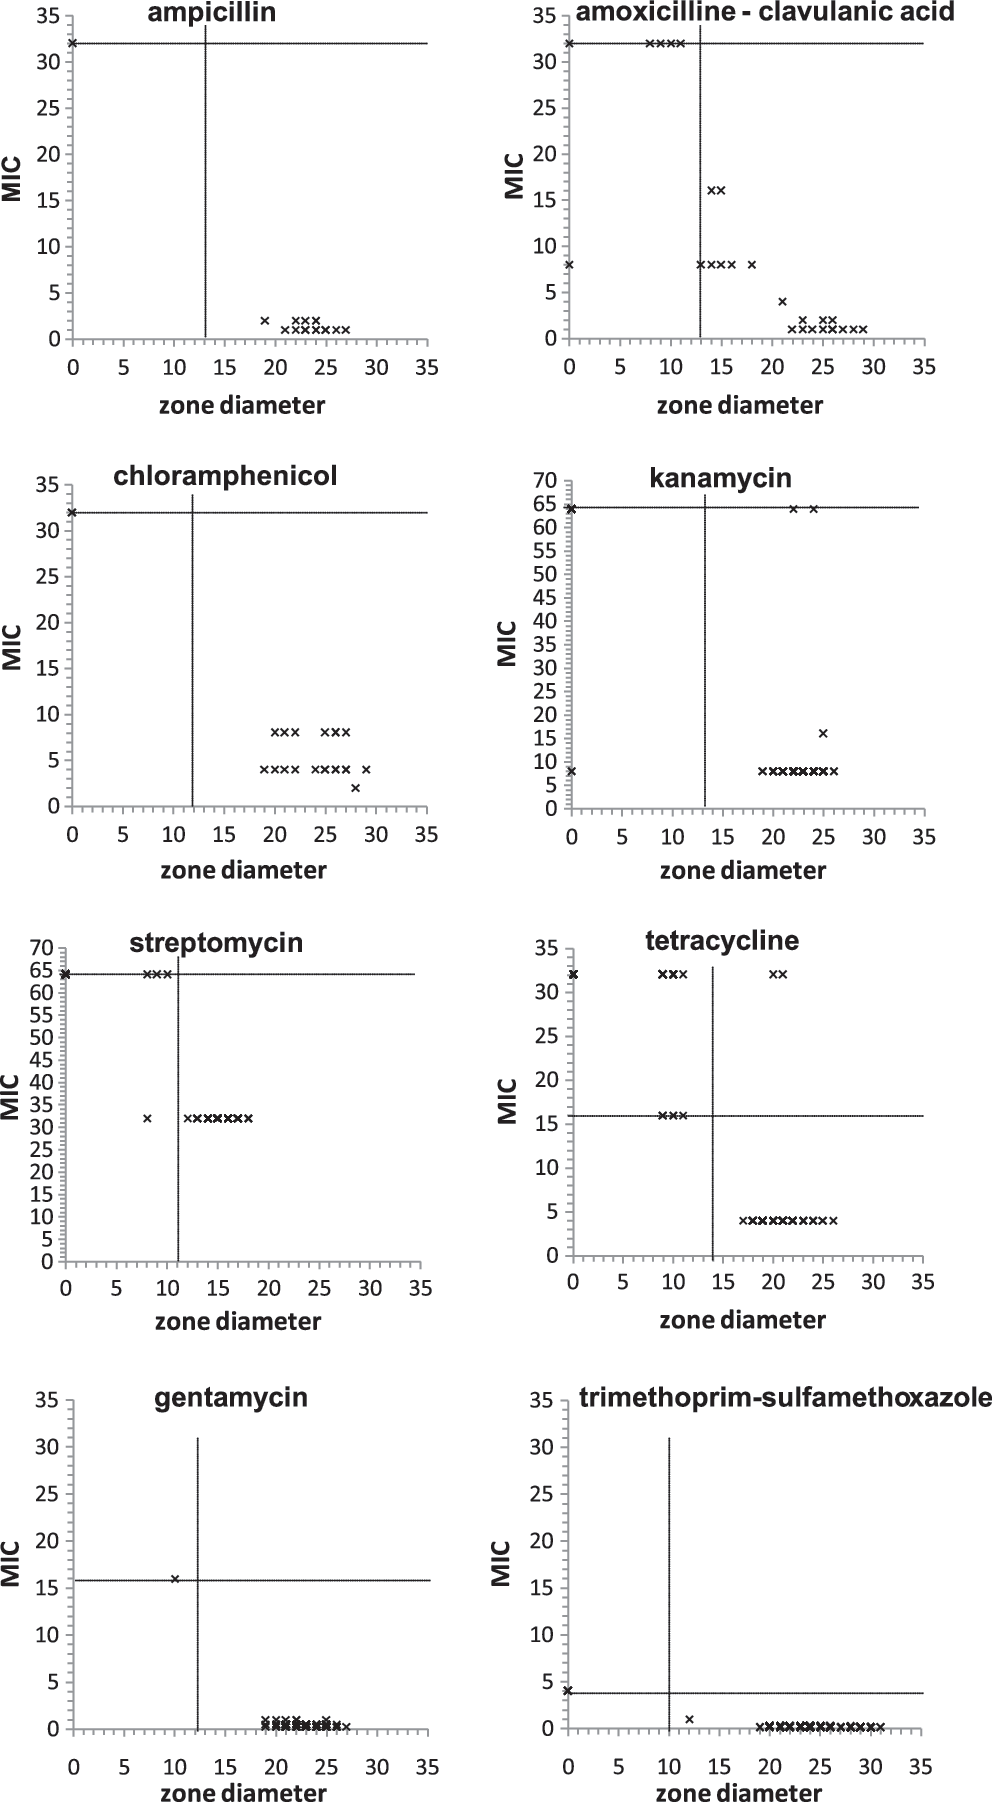
Scatter plots showing minimal inhibitory concentrations (MICs) and zone diameters. Resistance breakpoints are indicated by horizontal (MICs) and vertical (zone diameters) lines.
Average percent increase in hazard of growth inhibition per unit increase in parameter.
Spearman's correlation coefficient (ρ); ρ ranges from −1 to 1; a value of −1 indicates perfect negative correlation; a value of 0 indicates no correlation.
Hazard ratio for specified serotype versus average of remaining two serotypes.
95% CI, 95% confidence interval.
Proportional hazard models can account for such censoring, evaluate the relationship between the two test results, and allow inference whether additional factors need to be considered. These models fitted the data well, with the exception of streptomycin and potentially amoxicillin and clavulanic acid (data not shown). For most drugs, the zone diameter hazard ratios were in the range of 1.2–1.4 (Table 2), indicating that for isolates that were not inhibited at lower concentrations, the hazard of reaching the MIC at a given drug concentration increased 20%–40% for each 1 mm increase in associated zone diameter. For ampicillin, gentamicin, kanamycin, and tetracycline, zone diameters were the only significant predictors (Table 2). For the remaining drugs additional predictors impacted this hazard. For instance, for both chloramphenicol and the combination of amoxicillin and clavulanic acid, isolation year was a significant predictor, indicating that the increase in hazard differed between isolates collected in 2004 and 2005, even if zone diameters were identical.
Parametric models could allow further characterization of this hazard, but their fit was generally questionable. From these models, meaningful estimates of median MICs could only be obtained for gentamicin and trimethoprim-sulfamethoxazole, equaling 0.25 and 0.12, respectively.
Comparison of economic testing costs
We estimated costs for an average monthly throughput of 10 to 1000 isolates. A lower throughput appears economically unfeasible for automated microbroth dilution, and a higher monthly throughput would probably be logistically unfeasible for disk diffusion.
Based on estimates from staff at Cornell University and Washington State University with extensive experience performing antimicrobial susceptibility testing, we assumed consumable costs of approximately $11.46 per sample for microbroth dilution and of approximately $8.94 per sample for disk diffusion (Table 3), assuming the testing volume is sufficient to avoid wasted reagents. We further estimated labor costs of ∼15 minutes per sample to set up the microbroth dilution, and 10 minutes per sample to set up, analyze, and report the disk diffusion tests, translating into labor costs of $5.5 and $3.7 per sample, respectively. The absolute quality control costs are sample-number dependent for disk diffusion but constant for microbroth dilution, significantly contributing to the continuous decline in operational costs for microbroth dilution as sample throughput increases (Table 3). Operational costs are lower for disk diffusion than for microbroth dilution for all sample volumes, but the difference in per-sample cost reduces from $23.86 for an average throughput of 10 samples to $3.5 at an average throughput of 1000 samples per month.
Testing resistance to a panel of 15 antimicrobial drugs routinely monitored by the National Antimicrobial Resistance Monitoring System (i.e., NARMS panel).
Testing resistance to a panel of 12 antimicrobial drugs commonly tested by the Washington State University Animal Health Diagnostic Laboratory.
Estimated at 15 minutes per sample for Microbroth dilution and at 10 minutes per isolate for Agar disk diffusion.
Estimated at 120 minutes per plate for Microbroth dilution and at 12 minutes per control isolate for Agar disk diffusion.
Estimated based on 3 year write-off.
NARMS, National Antimicrobial Resistance Monitoring System.
Investment costs were ∼3 times as high for microbroth dilution as for disk diffusion, and because of the need for external training we estimated training costs alone as ∼40 times as high for microbroth dilution as for disk diffusion, even though our cost estimates were conservative ($2000). Our calculation did not account for opportunity cost, service and maintenance costs, or potential other costs. Equipment for microbroth dilution can often also be used for other diagnostic applications, and we also did not account for potential additional revenue streams. Taking investment cost into consideration, the difference in cost reduces from $136.67 for an average throughput of 10 samples per month to $4.64 for an average throughput of 1000 samples per month.
Discussion
Automated microbroth dilution and agar disk diffusion yield highly comparable isolate classifications
Test results were highly comparable in our study, with category agreement equaling 95%. Such results are in agreement with previous reports, even though only limited evaluations of antimicrobial test correspondence are available (Kohner et al., 1997; Pfaller et al., 2003; Halbert et al., 2005; Jones et al., 2005; Nayak et al., 2007), and some other studies have reported poor agreement between disk diffusion and microbroth dilution (Woolfrey et al., 1981; Lumbiganon et al., 2000). According to the CLSI criteria for laboratory evaluation, a very major error rate of 1.5%, a major error rate of 3%, and an overall category agreement of 90% represent acceptable interpretative errors (Stuckey, 2007). For almost all antimicrobial drugs, our tests satisfied or exceeds these minimum criteria, indicating excellent agreement between CLSI recommended breakpoints and demonstrating adequacy of results generated with either method. A small number of random errors are to be expected with each test, and except for the combination of amoxicillin and clavulanic acid, disagreement appeared non-differential and was generally resolved through re-testing. Error rates similar to those reported here have been reported previously (Edelmann et al., 2007; Nayak et al., 2007). In those studies as well as in ours, error rates varied considerably among drugs, and error rates appeared particularly high for the combination of amoxicillin and clavulanic acid (Edelmann et al., 2007). Disagreement between test results may be due to human error or the spontaneous loss or gain of resistance during culture. However, disk diffusion based methods can also be impacted by numerous external variables including agar pH and depth, varying concentrations of free calcium ions, thymine or thymidine in the agar, uneven inoculation volumes, or inconsistent incubation times and temperatures (CDC, 1999). Microbroth dilution tests can in contrast be affected by deviations in pH and inoculation time (Whithear et al., 1983). Importantly, results for different drug classes are often differentially affected by test procedure deviations.
MIC and zone diameter values are negatively correlated but correlation strength differs between drugs, and simple back-calculation from zone diameter to MIC without accounting for potential confounders appears invalid
A clear negative relationship between MIC and zone diameter values, as detected here, has been reported previously (Bemis et al., 2009). Knowledge of this relationship may be useful, especially in clinical settings. A survey of antimicrobial susceptibility testing practices in 77 rural hospitals located in four U.S. states reported that 20 hospitals used disk diffusion for susceptibility screening, with16 hospitals not confirming results with dilution methods (Stevenson et al., 2003). The survey was performed ∼10 years ago, but similar practices are likely still common in many areas.
Several studies have reported a linear relationship between MIC and zone diameter values (Wood and Shadomy, 1983; Jones et al., 2005; Dimitriu et al., 2006; Bemis et al., 2009). Based on this observation, some researchers have transformed zone diameters into MIC values based on regression analysis and commercial applications exist, with potentially acceptable results for certain bacteria, including Enterobacteriaceae, Pseudomonas, and Streptococcus (D'Amato et al., 1985; Sautter and Denys, 1987; Hubert et al., 1998; Jacobs et al., 1998). However, the semi-parametric Cox regression model represents a more appropriate analysis technique for censored data (D'Amato et al., 1985; Sautter and Denys, 1987; Hubert et al., 1998; Jacobs et al., 1998). In our study, we also detected a drug-specific relationship between MIC and zone diameter values. Yet, for several drugs additional covariates such as serotype, host species, or isolation year also impacted the MIC, indicating that simple back-calculations that do not account for these confounders are often inappropriate.
For laboratories with high sample throughput automated microbroth dilution may be preferable, whereas agar disk diffusion is clearly more economical for laboratories with low sample throughput
Few studies have formally compared the economic feasibility of antimicrobial susceptibility tests. We found that automated microbroth dilution becomes prohibitively expensive if sample throughput is low. This finding is in agreement with a recent study, which concluded that the semi-quantitative E-test was economically more feasible than the dilution based method it was compared to (Valdivieso-García et al., 2009), and the observation also agrees with older studies (Berke and Tierno, 1996). Dilution based tests allow for high sample throughput and are therefore potentially advantageous for large laboratories, and at high sample throughput automated microbroth dilution is only ∼20% more expensive than disk diffusion. However, disk diffusion is clearly appealing for smaller laboratories with low sample throughput. In fact, because of the low investment costs, disk diffusion is feasible for small surveillance or hospital laboratories and, for the latter, may permit in-house susceptibility screening. Collins et al. (2007) analyzed the economic costs associated with different susceptibility testing regimens for Candida glabrata fungemia and found that in-house testing represented a clear cost advantage compared to sending out tests or not testing isolates at all, mainly due to reductions in treatment costs. Disk diffusion might therefore offer additional advantages over microbroth dilution in certain situations, and the most adequate test should be selected based on scientific considerations and the individual laboratory requirements. Given the lower cost and high degree of comparability between results, disk diffusion may, for instance, be an alternative to microbroth dilution for surveillance studies.
Conclusions
Our study shows that agar disk diffusion and microbroth dilution produce very comparable antimicrobial susceptibility results. Current CLSI and NARMS breakpoints are in excellent agreement for the Salmonella serotypes analyzed here. However, a standardized back-calculation from zone diameters to MICs without accounting for potential confounders, as previously reported in the literature, appears questionable for many of the drugs and Salmonella serotypes tested here. Disk diffusion might be unfeasible for high-throughput laboratories but is potentially appealing to small laboratories, and may offer a viable alternative to microbroth dilution for surveillance studies.
Footnotes
Acknowledgments
We are grateful to Dr. Craig Altier, Dr. Patrick L. McDonough, Dr. Timothy Root, and Dr. Nelly Dumas for providing isolates and expert advice. We are further in debt to Rebecca J. Franklin, Katherine N.K. Baker, Russell McClanahan, and Lisa Jones for providing their expertise and advice.
Support for this project was provided by the National Institute of Allergy and Infectious Diseases, National Institutes of Health, Department of Health and Human Services, under Contract numbers N01-AI-30054- ZC-006-07 and N01-A1-30055. K.H. was supported by Morris Animal Foundation Fellowship Training Grant D08FE-403
Disclosure Statement
No competing financial interests exist.