




Abstract
Development of antibiotic resistance in the microbiota of farm animals and spread of antibiotic-resistant bacteria in the agricultural sector not only threaten veterinary use of antibiotics, but jeopardize human health care as well. The effects of exposure to antibiotics on spread and development of antibiotic resistance in Escherichia coli from the chicken gut were studied. Groups of 15 pullets each were exposed under strictly controlled conditions to a 2-day course of amoxicillin, oxytetracycline, or enrofloxacin, added to the drinking water either at full therapeutic dose, 75% of that, or at the carry-over level of 2.5%. During treatment and for 12 days afterwards, the minimal inhibitory concentration (MIC) for the applied antibiotics of E. coli strains isolated from cloacal swabs was measured. The full therapeutic dose yielded the highest percentage of resistant strains during and immediately after exposure. After 12 days without antibiotics, only strains from chickens that were given amoxicillin were significantly more often resistant than the untreated control. Strains isolated from pullets exposed to carry-over concentrations were only for a few days more often resistant than those from the control. These results suggest that, if chickens must be treated with antibiotics, a short intensive therapy is preferable. Even short-term exposure to carry-over levels of antibiotics can be a risk for public health, as also under those circumstances some selection for resistance takes place.
Introduction
In the microbial population in the gut, the measured resistance is a result on the one hand of physiologically induced resistance or acquisition by gene transfer and on the other hand of selection of bacteria that were already resistant. In vitro an increase of the minimal inhibitory concentration (MIC) of E. coli for enrofloxacin can be induced by a factor of up to 1000, from 0.3 to 512 μg/mL after approximately 100 generation times. Increasing doses of oxytetracycline and amoxicillin induced resistance to a lesser degree, but still enough for the cells to be effectively resistant (van der Horst et al., 2011). That the long-term exposure to antibiotics in vivo leads to resistance has amply been demonstrated. The effects of a therapeutic dose for chicken treatment often used a 48-h period, and lower doses over the same time frame are less well understood.
This study explores the build-up and decline of resistance of the bacterial population due to therapeutic treatment, a concentration of 75% thereof, which may occur due to inhomogeneity in the feed-mix and a level of 2.5%, which animals often encounter as a result of left-over antibiotics in the drinking water system. The antimicrobial resistance of E. coli isolates from the intestinal microbiota of pullets was examined. The build-up of resistance is different for each of the three antibiotics tested: amoxicillin, oxytetracycline, and enrofloxacin.
Materials and Methods
Experimental design
The experiments were designed to study the effect of administration of antibiotics in drinking water on the resistance of the E. coli bacteria in the feces of layer chickens. A total of 10 groups of 15 chickens each were used in the study: one control and three experimental groups for each antibiotic. The control group did not receive any antibacterial treatment. For each of the three antibiotics (amoxicillin, oxytetracycline, and enrofloxacin), the following treatments were used: (1) One group was treated with an antibiotic in the therapeutical dose (according to the registration of the product). (2) Another group was treated with reduced therapeutical dose (75% of the therapeutical dose). (3) A third group was treated with a carry-over dose (2.5% of the therapeutical dosage).
Therapeutical dosages for the antibiotics used were as follows: amoxicillin (Paracilline®) 20 mg/kg body weight, oxytetracycline (Oxytetracycline HCl®) 20 mg/kg body weight, and enrofloxacin (Baytril®) 8 mg/kg body weight (Table 1). Medication was given for a period of 48 h. All birds were sampled using cloacal swabs 1 day prior to the start of the treatment, daily during the treatment period, and five times in a period of 15 days after ending the treatment. Swabs were used to identify E. coli strains that were resistant towards the antibiotic that was applied.
Amox, amoxicillin; Enro, enrofloxacin; Oxy, oxytetracycline; 100, 100% of the therapeutic dose; 75 and 2.5, 75% and 2.5% of the therapeutic dose, respectively.
Chickens and housing
The birds were obtained from the specific pathogen free (SPF) flock of the Animal Health Service (De Gezondheidsdienst voor Dieren [GD]) in Deventer, The Netherlands. The original flock was owned by GD since 2003 and has never been medicated. Each group consisted of 15 males, 11 weeks old, with an average weight of 1.18 kg per bird. The total amount of bodyweight per isolator was 17.65 kg, with a range of 17.55–17.73 kg. At the end of the experiment, the group was weighed to determine the average daily weight gain. Each group of birds was housed in HEPA-filtered isolators (Beyer and Eggelaar, Utrecht, The Netherlands) with a surface area of 13800 cm2 each. The slats of the isolators were covered with plastic to ensure direct contact with feces. A lighting program of 8 h of light and 14 h of dark was used. Each group had ad libitum drinking water and ad libitum complete formulated pullet feed (Arkervaart, Nijkerk, The Netherlands).
Antibiotics
The antibiotics were dissolved in the drinking water based on the dosage per kg body weight of the active compound of the antibiotic. The following antibiotics were used: (1) Amoxicillin (Paracilline®; Intervet REG NL 4256): 1 g of Paracilline is 697 mg of amoxicillin. (2) Oxytetracycline (Oxytetracycline HCl®; Eurovet Reg NL 8678): 1 g of Oxytetracycline HCl® is 1 g of oxytetracycline. (3) Enrofloxacin (Baytril® 10% oral solution; Bayer REG NL 2929): 1 mL of Baytril is 100 mg of enrofloxacin.
The drinking water medication was prepared daily and calculated on the basis of the daily average body weight and the average water consumption of all the groups. The treated groups were given the fixed amount of medicated water, which was the average water intake of all the groups of the 2 days prior to the treatments. At 24 h after the administration of the water, the remaining water was weighed, the average water intake calculated, and the antibiotic intake determined.
Isolation of E. coli
Out of the swabs we isolated non-type-specific E. coli from all fecal samples. Established methods were followed (Nelson et al., 2007; Dutil et al., 2010; Overdevest et al., 2011). Briefly, cloaca swabs were incubated in buffered peptone water at 37°C for 18–20 h. The suspension was diluted in MacConkey broth, which was incubated at 44°C for 22 h. The cell suspension was then streaked on ColiID (bioMérieux, Marcy l'Etoile, France) agar plates, which were incubated for 24 h at 44°C to improve specificity. E. coli colonies were identified by their dark red color; three colonies were picked randomly from each plate. All colonies were restreaked on Evans medium agar plates, pH7, containing 55 mM glucose (Evans et al., 1970). Single colonies were cultivated in Evans medium and stored as glycerol stocks until further use.
MIC measurements
Preliminary experiments showed that results obtained with the CLSI method for measuring MIC (CLSI, 2006, 2008; Wiegand et al., 2008) had too much variability for the quantitative assessment needed for this study. Therefore, the more precise, but far more labor intensive, method developed earlier was used (Schuurmans et al., 2009). Serial dilutions, ranging from 0 μg/mL to maximally 4096 μg/mL of each antibiotic, were made in 96-well plates using Evans medium. E. coli was inoculated into each well to an approximate starting optical density of a sample measured at a wavelength of 600 nm (OD600) of 0.05. Growth was followed over time in a micro-titer plate reader, measuring OD600 every 10 min, with shaking in between. For these measurements, a Thermo Scientific Multiskan FC (with SkanIt software) was used. The MIC was defined as the lowest concentration of antibiotic that reduced the growth to a final OD of 0.2 or less, corresponding to two doublings. After the range of MIC values of the isolates was established, a limited range was used on the large number of isolates examined for this study (n=4050) For the resistance survey, isolates were grown in 96-well plates, overnight at 37°C. MIC measurements were carried out as described above with the following concentrations of antibiotics: amoxicillin (2, 4, 8, 16, 32, 64 μg/mL), oxytetracycline (1, 2, 4, 8, 16, 32 μg/mL), and enrofloxacin (0.03, 0.06, 0.125, 0.25, 0.5, 1 μg/mL). The standard European Union (EU) cut-off values were applied to describe isolates as “resistant”: amoxicillin, 32 μg/mL; oxytetracycline, 8 μg/mL; and enrofloxacin, 0.125 μg/mL.
Results
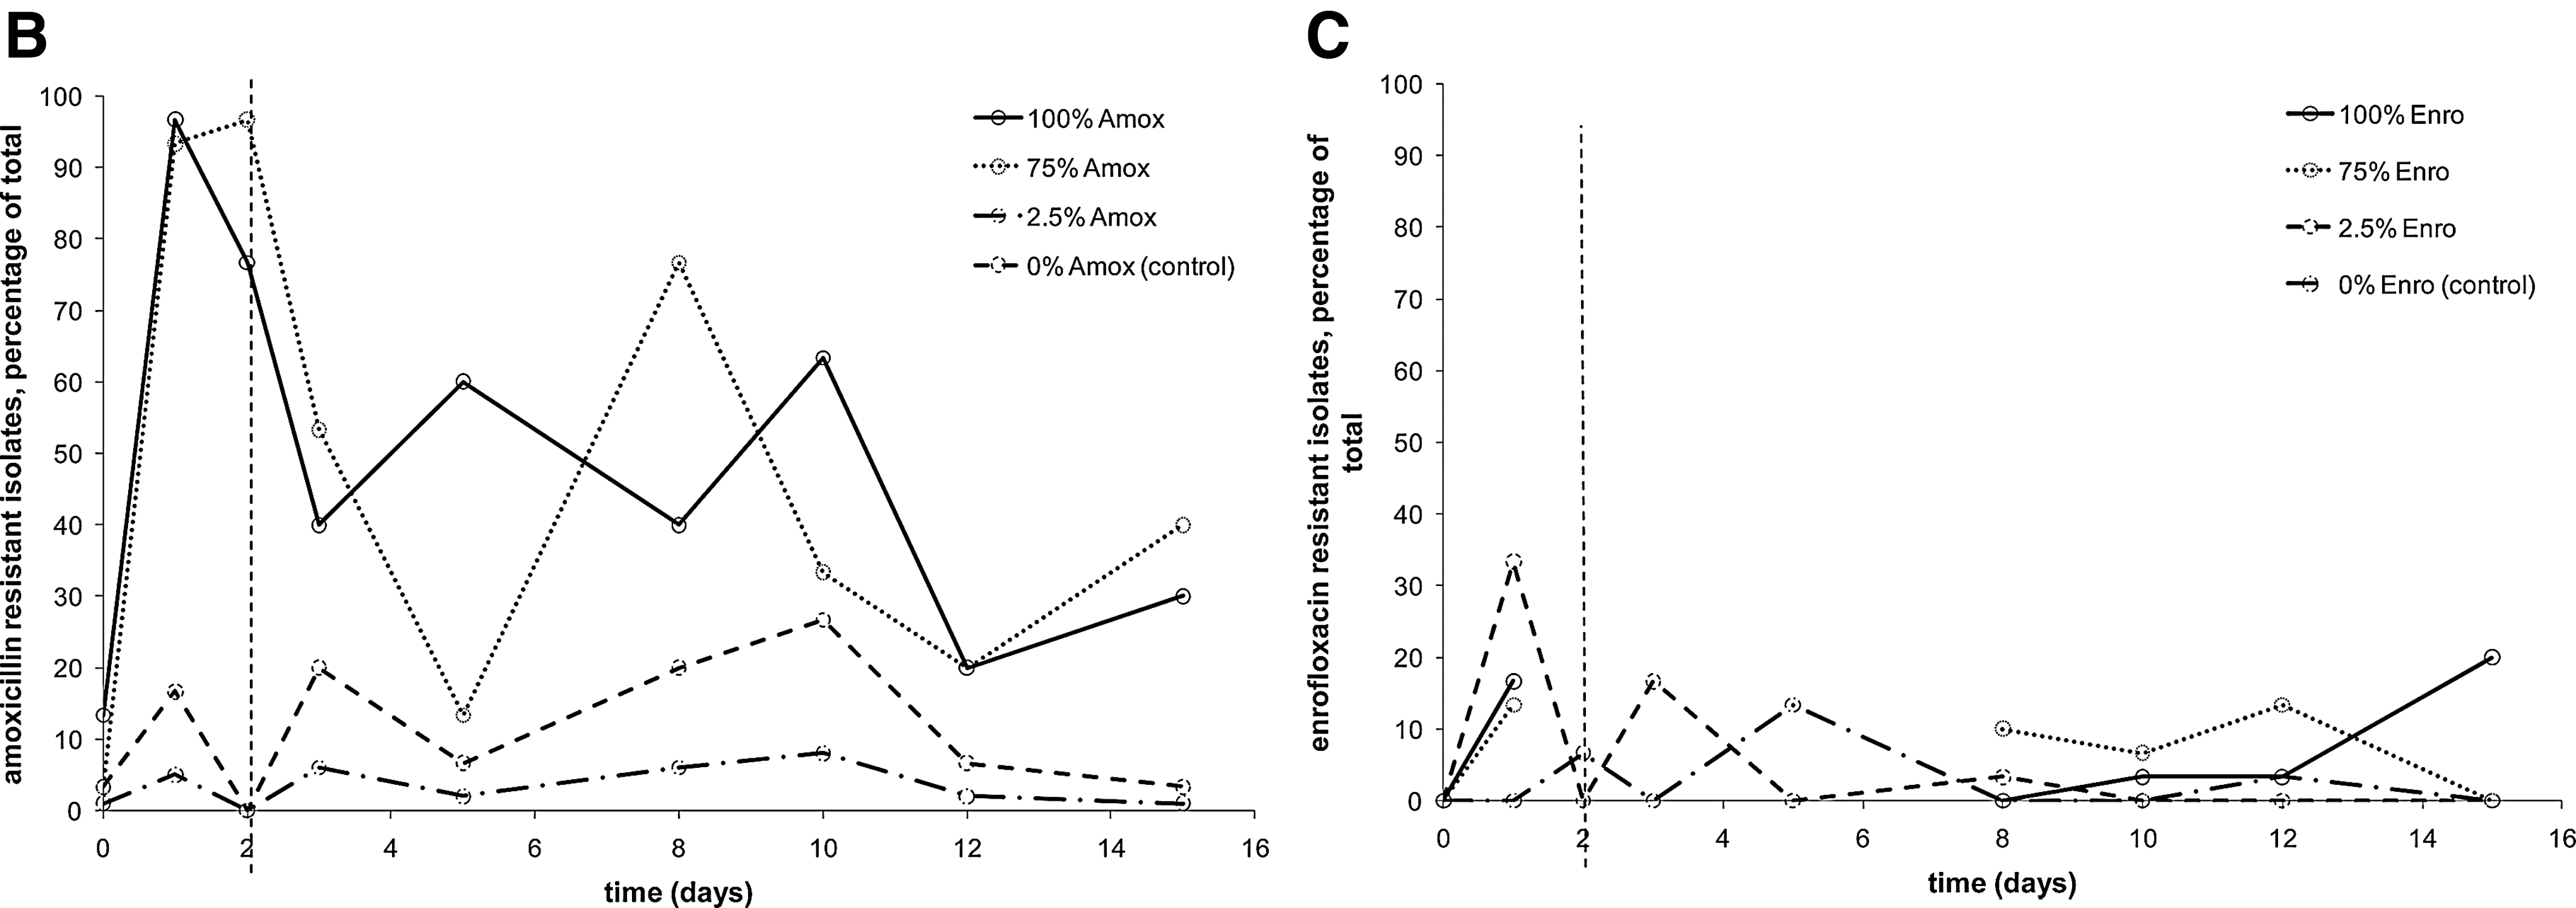
In this study, three antibiotics were used that are employed to treat chickens for 48 h in The Netherlands: oxytetracycline, amoxicillin, and enrofloxacin. Four concentrations were applied: 100% of the therapeutic dose, 75% as under dosage is reportedly common, and 2.5% because this level is often encountered as a result of left-over medicated water in the system (The Netherlands Food and Consumer Product Safety Authority [Nederlandse Voedsel en Warenautoriteit; VWA], unpublished data) and a control free of antibiotics. The three-dimensional bar graph of Figure 1 shows the distribution of MIC values over time. In Figures 2 and 3, the data are plotted in a different way to make a comparison of the four conditions possible. In these plots, a cut-off MIC value was used to distinguish susceptible and resistant isolates, and the percentage of resistant isolates is plotted as a function of time. The cut-off values used were taken from the MARAN-2008 report (Mevius et al., 2010): amoxicillin, 32 μg/mL; oxytetracycline, 8 μg/mL; and enrofloxacin, 0.125 μg/mL. Each datapoint of Figures 2 and 3 represents the average of MIC measurements on 45 isolates: three isolates each from 15 chickens. Due to the design of the study, no conclusions can be drawn as to the diversity of the E. coli population in the gut of individual chickens. Instead the aim was to follow the effects of antibiotic treatment at the population level. The variation of the MIC values of isolates from a single chicken did not differ from the variation between chickens. This was ascertained by comparing the average standard variations of the three samples from a single chicken to those of groups of three samples from different chickens. As these average standard deviations were equal, the variation within and between the chickens was equal as well. The method used to determine the MIC was shown to generate identical MIC values for clones; hence, the chance that the isolates from a single chicken were clonal can be excluded in all but very exceptional cases, if at all.
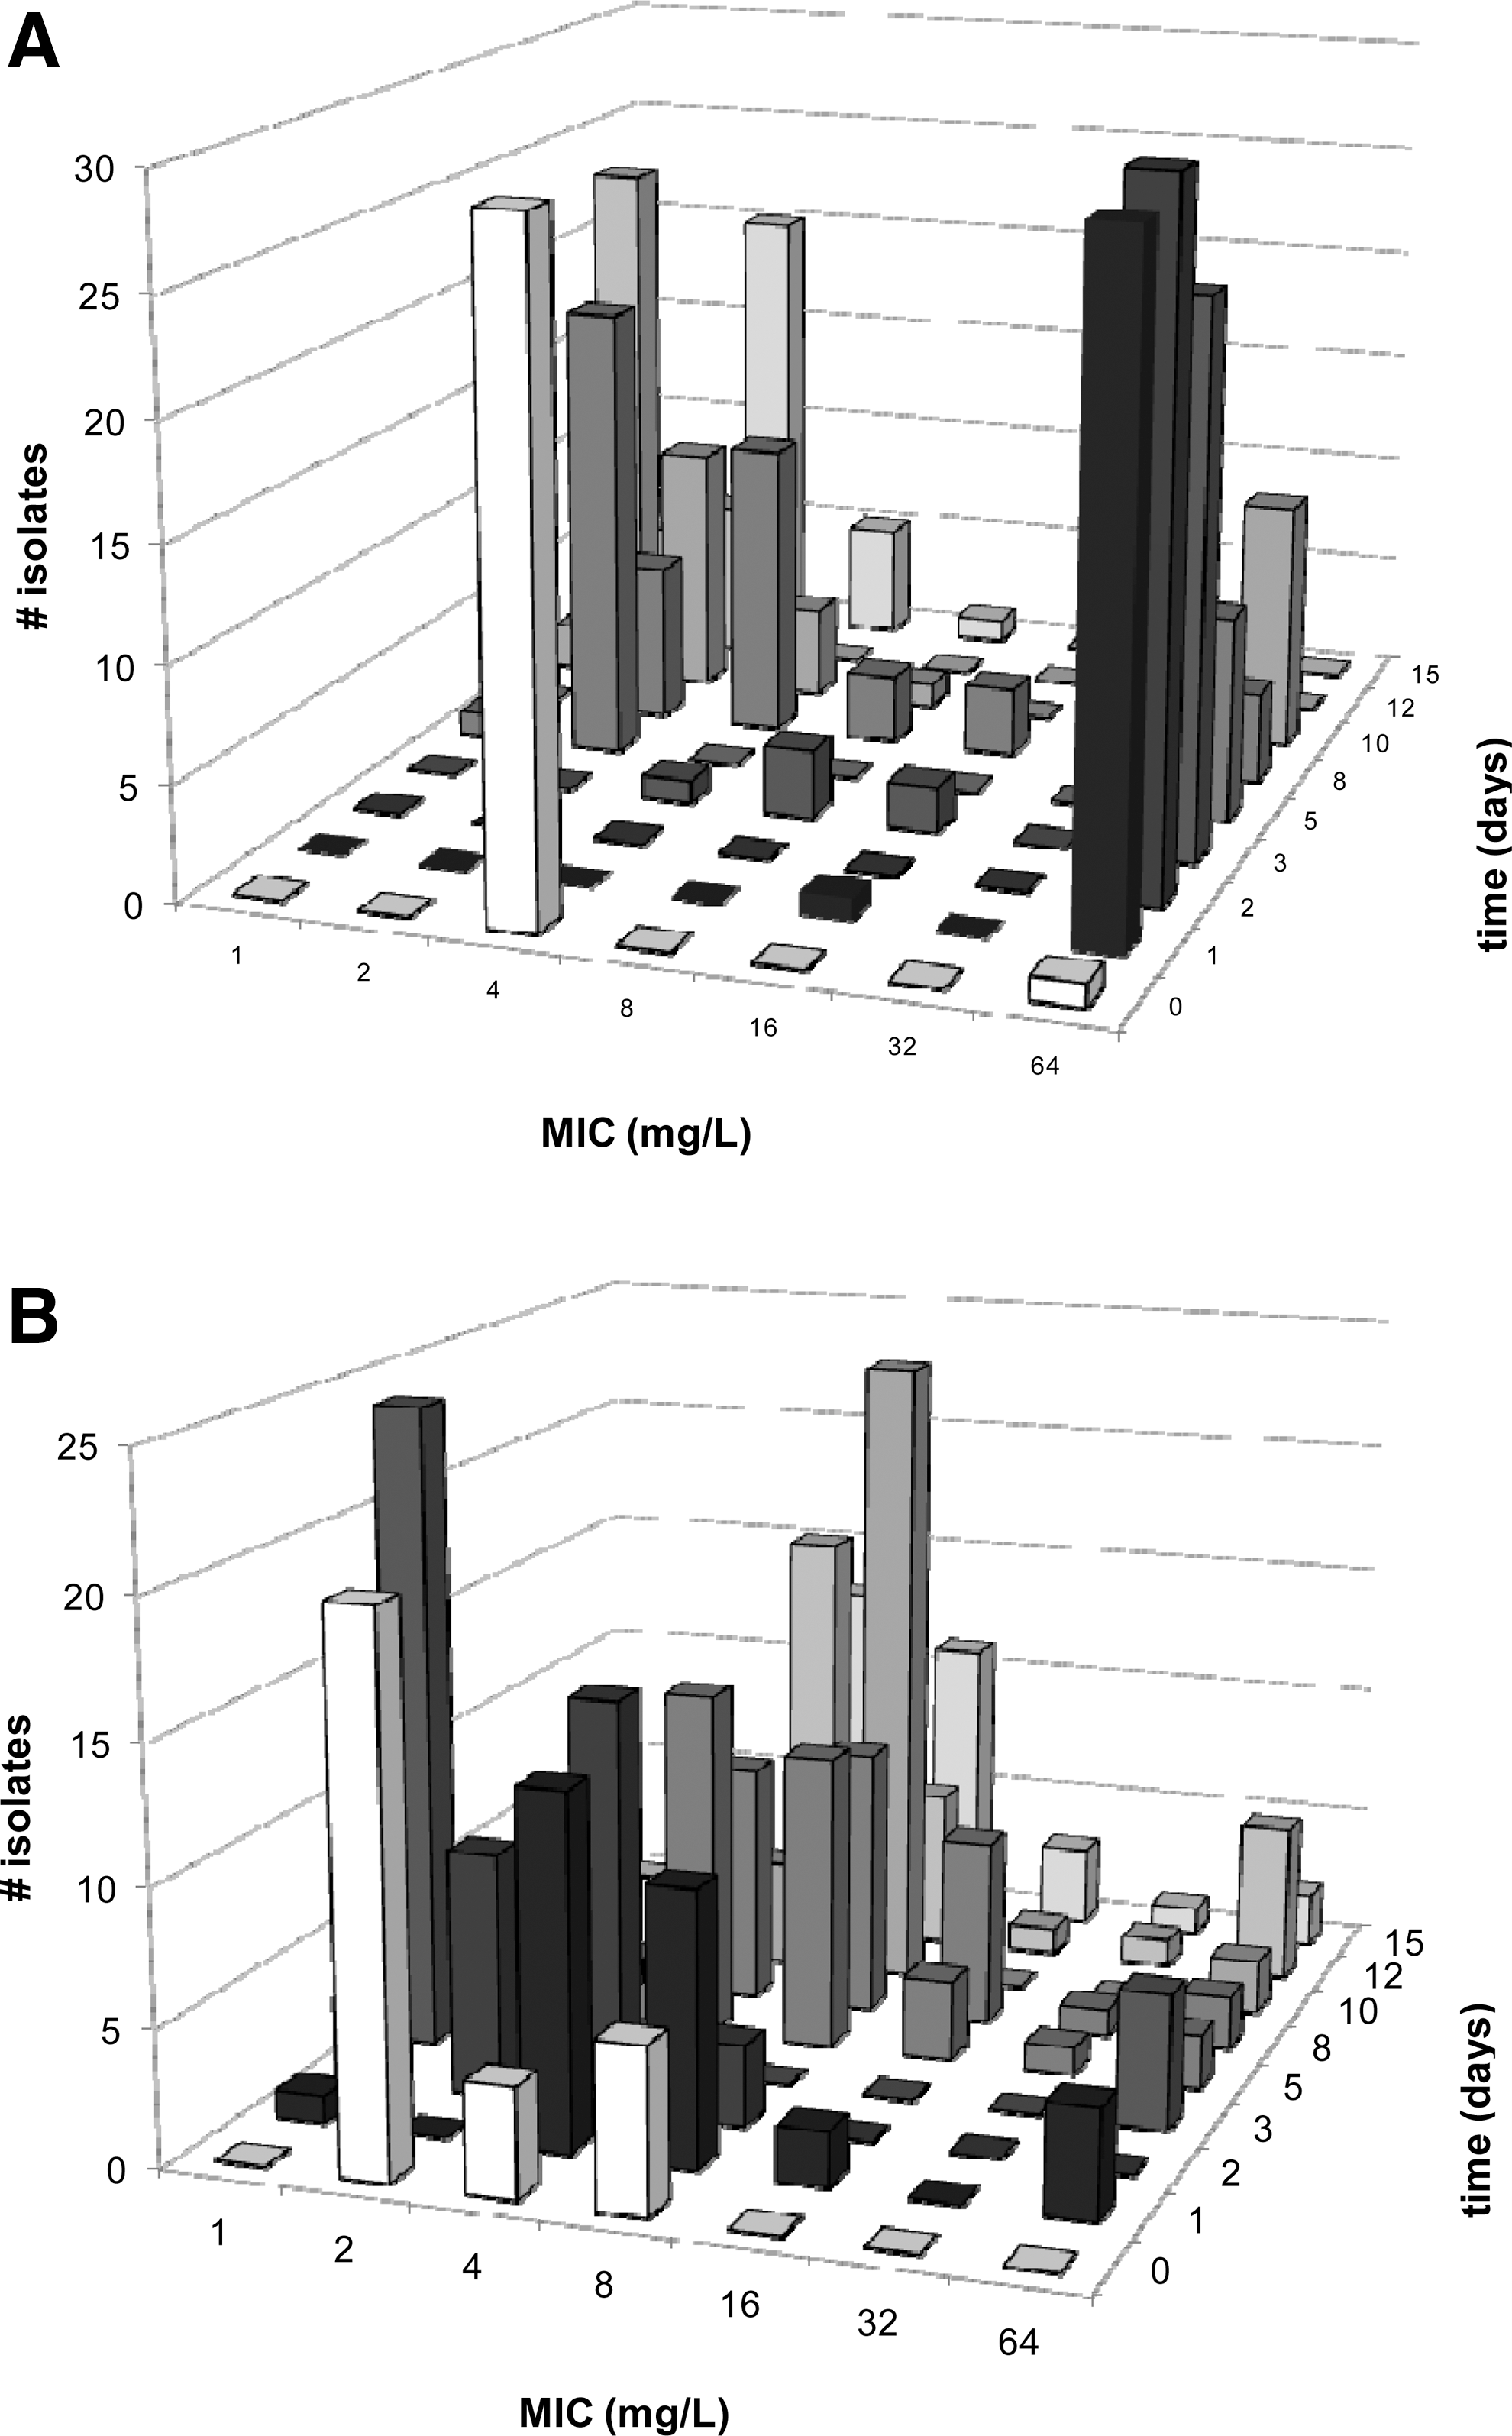
Distribution of oxytetracycline minimal inhibitory concentration (MIC) values in Escherichia coli isolates from broilers.
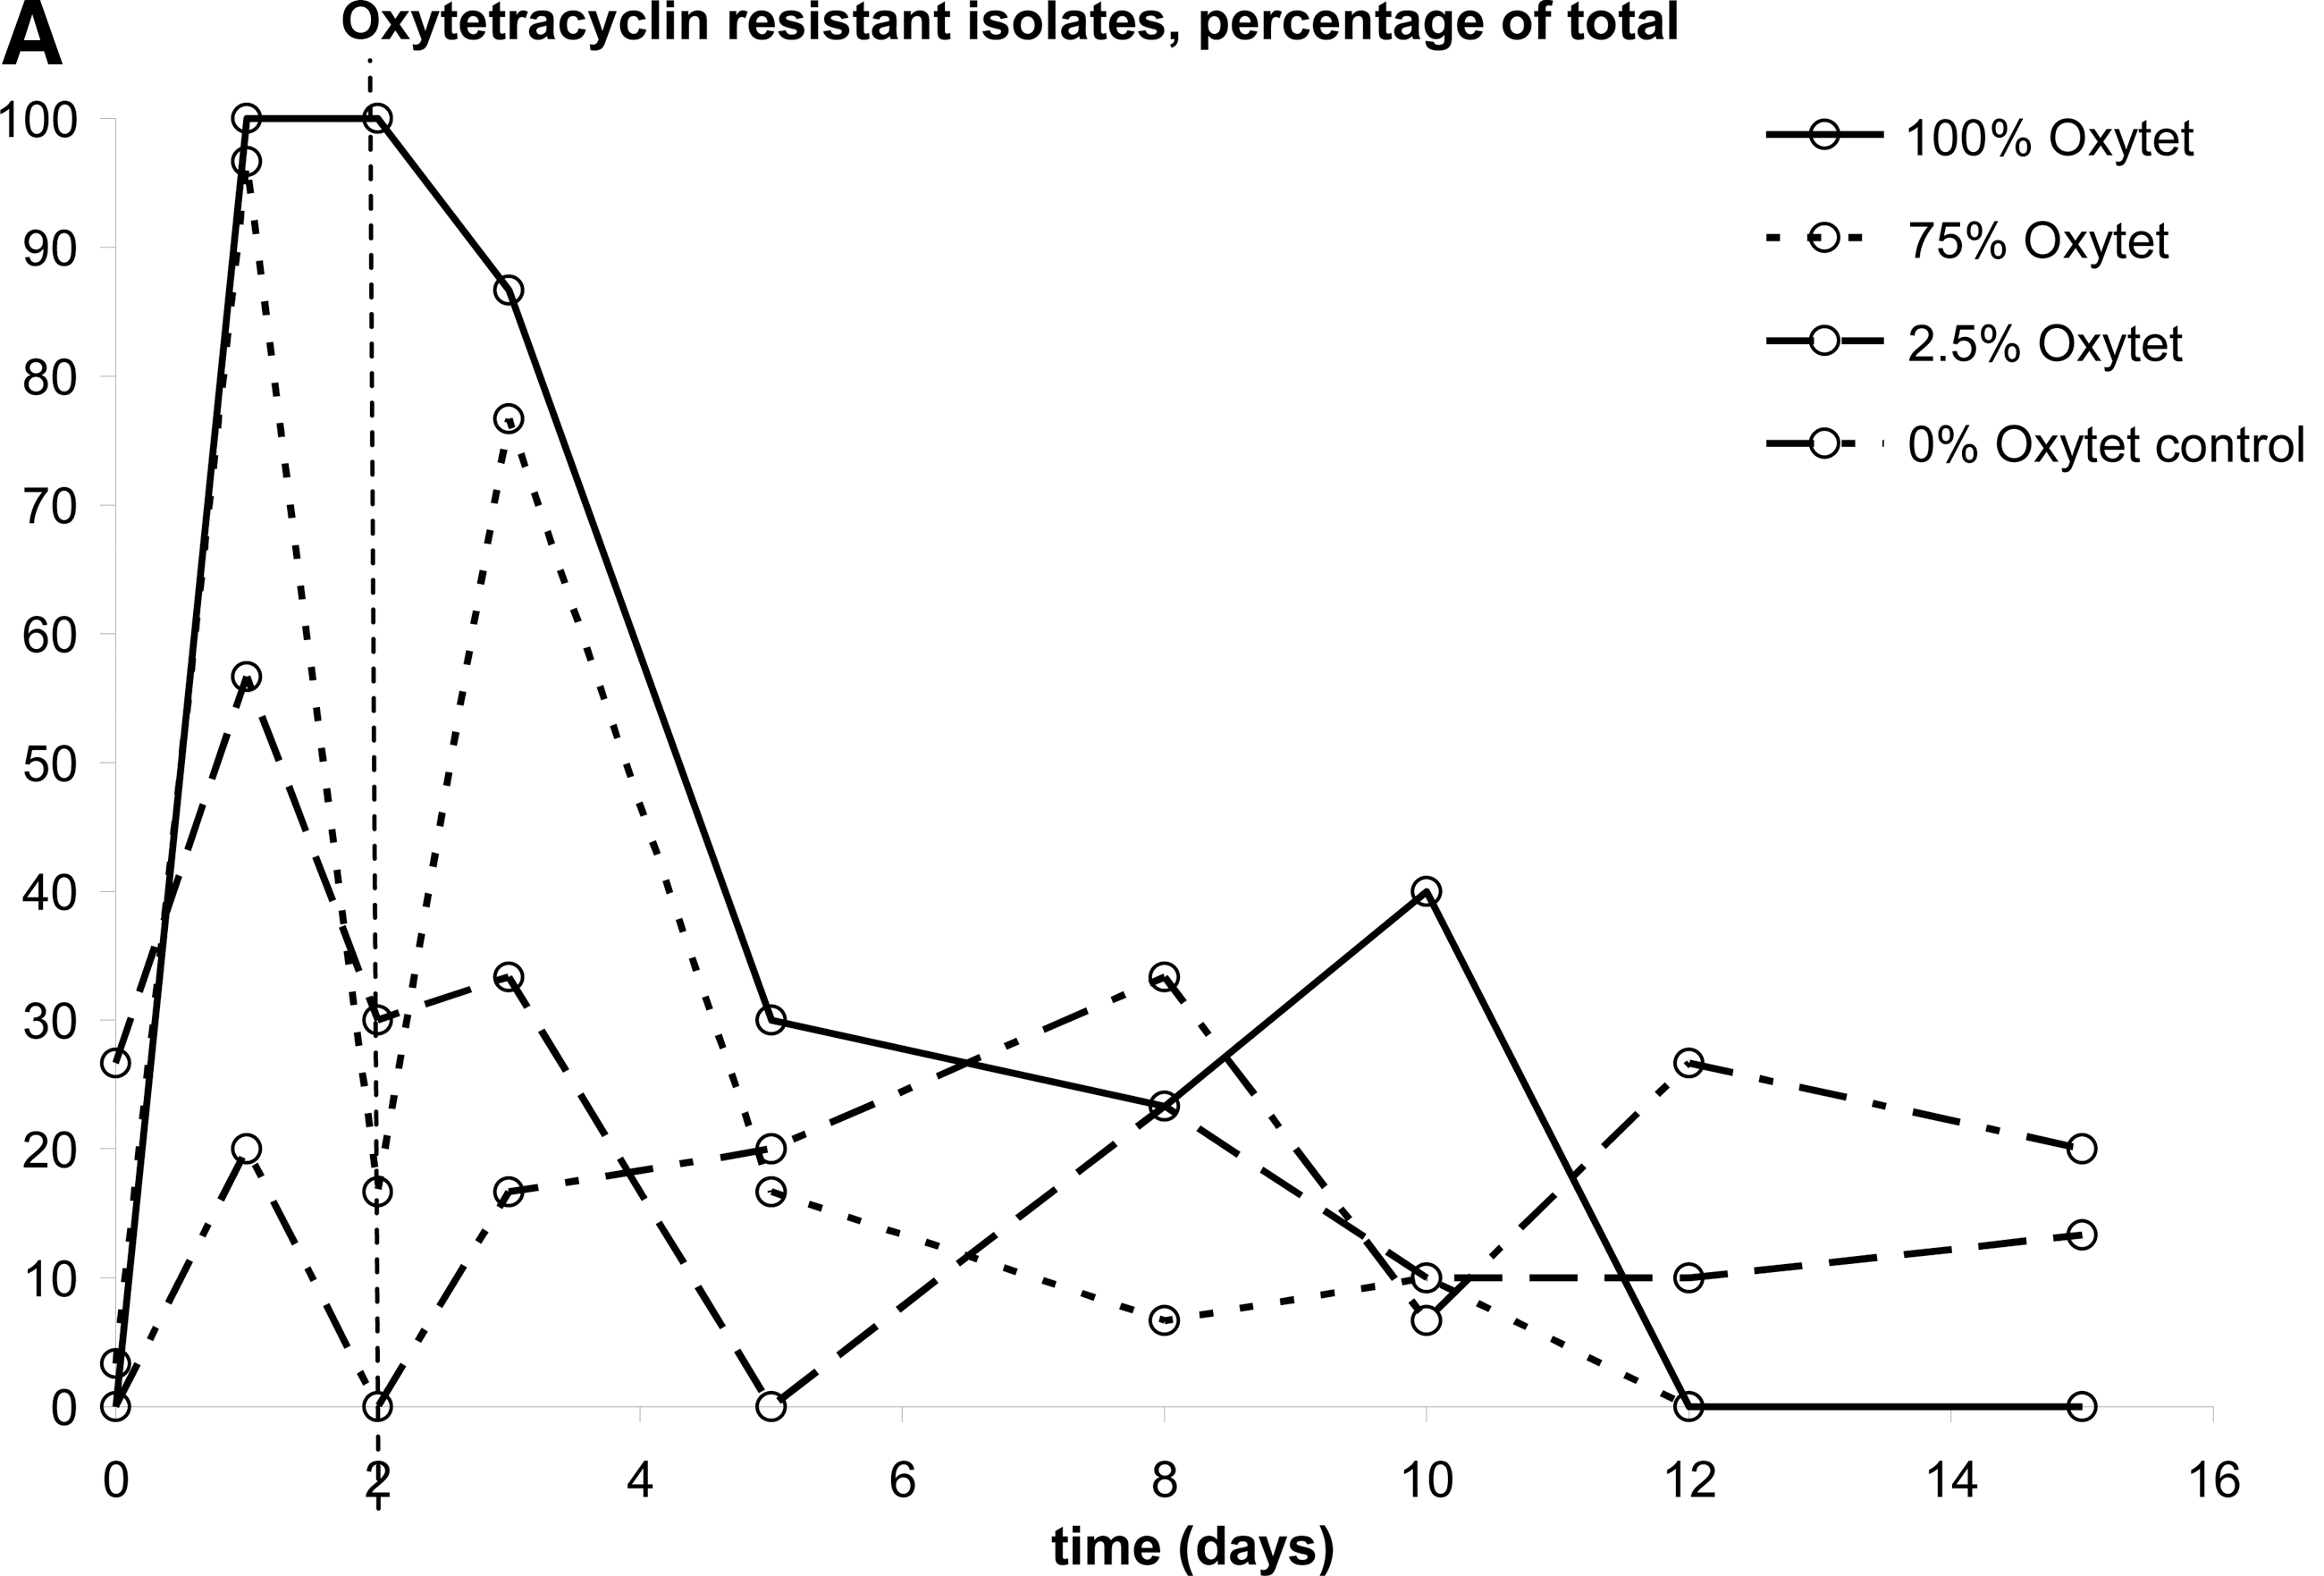
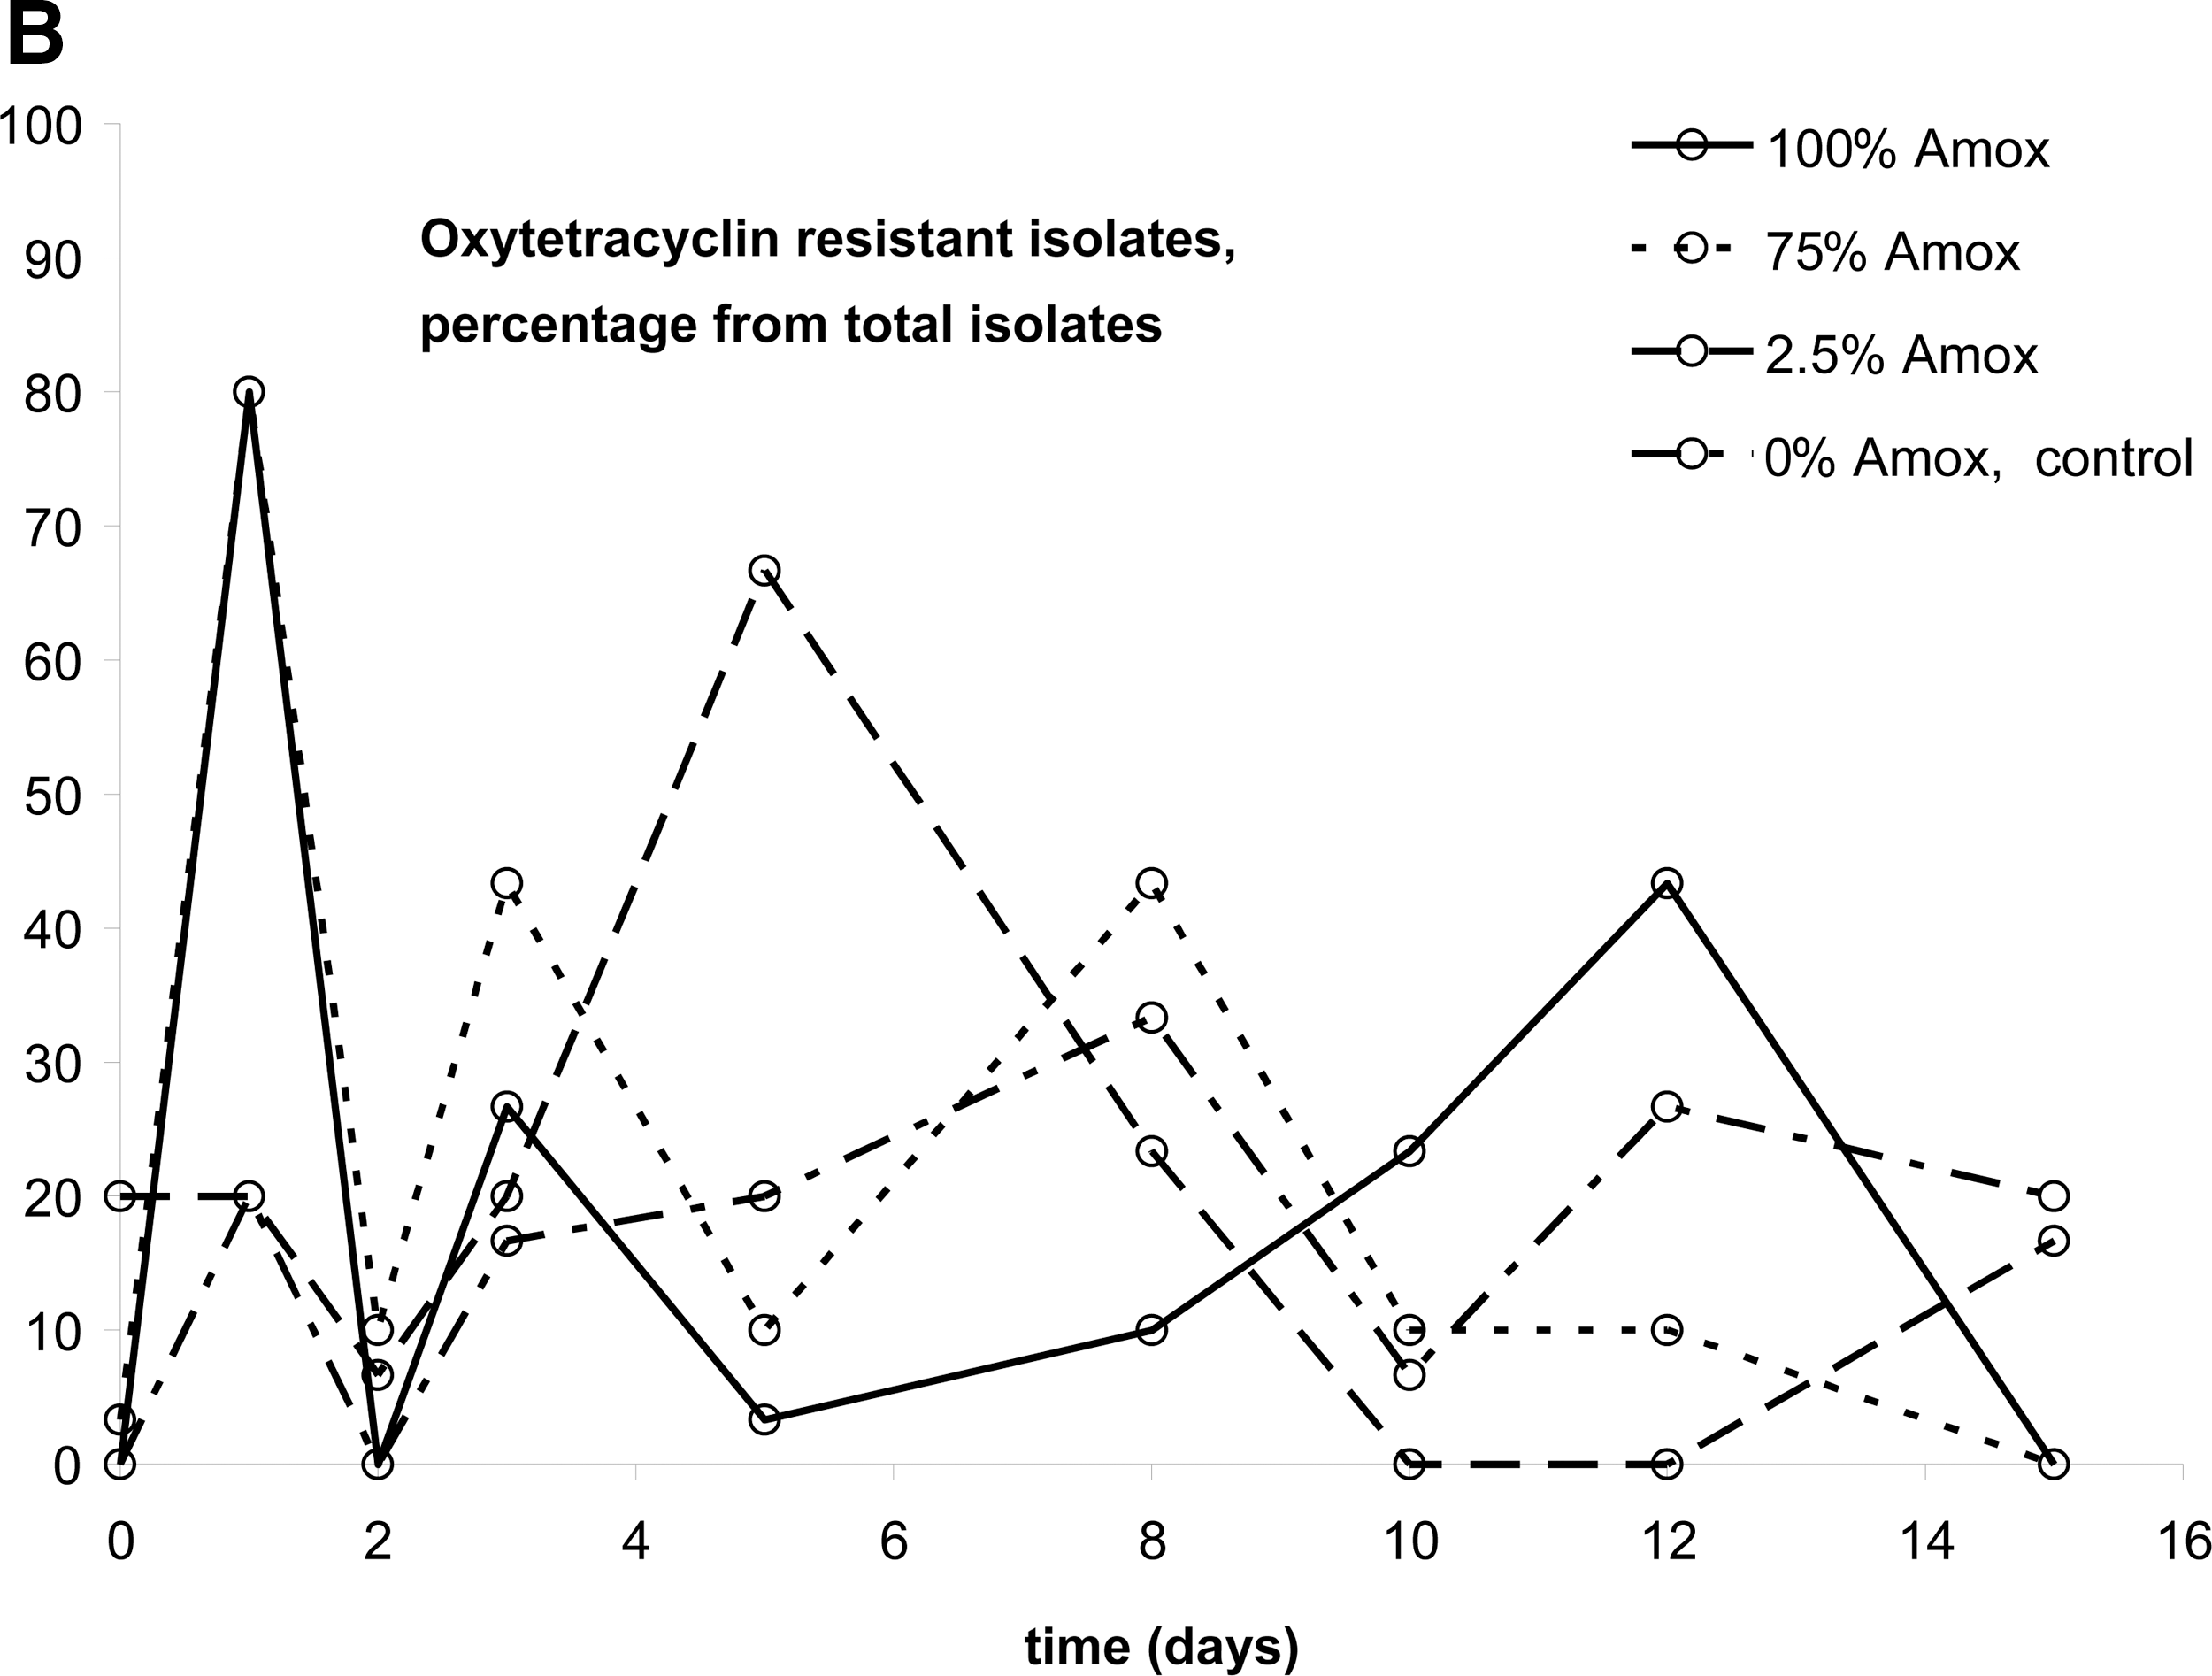
Percentage of broiler-isolated Escherichia coli population that is resistant. Antibiotics were administered on days 1–3 from noon to noon to the broilers in therapeutic dosage (100%), 75%, and 2.5% of that concentration. Control, no treatment. Each point represents data on 45 isolates.
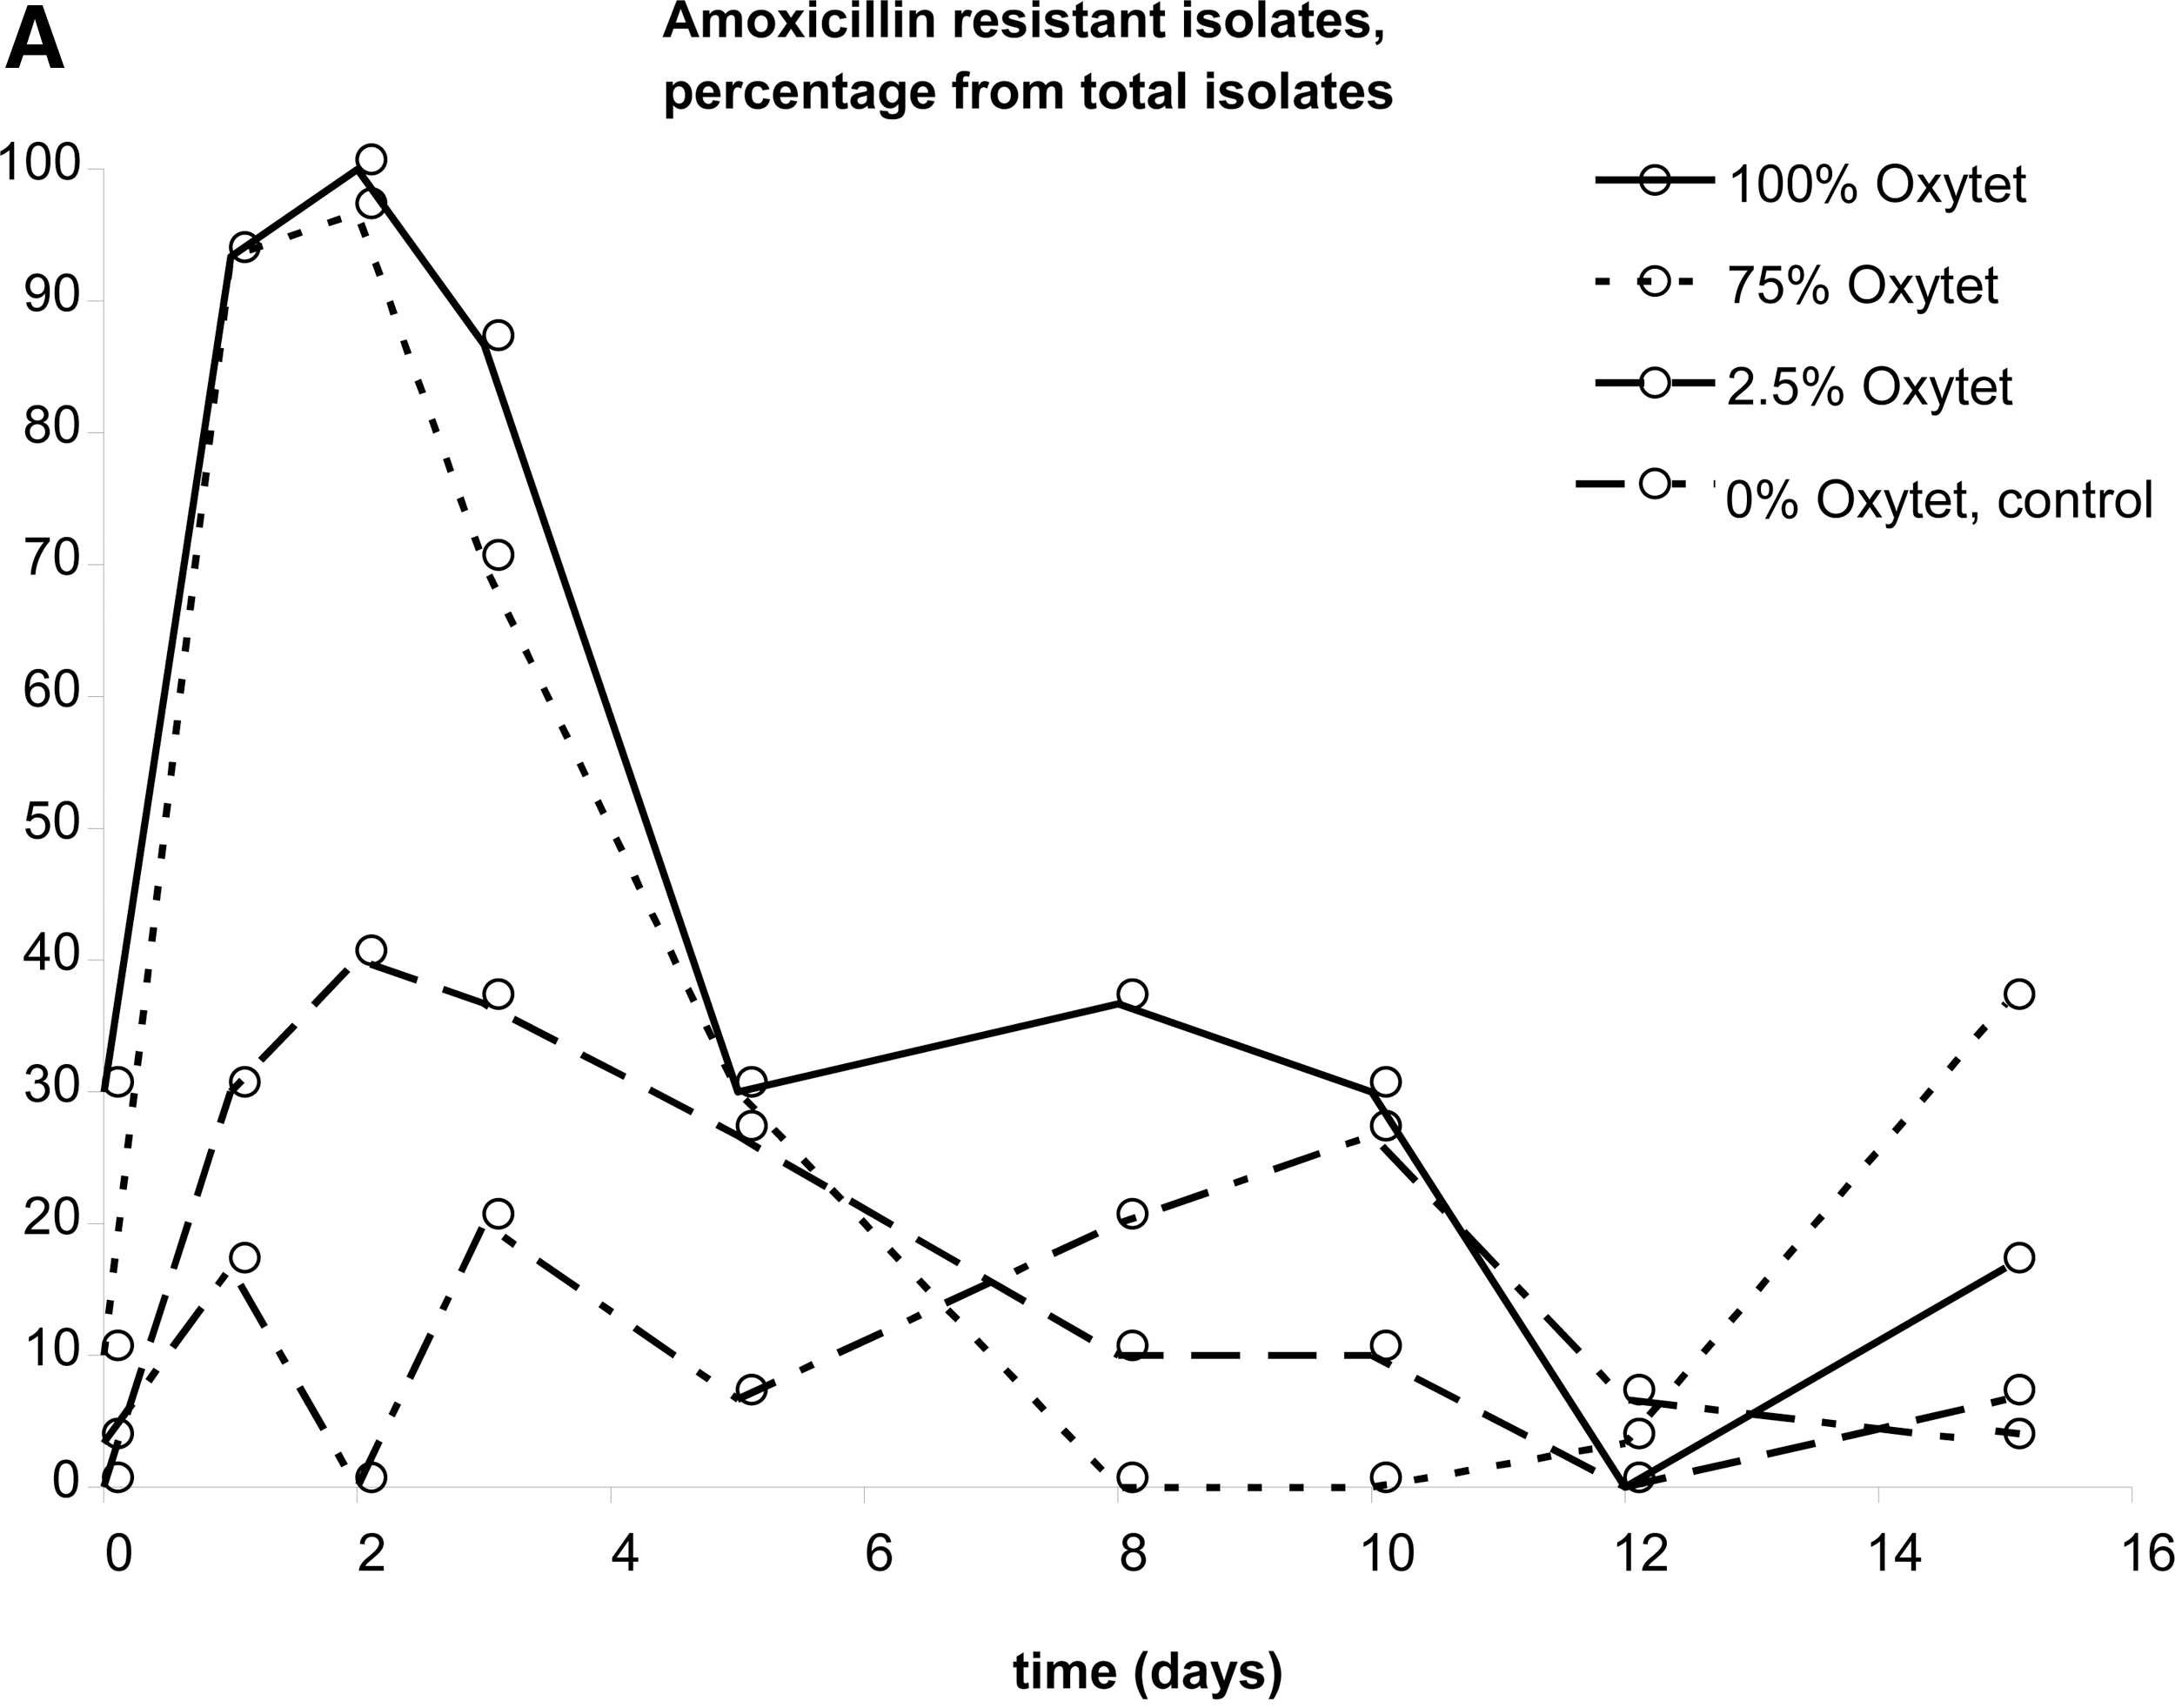
Co-resistance in Escherichia coli isolates from broilers.
In Figure 1, the time-dependent distributions of MIC values from E. coli isolates from pullets treated with a therapeutic dose of oxytetracycline (Fig. 1A) are compared to those of an untreated control (Fig. 1B). In these graphs, the distribution of MIC values in the population of 30 E. coli isolates is plotted as a function of time. At t=0 (i.e., before administration of antibiotics), and in samples isolated from the control isolator, we found distributions of MIC values around 4 μg/mL. Less than 5% of the isolates was resistant. Upon exposure to oxytetracycline, MIC values for oxytetracycline of the isolates shifted to 64 μg/mL (Fig. 1A). During administration of oxytetracycline, a large fraction of the isolates had a MIC value of 64 μg/mL. However, upon removal of the antibiotic from the drinking water, the isolated strains had gradually decreasing MIC values, until 10 days after ending exposure to oxytetracycline highly resistant isolates were no longer found. The control population had a more or less unchanged distribution of MIC values throughout the whole experiment, although small fluctuations were observed (Fig. 1B).
For oxytetracycline, the data partly presented in Figure 1 combined with the other conditions yielded Figure 2A. The effects of exposure to 100% of the therapeutic dose of oxytetracycline are already described above. At 75% of this dose, the same trend can be observed, although there was a drop in the percentage of resistant isolates on day 2. At an oxytetracycline level of 2.5% of the therapeutic dose, there is a slight increase in oxytetracycline resistance on day 1, but after that it does not differ significantly from the control. Upon exposure to amoxicillin in a therapeutic dose (100%), almost only resistant strains were recovered (Fig. 2B). This percentage slowly decreased after removal of antibiotic pressure. However, the MIC level after day 15 did not completely decrease to pre-exposure levels. Exposure to 75% of the therapeutic dose resulted in the same trend as observed with 100%, also showing a remaining fraction of resistant isolates at the end of the experiment. The percentage of resistant strains at 2.5% amoxicillin was at all time-points measured slightly higher than in the control series. Figure 2C shows resistance in E. coli isolates from pullets that were administered enrofloxacin. During administration, no E. coli isolates were obtained from the pullets that received 100% or 75% enrofloxacin. The isolates that were obtained from these incubations at later time points were slightly more resistant than those from the control and 2.5% enrofloxacin, but it is not certain that this difference is significant.
The possible occurrence of co-resistance was also studied. Figure 3 shows resistance towards amoxicillin of isolates from pullets that were given oxytetracycline (Fig 3A), and vice versa (Fig. 3B). Increased MIC levels for amoxicillin during antibiotic administration were observed in isolates from 100% and 75% oxytetracycline, and—to a lesser extent—from 2.5%. After removal of antibiotic pressure, however, resistance returned to pre-exposure levels in all cases. As can be seen in Figure 3B, oxytetracycline resistance in isolates from amoxicillin treated pullets does not show a clear trend. The percentage of resistant isolates was up to fivefold higher in the isolates from pullets with antibiotic administration, but there is a lot of variation in the data, reflecting the stochastic nature of the process. Elevated enrofloxacin resistance as a result of co-resistance was not observed (data not shown).
Discussion
Only amoxicillin induced a considerable residual increase of the resistant population at the end of the experiment. After enrofloxacin treatment, some resistance remained, and in the case of oxytetracycline, strains from the control had the highest level of resistance. These results might therefore be superficially interpreted as indicating that selection for resistance by usage of antibiotics is not worrisome. This conclusion is misleading because during and immediately after the treatment a high percentage of the isolated strains were resistant, even at the carry-over level of 2.5% of the therapeutic concentration. The increase of the percentage of resistant strains due to subtherapeutic doses of a variety of antibiotics used as growth promoters in steers (Alexander et al., 2008; Alexander et al., 2010) corresponds with our findings. As a result, therapeutic doses given after exposure to subtherapeutic levels will not be effective, because a high percentage of the strains have become resistant before the treatment started. It should be kept in mind, however, that treatment outcome and development of resistance are highly dependent on the combination of microbial species and antibiotic. For example, Campylobacter jejuni rapidly became resistant to enrofloxacin under conditions that left E. coli susceptible (van Boven et al., 2003).
The different effect of enrofloxacin when compared to oxytetracycline and amoxicillin can possibly be explained by a different area under the curve (Toutain, 2003). At the usual therapeutic doses, E. coli is exposed to concentrations of enrofloxacin that exceed the lethal dose for longer periods of time than is the case for amoxicillin of oxytetracycline. The recovery period of 6 days is more than would be expected based on the finding that prolonged treatment with a dose that initially killed Staphylococcus aureus more than 410 log was no longer effective after 5 days (Tam et al., 2007). The quick reduction of enrofloxacin resistance that we found after treatment had ended contrasts strongly with the long-term persistence after the ban of fluoroquinolone use in the United States (Price et al., 2007). In the in vivo experiments reported here, resistance against enrofloxacin was easily reverted after short-term exposure. In contrast, when a higher level of resistance had been reached in longer term in vitro experiments, these remained at that level after the selection pressure was removed (van der Horst et al., 2011).
The observation that co-resistance easily is selected is in agreement with the high levels of co-resistance found in chickens treated with subtherapeutic doses (da Costa et al., 2008). In that study, however, co-resistance against oxytetracycline was barely found, while here amoxicillin seems to considerably increase the percentage of oxytetracycline resistant strains. Possibly this is due to a different variety of multidrug-resistant strain present at the start of the two sets of experiments.
This study did not specifically differentiate between selection for strains already resistant and the effects of gene transfer, known to occur under the conditions applied (Poppe et al., 2005). The contribution of gene transfer was most probably minor, as only in the case of amoxicillin did a considerable level of resistance remain at the completion of the measurements. Such transfer is the result of a number of chance events and is known not to occur often in E. coli. The results of this study suggest that a short treatment at a high dose may be effective while selecting for less resistance than prolonged exposure. Carry-over at a level of 2.5% of the treatment dose did, under the circumstances of this study, only select for resistance during and immediately after the exposure, but the effects did not remain.
Conclusion
The outcome of this study suggests that the long-term effect of short periods of exposure to carry-over concentrations of antibiotics is limited. The selection for resistance by a reduced dose, 75% of the therapeutic dose, did not differ much from the full treatment. Therapeutic doses for a short time resulted in only one out of three cases in resistance at 12 days after the end of the treatment, but in other studies longer exposure has often been shown to yield permanent resistance. Therefore, if treatment of meat-producing animals with one of the three antibiotics tested here is necessary, a short therapy seems preferable. This outcome can be of assistance to farmers, veterinarians, and makers of agricultural policies with respect to the correct application of antibiotics.
Footnotes
Acknowledgments
We thank Dr. Maarten van Dongen for stimulating discussions. This study was financed by The Netherlands Ministry of Agriculture and The Netherlands Food and Consumer Product Safety Authority.
Disclosure statement
No competing financial interests exist.