
Abstract
The goal of this study was to determine the inactivation kinetics of Salmonella in commercial 10% salted liquid whole egg (LWE) to assist the U.S. Department of Agriculture in writing new liquid egg pasteurization guidelines. Current data are not sufficient for predicting thermal inactivation kinetics of Salmonella spp. for use in updating pasteurization guidelines for many types of liquid egg products, including salted LWE (SLWE). This is, in part, due to variations in Salmonella strains and changes in the processing of liquid egg products that have arisen in the past 40 years. Pasteurization guidelines are currently being reevaluated in light of recent risk assessments. Heat-resistant Salmonella serovars Enteritidis and Oranienburg were composited and mixed into 10% SLWE, resulting in final populations of approximately 5.7–7.8 log colony-forming units (CFU)/mL. Inoculated egg was injected into glass capillary tubes, flame-sealed, and heated in a water bath at 60, 62.2, 63.3, 64.3, or 66°C. Contents were surface-plated and incubated at 37°C for 24 h. Survival curves were not log-linear (log levels versus time), but decreased rapidly, and after initial periods became linear. Asymptotic decimal reduction values at each temperature were calculated from survivor curves with a minimum inactivation of 5.0 log CFU/mL. The asymptotic thermal D-values for SLWE were 3.47, 2.23, 1.79, 1.46, and 1.04 min at 60, 62.2, 63.3, 64.3, or 66°C, respectively. The calculated thermal z-value was 11.5°C. A model that predicts lethality for given times and temperatures that was developed predicted that the current pasteurization requirements for 10% SLWE (i.e., 63.3°C for 3.5 min, or 62.2°C for 6.2 min) are not sufficient to inactivate 7 log CFU/mL of Salmonella and only achieve approximately 4 log CFU/mL inactivation. This model will assist egg-products manufacturers and regulatory agencies in designing pasteurization processes to ensure product safety.
Introduction
T
The Code of Federal Regulations (2009) provides LE pasteurization time/temperature requirements. The current U.S. Department of Agriculture (USDA), Food Safety and Inspection Service (FSIS) risk assessment model (FSIS, 2005, Exec. Summary) estimates approximately 5500 U.S. cases/year of foodborne salmonellosis from contaminated pasteurized LE products (Latimer et al., 2008). They conclude that pasteurization to achieve 6, 7, or 8 log colony-forming units (CFU)/mL reductions in all egg products would reduce foodborne illnesses to approximately 3200, 320, and 32 cases/year, respectively. Incomplete inactivation kinetics data in numerous LE products make the accuracy of these estimates questionable.
Foodborne outbreaks of salmonellosis, possibly caused by contaminated pasteurized egg products, have been collected by the Centers for Disease Control and Prevention (CDC), Enteric Diseases Epidemiology Branch, as well as the USDA FSIS. Data supplied by CDC revealed that four outbreaks, potentially caused by contaminated pasteurized egg, have occurred since 2007 (CDC, 2012). One outbreak (2007) involved seven illnesses with S. enterica serotype Enteritidis (SE) from undercooked crab cakes prepared with pasteurized LE, reported by the Oregon State Health Department. Investigators reported that crab cakes were prepared in a solid mass, and SE-contaminated egg product, presumably from insufficient time/temperature pasteurization, was the likely source (CDC, 2012). Another 2007 outbreak involved 15 illnesses in Indiana from consumption of scrambled eggs from SE-contaminated pasteurized LE product; however, shell eggs, in the restaurant, were also a possible source, as they were subject to improper cold holding under the grill, along with the pasteurized product.
A more recent outbreak of salmonellosis attributed to pasteurized LE white (albumen) in 2010 infected 146 persons in the U.S. states of Ohio (chile relleno), Georgia, Massachusetts, Pennsylvania, West Virginia, and 87 in North Carolina (meringue-topped dessert). Salmonella serotype Enteritidis isolates were pulsed-field gel electrophoresis indistinguishable (Durham County, 2010; pers. commun., USDA-FSIS, 2012). CDC information related only to Ohio, where 56 individuals contracted salmonellosis from chillies rellenos made with pasteurized LE white (LEW) product. PFGE patterns from SE in stool samples were indistinguishable from SE patterns from the contaminated food. The restaurant was cited for refrigeration violations (CDC, 2012). Pasteurized LEW product was the likely, not confirmed, source. A temporally associated outbreak of SE infections occurred among North Carolina restaurant patrons consuming meringue-topped desserts made from pasteurized LEW product from the same egg-processing plant. Although a review of the egg products manufacturer, by FSIS, revealed no food safety deficiencies, and samples of egg products were Salmonella-negative, intermittent contamination of the LE product may have occurred and was not detected. The state health departments noted that food workers were not implicated as sources of contamination in any of the aforementioned outbreaks.
International outbreaks of salmonellosis in the United Kingdom and Japan have occurred from contaminated pasteurized LE products (UKFSA, 2007a, 2007b; Hara-Kudo and Takatori, 2009). Pasteurized LE products in North America occasionally test positive for Salmonella (Blais et al., 1998; Suzuki and Yamamoto, 2009). These details support the relevance of our present research. Generation of data for an array of LE products will assist in developing accurate models for predicting thermal inactivation kinetics of Salmonella used in updating pasteurization guidelines and provide helpful guidance to the LE industry.
We recently published predictive models for inactivation of Salmonella in LE yolk and 10% salted liquid yolk (Gurtler et al., 2011; Jordan et al., 2011). Few reports exist on inactivation kinetics of Salmonella in 10% salted LWE (SLWE).
Objectives of this study were to develop a thermal inactivation kinetics model for Salmonella serotypes Enteritidis and Oranienberg in 10% SLWE for temperatures between 60°C and 66°C with a three-strain composite of Salmonella serotypes Enteritidis and Oranienberg in commercially processed SLWE.
Materials and Methods
All materials and methods follow those previously reported (Gurtler et al., 2011), with minor modifications, as follows.
Preparation of bacterial strains
Salmonella included three of the four most heat-resistant isolates previously screened (Jordan et al. 2011). Salmonella strains were grown separately in 10 mL of tryptic soy broth (TSB) with 50 ppm nalidixic acid (NA) at 37°C/24 h, and one loop transfer for another 24 h to approximately 9 log CFU/mL and plated on tryptic soy agar (TSA) with 0.1% sodium pyruvate and 50 ppm NA (TSAPN). Strains were centrifuged at 22°C/10 min, supernatant decanted, and resuspended in 0.4 mL of 0.1% peptone water concentrating the population approximately 8.9 to approximately 9.4 log CFU/mL.
Preparation of 10% SLWE
All 10% SLWE was stored at −80°C in 50-mL tubes, thawed at 4°C for 24 h, pH measured, and bacterial microflora analyzed by duplicate plating 0.25-mL uninoculated SLWE on TSAPN. Suspensions (0.5 mL) of each Salmonella strain were individually added to 38 mL 10% SLWE (21°C) and mixed for 2 min. Inoculated SLWE (approximately 200 μL) was injected into 250-μL capillary tubes and flame sealed.
Physical quality determinations
SLWE was tested for physical quality attributes and proximate composition. Total solids were determined in triplicate on four separate subsets of SLWE, according to Jones (2007). Fat was measured with a Soxtec HT-12 fat extractor (Foss NA, Inc., Eden Prairie, MN) utilizing a procedure recommended by Foss (Foss Tecator Application Sub Note 3165, Rev 3.0). Quadruplicate determinations of approximately 1 g of sample with 4 g and dispersing agent were made from each of four subsets of SLWE (n=16). Four subsets of each SLWE were tested in triplicate for apparent viscosity (n=12). A RheoStress 600 rheometer (Thermo Material Characterization, Newington, NH) with a 60-mm cone and plate (C60 2 degree Ti, Thermo MC) set at 0.108 mm gap and 23°C was used. A controlled-rate linear ramp from 1.00 1/s to 50 1/s over a 45-s protocol determined viscosity at 10, 15, and 35 1/s, and calibrated with an S200 standard (Cannon Instrument, State College, PA). Samples were sealed with mineral oil during testing.
Thermal inactivation experiments and sampling
Capillary tubes were secured in a stainless-steel test tube rack and immersed in a circulating water bath (ThermoFisher Scientific NESLAB RTE17 Digital Plus). Digisense Thermocouple Flexible High Temperature Wire Probes connected to a Fluke 54 II Thermometer were placed in the water bath and affixed inside a capillary tube containing SLWE, which monitored come-up time and temperatures. LWE+10% NaCl samples were heated at 60°C up to 20 min, 62.2°C up to 21 min, 63.3°C up to 8.5 min, 64.3°C up to 6.3 min, and 66°C up to 3.2 min=58 thermal inactivation experiments. Capillary tubes were immersed in ice water for 10 s, surface-sanitized in 70% ethanol, followed by two sterile-water rinses. Capillary tube ends were removed with ethanol-flamed wire cutters and contents were expelled using sterile 3-mm pipe cleaners. Serial dilutions were spiral plated in duplicate on TSAPN and incubated (37°C/24 h). Undiluted egg samples (50 μL/plate) were spread plated on TSAPN. Colonies were counted using a Synbiosis åCOLyte Supercount. Presumptive-positive Salmonella were randomly confirmed by replica-plating on XLT4 agar and serological agglutination (Salmonella O Antiserum Poly A-I & Vi, Difco, Sparks, MD). Fifty survival curves were generated: six at 60°C; 11 at 62.2°C; 12 at 63.3°C; 10 at 64.3°C; and 11 at 66°C.
Statistical methods
We assumed a Poisson distribution for the distribution of plate counts and used the following model for determining primary survival curves:
where x(t) is the observed sample count at time t (sum of two plate counts for the sample); r is a factor that transforms plate counts to levels (CFU/mL) and depends on dilution and fractional portions of plates used to attain countable numbers of CFUs for the sample (as explained above); n0 is a constant (assumed unknown) representing log initial level at t=0; f(t|θ) is an appropriately selected function of time and parameters, θ, whose values are estimated from data; λ(t) is the expected number of CFUs to be counted for the sampled portion; and ɛ is an error term representing between-sample error, assumed to be normally distributed with 0 mean and standard deviation σ. We examined graphically to determine appropriate functions to use. Calculations were performed on SAS® (SAS Institute Inc., Cary, NC) version 9.2, PROC NLMIXED, using default assumptions and procedures. Goodness-of-fit comparisons were made using standard deviance measure, equal to the negative of twice the likelihood value, or the Akaike's information criterion, when models being compared were not nested. For testing between two models, one nested within the other, we used the likelihood ratio statistic, approximated by a chi-square with degrees of freedom equal to the difference of numbers of parameters for the two models.
Secondary models
Estimated values of θ were plotted against temperature and examined with the intention of finding simple functions to be used for modeling. The secondary model for θ is G(T|h θ)+E, where G (to be determined) is a function of temperature (T °C), he is the vector of estimated values of h, and E is a vector of error terms. Predicted log reductions for a given time and temperature are derived from -f(t|G(T|he )), assuming error terms are equal to 0. Standard errors of these predictions were obtained using linearization, computing the derivatives of -f(t|G(T|h)), with respect to h, calculated at he and the covariance error matrix of he . Log reductions are expressed by a negative number; the negative of this value is referred to as the lethality. Analyses were performed using SAS® PROC model, with the seemingly unrelated regression option.
Results
Come-up and cool-down times, and physical attributes
Come-up times for 10% SLWE in capillary tubes at all temperatures ranged from 5 to 8 s, and cool-down times were 3 s. The pH of 10% SLWE was 7.08, with proximate compositions of 31.87±0.06% total solids, 11.33±0.31% fat, and apparent viscosities of 0.13±0.02 at 10 1/s shear rate, 0.11±0.01 at 15 1/s shear rate, and 0.08±0.01 at 35 1/s shear rate.
Control samples and salmonellae confirmation
No bacterial microflora from SLWE was recovered on TSAPN. Mean log CFU/mL counts in inoculated 10% SLWE were 7.1 log CFU/mL (all confirmed to be Salmonella).
Model for 10% SLWE
Figure 1 displays our model-based estimated expected survival curve of Salmonella for each temperature, together with 97.5% lower and upper confidence bounds, and observed log levels for different inactivation experiments for Salmonella, when pasteurized in 10% SLWE at specified temperatures. To display nondetected samples (those for which no CFUs were found), we assigned values to these samples equal to log(0.7) minus log of observed initial value at time=0 for the survival curve, as depicted with red triangles in Figure 1.
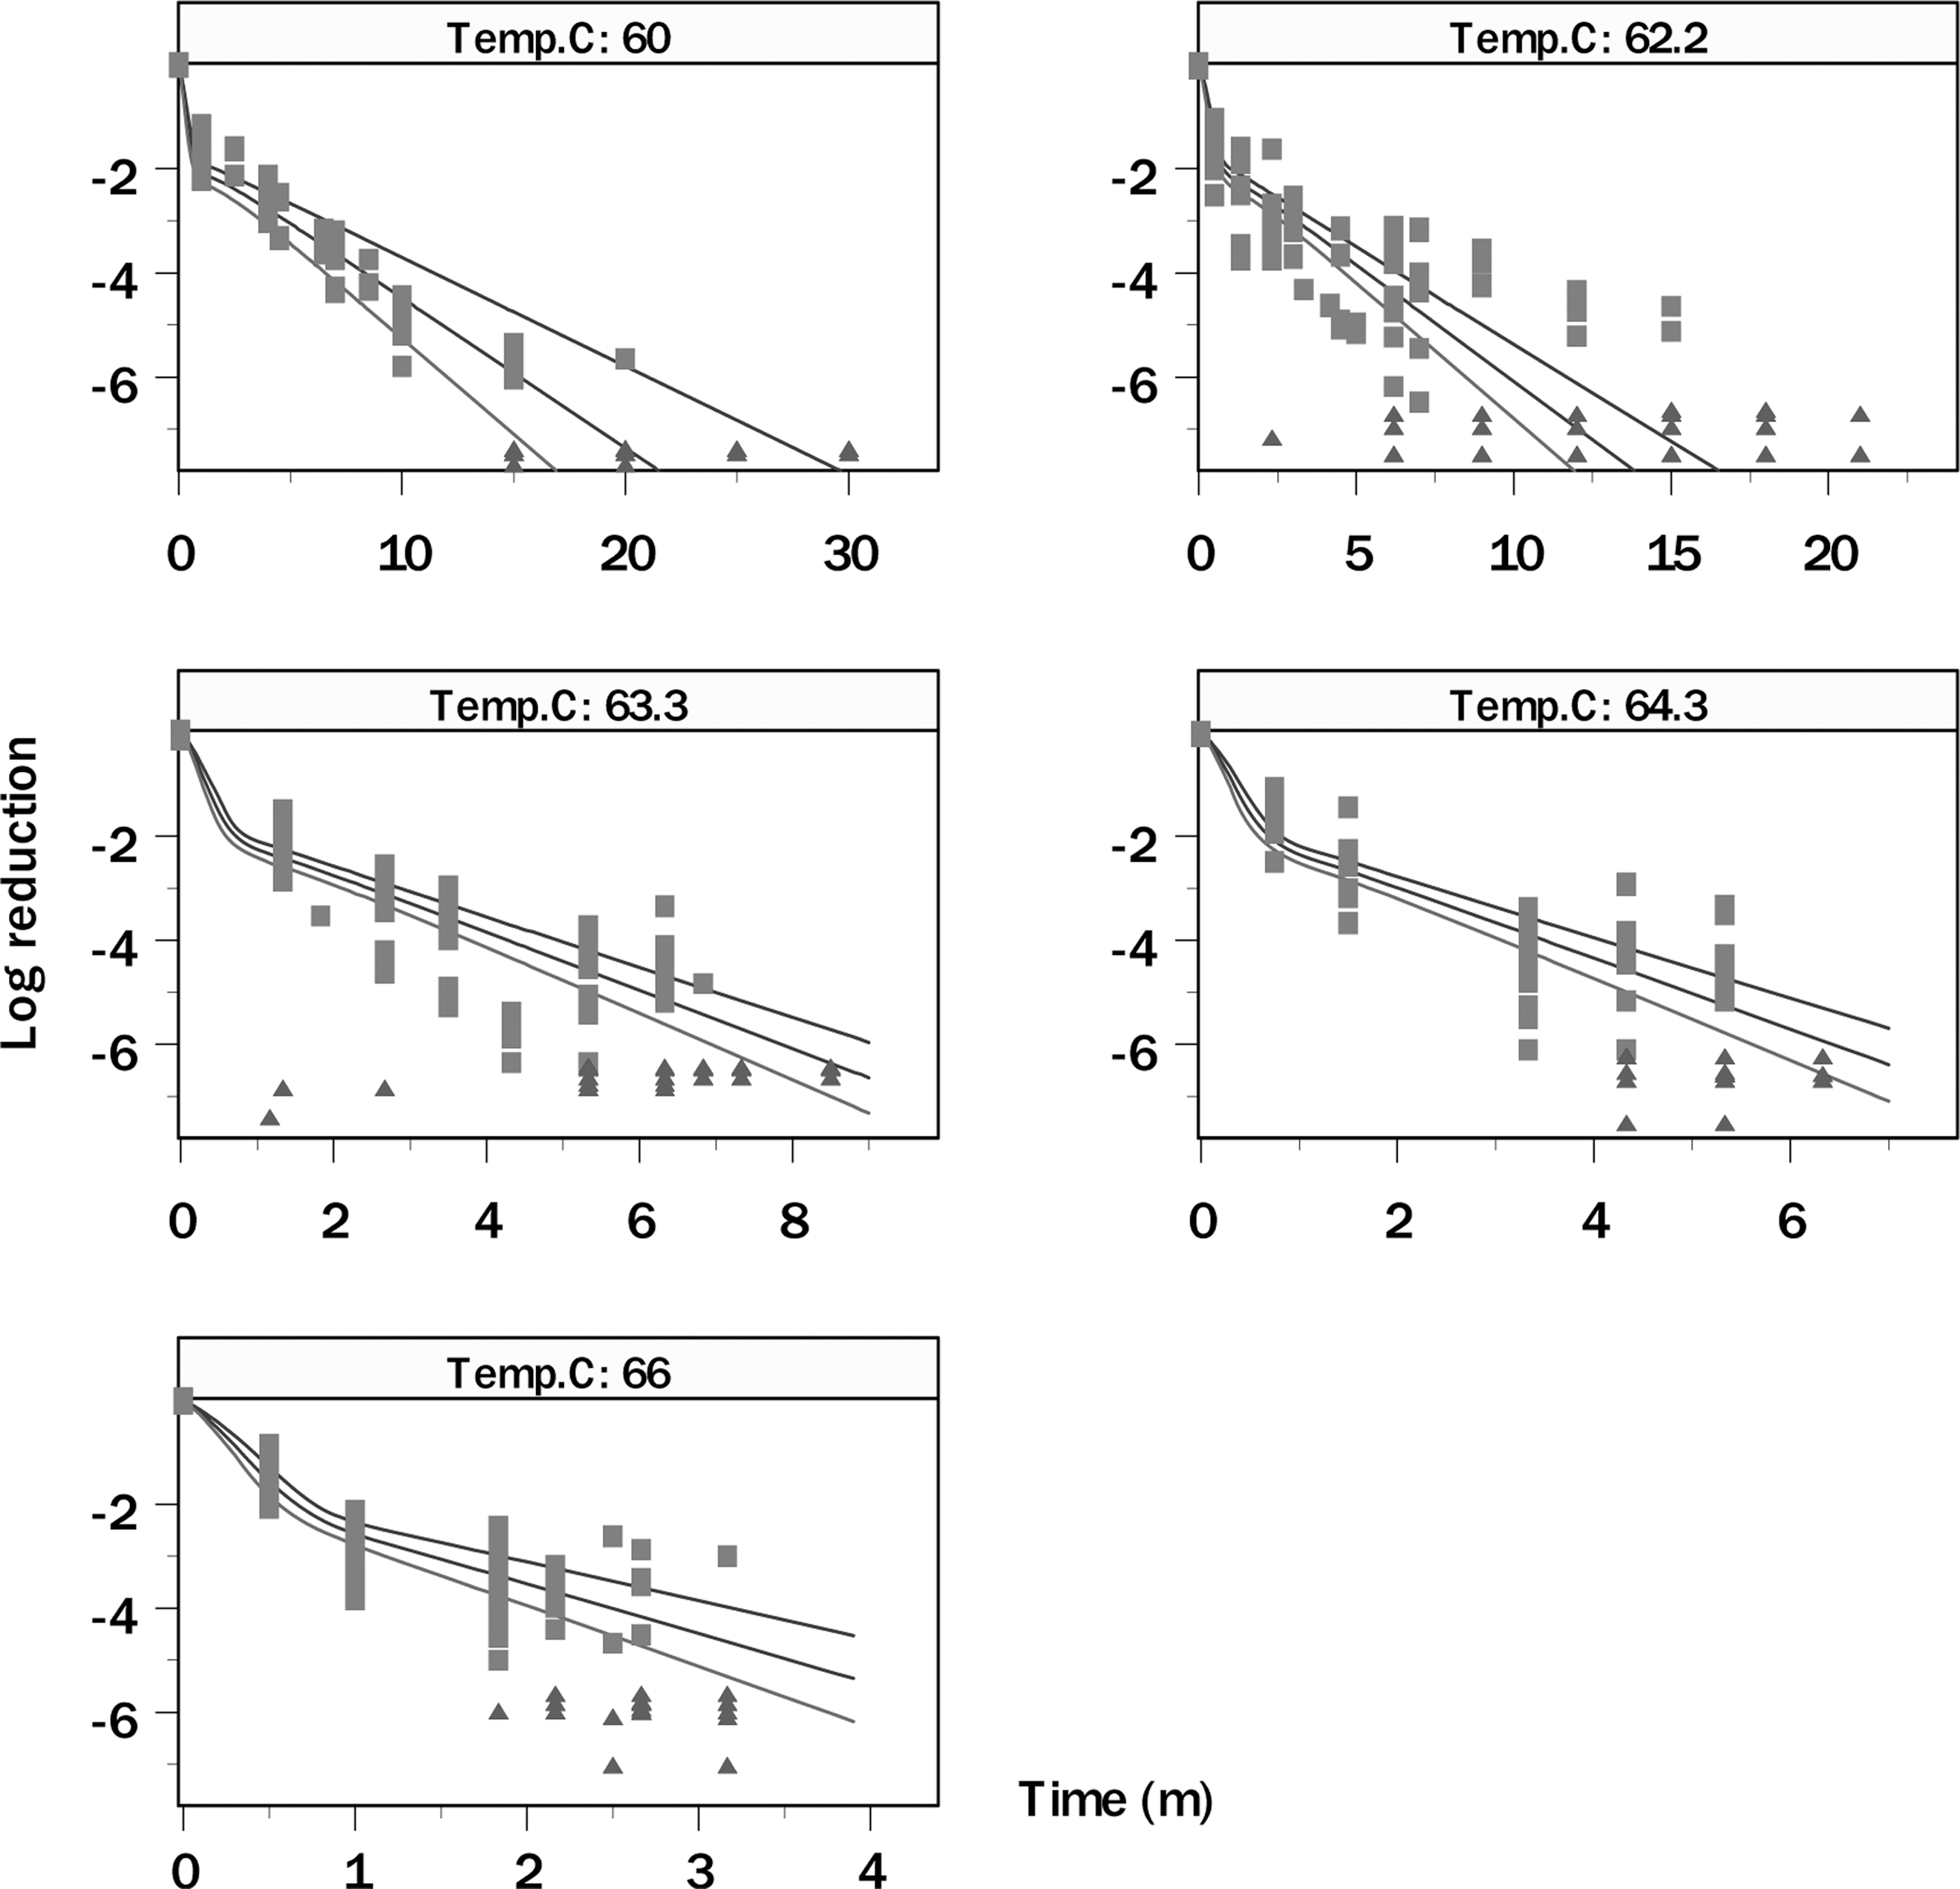
Fitted expected survival curves of Salmonella, together with 97.5% lower and upper confidence bounds, and observed log reductions (squares) when pasteurized in 10% salted liquid whole egg at specified temperatures. On the graph, the nondetect values (triangles) were assigned the value of 0.7 log above the log of the measured level at time=0.
Primary survival curves for detectable levels in all cases appeared convex. We compared two models: (1) one based on the Weibull distribution (Peleg, 2000),
where b and c are positive values estimated from the data; and (2) the other, a three-parameter mixture of exponential inactivations (Kamau et al., 1990):
where b and c are non-negative parameter values, and w is a weight between 0 and 1. The Weibull survival curve, when c≠1, does not have an asymptotic D-value because the survival curve does not, as time gets long, approach linearity with a nonzero, finite, slope. For the mixture survival curve, there is an asymptotic D-value equal to ln(10)b −1. The “initial” D-value (i.e., negative inverse of slope of survival curve near time=0) is approximately 2ln(10)(b+c)−1, when w is small (as it is in our model).
Since the sum of Akaike's information criterion values was smaller by nearly 500 for the mixture model compared to the Weibull model, the analysis suggests that the former model would be better for generally describing the shape of observed survival curves.
In examining values of secondary parameters, we noted that for the mixture model, only the asymptotic D-value had a discernible relationship with temperature. We transformed weight, w, by a logit, defined as ln(w/(1-w)), where ln() is the natural logarithm function. One set of estimated values of θ at 64.3°C was clearly deviant from others, with a logit(w) less than −10, and thus, for fitting a secondary model, the data from this experiment were deleted. Figure 2 presents asymptotic thermal death curves (log asymptotic D-values versus temperature), and the log of initial D-values and logit of w, versus temperature (°C), excluding the abovementioned data point. The relationship of log(asyD) with temperature appears linear, where an additional quadratic term was not significant (p-value=0.89). Thus, Equation 4 was used to describe the expected value of log10(asyD), labeled y:
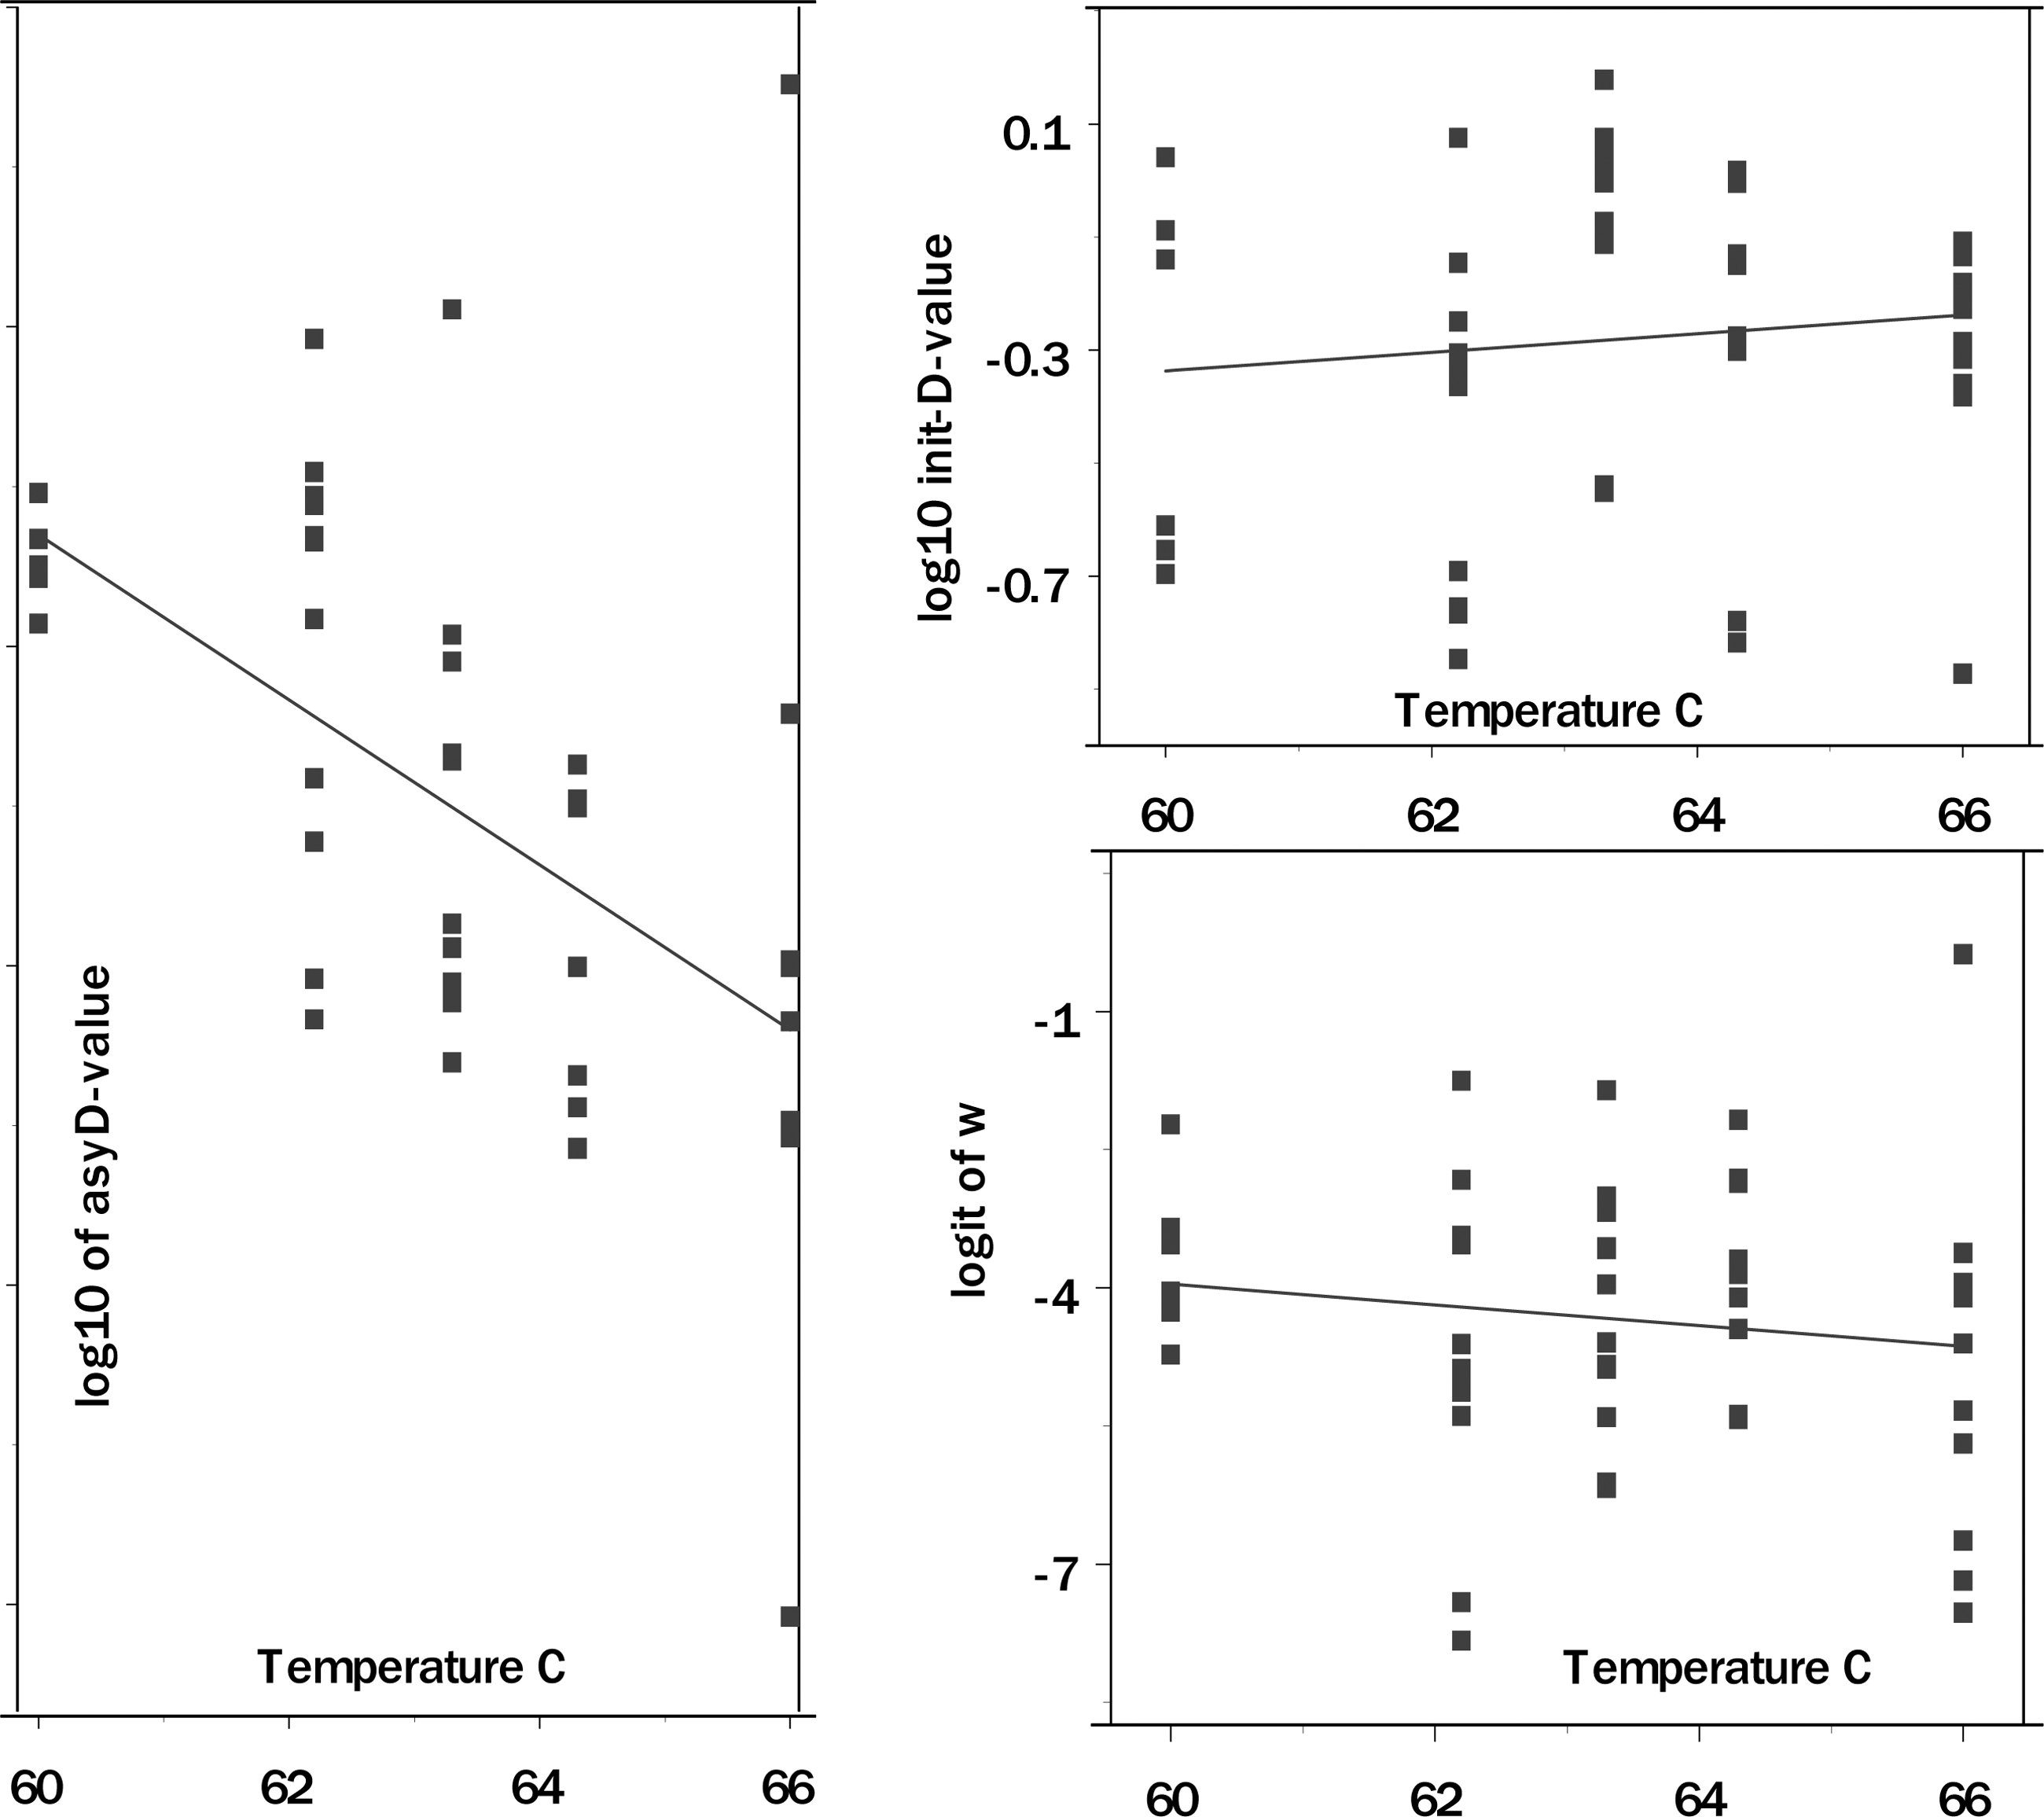
Plots of estimated parameter values for three-parameter mixture model: graph on left is plot of log10 of asymptotic D-values versus temperature C; top right is plot of initial D-values, and bottom right is plot of logit of mixture proportion, w (Equation 4).
where h 1 and h 4 are the unknown intercept and slope estimated from the data. For the other two parameters, log10(init-D) and logit(w), we assumed they have a constant expected value, h 2 and h 3, respectively. The negative inverse of h 4 is the asymptotic z-value, corresponding to normal use of the terms d- and z-values.
A similar examination of estimated parameters of the Weibull survival curve as a function of temperature leads to a secondary model with four fixed parameters. Figure 3 presents plots of natural logarithm of values of b and c of Equation 2.
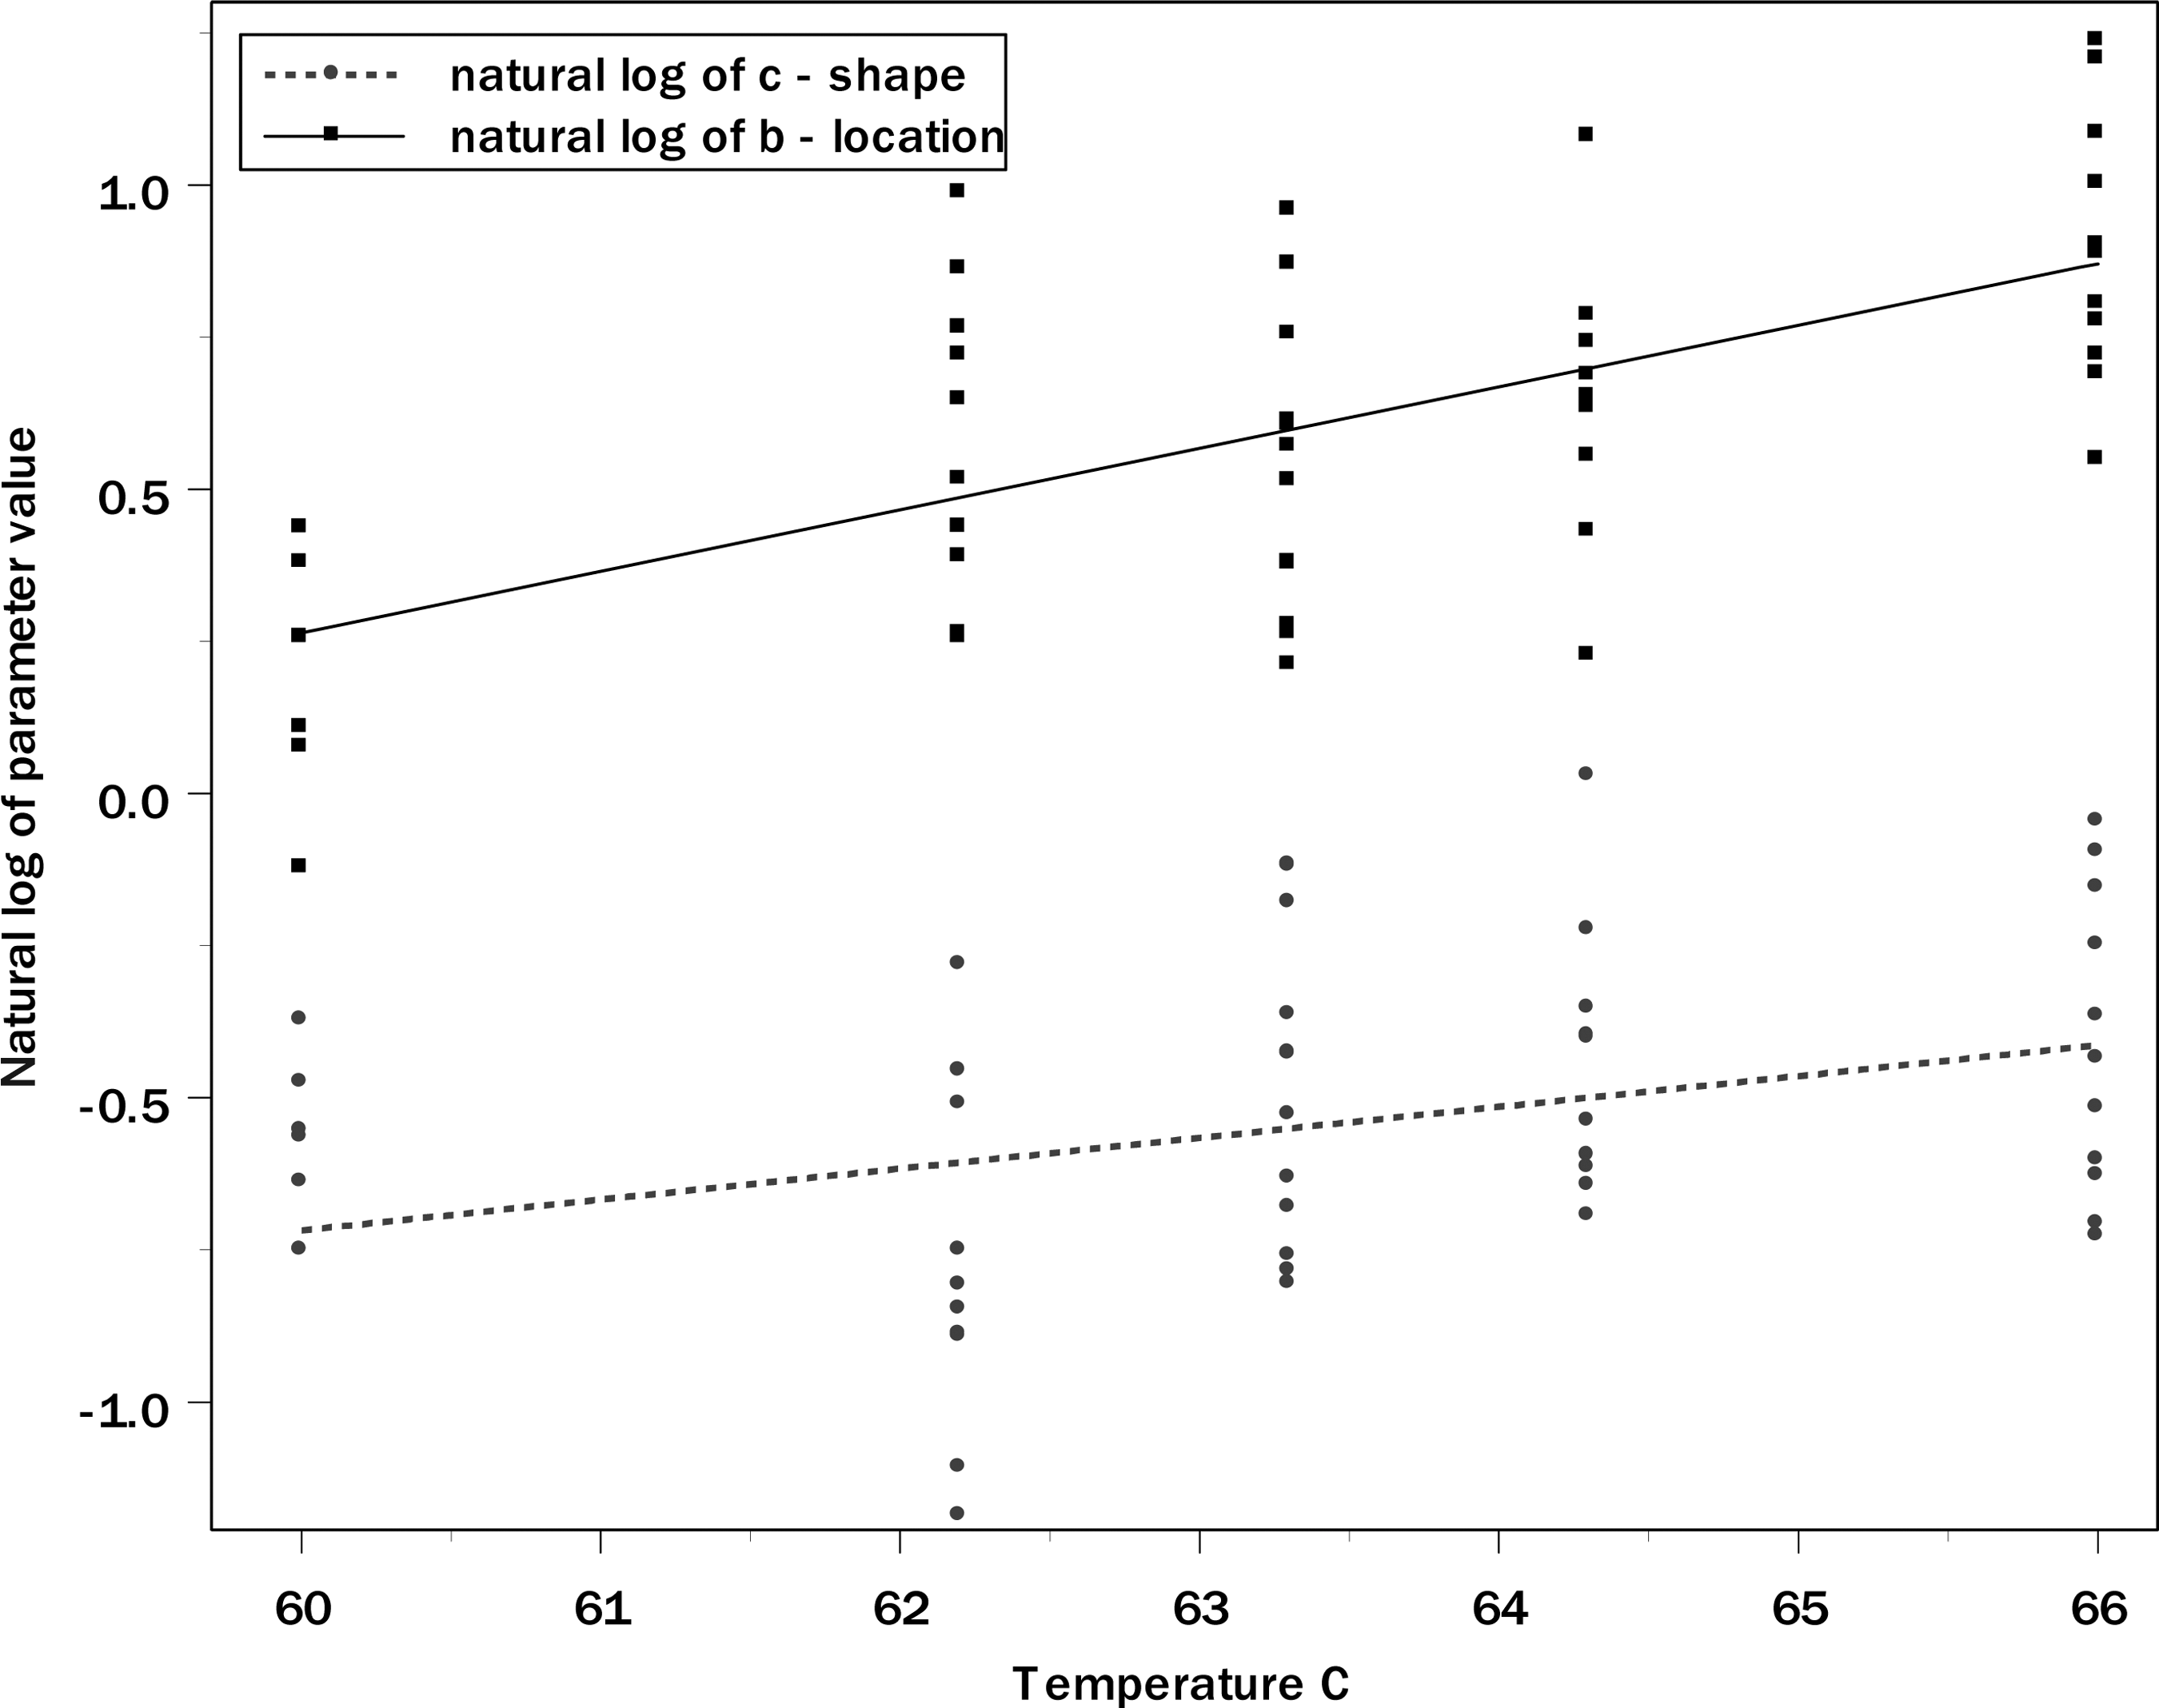
Plots of natural log of Weibull survival curve estimated parameter values together with ordinary least squares (OLS) linear regression lines (shape, dotted line; location, solid line).
Figure 4 provides plots of fitted curves for predicting log reductions and observed log reductions computed by subtracting log of measured initial levels (t=0) from log of measured level at time t. Data points with y-axis value equal to −7 log10 were those for which results were nondetected (no cells found on analyzed sample). The two models provide similar predictions for four larger temperatures: 62.2, 63.3, 64.3, and 66°C; however, at 60°C, the Weibull model provides predictions generally larger than corresponding observed values and thus does not fit well with observed data. Consequently, we use the three-parameter model. Table 1 provides the estimates of parameter values, h j, j=1,…, 4, their standard errors, and the error correlation matrix of estimates. Table 2 provides estimates of asymptotic D-values for 10% SLWE at temperatures studied in this research, together with standard errors, in comparison to D-values from one previously published study.

Plot of observed log reductions and predicted log reductions from Weibull (dotted line) and three-parameter (solid line) models, by temperature. Points at −7 log are those for which no cells were found.
Model: Three parameters define the model, using four variables: h 1,…, h 4
log10(asymptotic D-value)=h 1+h 4(T-60°C).
log10(initial D-value)=h 2.
logit(w)=h 3.
First row are the estimated values; the second row is the estimated standard error, and the subsequent rows provide the error correlation matrix.
SE, standard error.
Asymptotic D-values are D-values for larger times, reflecting the inactivation kinetics after an initial large log reduction. The z-value is estimated from a linear regression of log of the above values; this value is provided for use for comparison purposes with other published values and is not meant to be used for predictions.
D-values for our study are asymptotic D-values.
Standard error.
Jung and Beuchat, 2000.
Discussion
Among SE strains isolated from U.S. pasteurized LE products, PT8 is the most common phage type. Among isolates used in our study, SE PT8 C398 was isolated from a laying hen ovary and SE PT8 C405 was isolated from a contaminated egg-yolk outbreak. Both isolates, previously used in U.S. Food and Drug Administration pasteurization studies, were provided by the U.S. Food and Drug Administration (Shah et al., 1991). Our third isolate (Salmonella serotype Oranienburg DD2229) was originally provided by Dupont from their Salmonella library (Jensen and Hubner, 1996). Salmonella serotype Oranienburg is, historically, a common strain of Salmonella used for LE pasteurization studies (Gibbons and Moore, 1944; Schneider, 1946; Solowey et al., 1946; Winter et al., 1946; Cantor and McFarlane, 1949; Solowey et al., 1949; Anellis et al., 1954; Cotterill, 1968; Cotterill and Glauert, 1969; McBee and Cotterill, 1971; Cotterill and Glauert, 1972; Cotterill et al., 1973). The estimated asymptotic z-value of Salmonella in 10% SLWE is 11.5°C (standard error=2.1°C), which is approximately 85% higher than the 6.2°C reported by Jung and Beuchat (2000), while our estimated asymptotic D-values are also larger (Table 2) than these authors reported. A contributing reason for this difference is that our D-values are asymptotic, applying for large times within biphasic-shaped survival curves; thus, estimated asymptotic D-values would be larger than estimates not accounting for biphasic inactivation.
Estimated lethalities at selected times/temperatures, together with upper and lower 97.5% confidence bounds, are given (Table 3). Egg products composed of 10% SLWE (9 CFR 590.570, Table 1 [Code of Federal Regulations, 2009]), requires pasteurization for a minimum 3.5 min at a minimum of 146°F (63.3°C), or a minimum of 6.2 min at a minimum of 144°F (62.2°C). Nevertheless, our model provides (Table 3) that for 3.5 min at 146°F, expected lethality of the Salmonella used in our study is only approximately 3.6 log and, for 6.2 min at 144°F, the expected lethality is only approximately 4.4 log.
Very few published studies address the thermal resistance of Salmonella in 10% SLWE, providing little precedent to compare our results, although Table 2 compares our results to those of Jung and Beuchat (2000). Ng et al. (1979) reported that Salmonella serotype Typhimurium TM-1 inoculated into 10% SLWE did not undergo significant inactivation when pasteurized at the USDA temperature/time combinations (63.3°C for 3.5 min). However, the authors indicated that when inoculated into 10% SLWE at 9 log CFU/mL and pasteurized for 3.5 min, reductions were 2.7, 5.1, 8.4, and >9.6 log CFU/mL at 64, 65, 66, and 68°C, respectively.
Conclusions
In conclusion, we present a mathematical model of thermal inactivation kinetics for Salmonella in commercial 10% SLWE for temperatures between 60°C and 66°C (144–150°F), using a three-strain composite of heat-resistant Salmonella selected for spontaneous mutants resistant to 50 ppm NA. Our model predicts, for example, at the present required minimum pasteurization temperatures for the minimum required times, expected lethalities of only about 4 log. A convex shape, with asymptotic D-values, characterizes the model's primary survival curves. Processors can use this model to help design their pasteurization systems, ensuring production of safe 10% SLWE.
Footnotes
Acknowledgments
The authors thank USDA reviewers, Allen Sheen and Dike Ukuku, for proofreading. Liquid egg products were provided by Michael Foods, Gaylord, MN. Technical assistance was provided by Patsy Mason and Victoria Broussard. This research was funded based on needs prioritized by the USDA, FSIS. Special thanks to DVM Kristin G. Holt, USDA, FSIS, OPHS, OAA, liaison to CDC and Karen M. Herman, CDC Enteric Diseases Epidemiology Branch, for assistance with CDC foodborne outbreak information.
Disclosure Statement
No competing financial interests exist.