




Abstract
Shiga toxin–producing Escherichia coli (STEC) are associated with foodborne illnesses, including hemolytic uremic syndrome in humans. Cattle and consequently, beef products are considered a major source of STEC. E. coli O157:H7 has been regulated as an adulterant in ground beef since 1996. The United States Department of Agriculture Food Safety and Inspection Service began regulating six additional STEC (O145, O121, O111, O103, O45, and O26) as adulterants in beef trim and raw ground beef in June 2012. Little is known about the presence of STEC in small and very-small beef-processing plants. Therefore, we propose to determine whether small and very-small beef-processing plants are a potential source of non-O157:H7 STEC. Environmental swabs, carcass swabs, hide swabs, and ground beef from eight small and very-small beef-processing plants were obtained from October 2010 to December 2011. A multiplex polymerase chain reaction assay was used to determine the presence of STEC O-groups: O157, O145, O121, O113, O111, O103, O45, and O26 in the samples. Results demonstrated that 56.6% (154/272) of the environmental samples, 35.0% (71/203) of the carcass samples, 85.2% (23/27) of the hide samples, and 17.0% (20/118) of the ground beef samples tested positive for one or more of the serogroups. However, only 7.4% (20/272) of the environmental samples, 4.4% (9/203) of the carcass samples, and 0% (0/118) ground beef samples tested positive for both the serogroup and Shiga toxin genes. Based on this survey, small and very-small beef processors may be a source of non-O157:H7 STEC. The information from this study may be of interest to regulatory officials, researchers, public health personnel, and the beef industry that are interested in the presence of these pathogens in the beef supply.
Introduction
Materials and Methods
Bacterial strains
E. coli strains O157, O145, O121, O113, O111, O103, O45, O26 (Ørskov et al., 1977), and DH5α were obtained from the Penn State E. coli Reference Center (Department of Veterinary and Biomedical Sciences, University Park, PA) and were used as reference strains for culture-positive and polymerase chain reaction (PCR)–positive identification.
Experimental design
Samples were collected from seven different small and very-small beef processors throughout the state of Pennsylvania and one plant in New Jersey over a 14-month period (October 2010 to December 2011). Samples collected at each processing plant included environmental swabs and carcass swabs. Representative environmental samples were collected at each processing plant including the following: lairage, chute/slaughter area, de-hiding machinery/cradles, hide knives, split saws, sinks, drains, viscera collection sites, head racks, and processing tables. Due to the small number of animals processed at the very-small processing facilities, carcass samples were collected from each animal slaughtered on every day of collection. Carcass samples were collected pre-intervention, immediately following surface trimming. When possible, hide samples also were collected. Additionally, ground beef samples were collected from the processors, or small retail stores. Purchased ground beef samples were traced to ensure a small or very small processor origin, using United States Department of Agriculture (USDA) establishment numbers. Combined, a total of 620 samples were collected, including 272 environmental swabs, 203 carcass swabs, 27 hide samples, and 118 ground beef samples.
Sample collection
Environmental samples
Samples were collected as described previously (U.S. Department of Agriculture, 2009). Briefly, a Spongesicle® sampling swab (Biotrace International; Seattle, WA) was moistened with 25 mL of sterile buffered peptone water wrung out, and aseptically removed from the bag. Sampling was performed aseptically, consisting of 10 passes vertically, 10 passes horizontally, and 10 passes diagonally. For each environmental sample, approximately 1 square foot was swabbed. The sample was stored in the collection bag at 4°C until processing, and within 24 h of collection.
Carcass samples
Samples were collected as described previously (Barkocy-Gallagher et al., 2002; U.S. Department of Agriculture, 1996). Briefly, a 3M™ dry-sponge (3M™, St. Paul, MN) was moistened with 25 mL of buffered peptone water, wrung out, aseptically removed from the bag, and used to sample one half of the carcass using a sterile 100-cm2 template (3M™, St. Paul, MN). Sampling was performed aseptically, by passing the sponge 10 times vertically and 10 times horizontally through the sampling template at each of the three sampling sites on the carcass: the flank, brisket, and rump. The sample was stored in the collection bag at 4°C until processing, and within 24 h of collection.
Hide samples
Samples were collected as described previously (Barkocy-Gallagher et al., 2002; U.S. Department of Agriculture, 1996), using the sponge-swab protocol described for carcass sample collection.
Ground beef samples
Fresh samples were collected at the processing plant, retail store, or local markets throughout the state of Pennsylvania and held at 4°C until processing, within 24 h of collection.
Sample enrichment
Environmental, carcass, and hide samples
Samples were processed within 24 h of collection. Swabs were stomached at 230 rpm for 2 min in the sample collection bag (Stomacher® 400 Circulator, Steward®, United Kingdom), wrung out, and the stomachate was collected aseptically. The collected stomachate of each sample was enriched as previously described (Possé et al., 2008), by combining 1:4 with modified tryptic soy broth (mTSB) containing 8 mg/L novobiocin (VWR International, Radnor, PA) and 16 mg/L vancomycin (Oxoid Microbiology, Hampshire, UK), and pre-enriched at 37°C for 6 h. Following pre-enrichment, 2 mg/L rifampicin (Sigma-Aldrich, St. Louis, MO), 1.5 g/L bile salts (Difco Laboratories, Detroit, MI), and 1 mg/L potassium tellurite (Sigma-Aldrich, St. Louis, MO) were added, and samples were enriched for an additional 18 h at 42°C. Following this, an aliquot of the enrichment was collected for DNA isolation and PCR analysis, and for cultural isolation.
Ground beef samples
Samples were enriched according to USDA guidelines for detection and isolation of non-O157 STEC from meat products (U.S. Department of Agriculture, 2010), with minor modifications. Briefly, 1-lb ground beef packages were aseptically opened, 325 g of ground beef were transferred aseptically to a filtered stomacher bag (Interscience, Rockland, MA), diluted in 975 mL mTSB and stomached for 2 min at 230 rpm. The stomachate of each sample was enriched as described previously.
E. coli detection
DNA isolation was performed on a 1-mL aliquot of each enrichment, using Epicentre Biotechnologies' MasterPure™ DNA Purification Kit (Madison, WI), according to manufacturer's instructions with minor modifications. DNA was tested for the presence of eight STEC O-groups (O157, O145, O121, O113, O111, O103, O45, and O26) using a previously described multiplex PCR assay (DebRoy et al., 2011; Valadez et al., 2011). DNA was also tested for the presence of the virulence genes stx1, stx2, and eae, utilizing previously described primers and reaction conditions (Paton and Paton, 1998a).
Culture isolation
Broth samples that were PCR-positive for an STEC O-group or virulence gene were immediately subjected to immunomagnetic separation, selective for serogroups O157, O145, O111, O103, and O26 (IMS; Invitrogen Life Technologies, Grand Island, NY) following the manufacturer's protocol. The sample was streaked for isolation on Rainbow® Agar (Biolog, Hayward, CA) modified with 10 mg/L novobiocin (U.S. Department of Agriculture, 2010), and incubated for 18–24 h at 37°C. Following incubation, 5–15 isolates were collected from each plate, grown in TSB for 18–24 h, and analyzed for STEC O-group, stx1, stx2, and eae gene presence using the previously mentioned multiplex PCR assays.
Statistical analyses
Data from STEC analyses were reported as percentages of samples testing positive for each of the tested pathogens and virulence genes, divided by the total samples taken. Differences of percentage positive samples for different O-groups within each sample type and plant identified were determined using a Proc GLM test with a Tukey separation of means (SAS Program, Cary, NC). Differences of percentage positive samples for each O-group between all sample types were determined using a Proc Mixed test with an LSMeans separation.
Results
STEC prevalence in total samples
Overall, 248 (41.8%) of the 593 total sample size tested positive for one or more of the tested O-groups. However, only 32 (4.9%) tested positive for stx1 and/or stx2, suggesting the presence of an STEC strain, and only 54 (8.3%) tested positive for the eae gene. Additionally, of the 248 samples that tested positive for an O-group, 14 tested positive for both the stx1 and/or stx2 and the eae genes. All samples that tested positive for a virulence gene also tested positive for an O-group (Table 1 and Fig. 1).
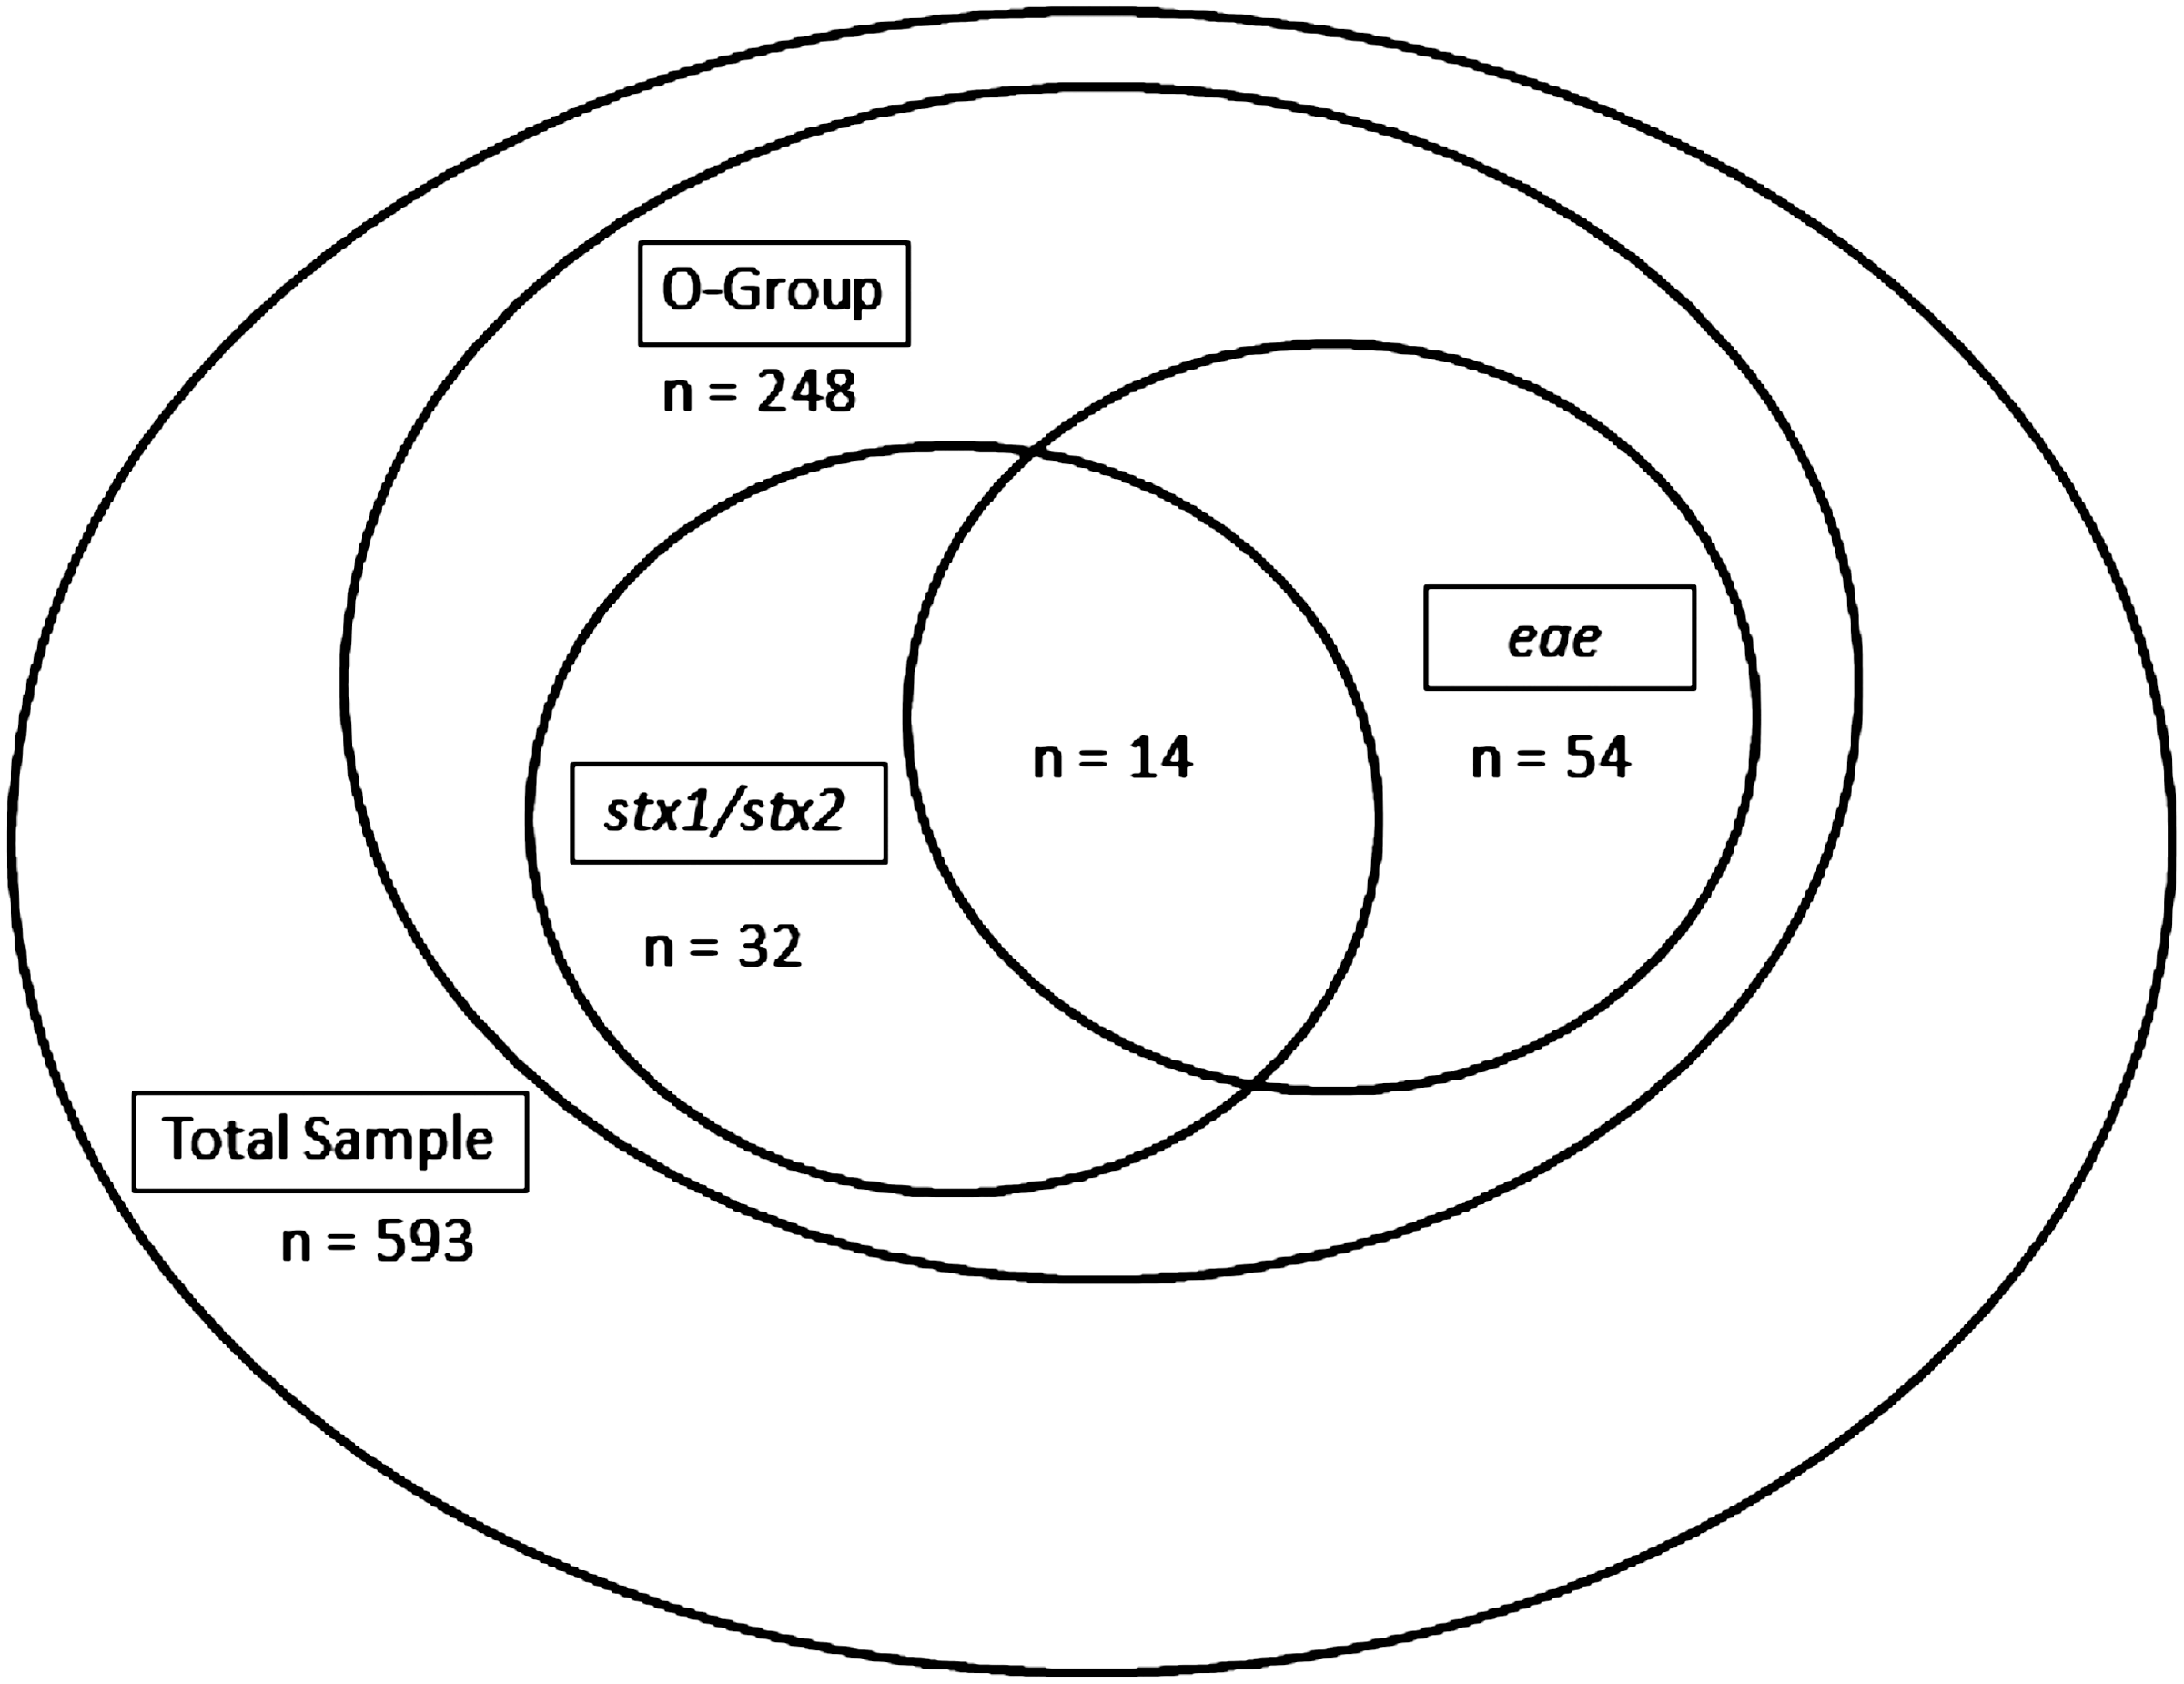
Total sample size, number of samples that tested positive for a Shiga toxin–producing Escherichia coli O-group, and number of samples that tested positive for virulence genes: stx1, stx2, and eae.
Percentages within each sample type bearing a common letter are not significantly different (p>0.05).
stx1 and eae: Samples within this column tested positive for both stx1 and eae, but samples are not additional to those testing positive for stx1 in the stx 1 column.
stx2 and eae: Samples within this column tested positive for both stx2 and eae, but samples are not additional to those testing positive for stx2 in the stx 2 column.
stx1 and stx2: Samples within this column tested positive for both stx1 and stx2, but samples are not additional to those testing positive for stx1 or stx2 in previous columns.
stx1 stx2 and eae: Samples within this column tested positive for all three virulence genes, but samples are not additional to those testing positive in previous columns.
STEC prevalence in environmental swabs
Overall, 151 (55.5%) of the 272 environmental samples tested positive for one or more O-groups. However, only 21 (7.7%) tested positive for stx1 and/or stx2, suggesting the presence of an STEC strain. Of the 7.7% testing positive for a stx gene, 11 (4.0%) tested positive for the eae gene (Table 1). The O-groups most commonly found in environmental samples include O157, O121, and O45 (Table 2).
Percentages within each sample type bearing a common letter are not significantly different (p>0.05).
STEC prevalence on carcasses
Overall, 75 (36.9%) of the 203 pre-intervention carcass samples tested positive for one or more O-groups. However, only 8 (3.9%) tested positive for stx1 and/or stx2. Of these, 4 (2.0%) tested positive for the eae gene (Table 1). The O-groups most commonly found in carcass samples included O157, O121, O103, and O45 (Table 2).
STEC prevalence on hides
A limited number of hide samples indicated that hides were heavily contaminated with O-groups, but very low numbers of the samples were stx1 and/or stx2 positive. Overall, 23 (85.2%) of the 27 samples tested positive for one or more STEC O-groups. However, no samples tested positive for stx1 and/or stx2. The STEC O-groups most commonly found in hide samples included O121, O103, O45, and O26 (data not shown).
STEC prevalence in ground beef
Overall, 22 (18.6%) of the 118 samples tested positive for one or more O-groups. However, no samples tested positive for stx1 and/or stx2 (Table 1). The O-groups most commonly found in ground beef samples included O157 and O103 (5.1% and 4.2%, respectively), although the prevalence was not significantly different from any other O-groups (Table 2).
E. coli culture isolates
Overall, 117 O-group-positive isolates were obtained from the collected samples. The isolates most commonly identified belong to O-groups O45 and O121, while the least commonly isolated O-groups include O113 and O111 (Table 3).
Isolates are identified by letters (A–N) to maintain processing plant and vendor confidentiality.
Discussion
Foodborne illnesses have been attributed to STEC (O157 and non-O157) since the early 1980s (U.S. Department of Agriculture, 2010). Non-O157 STEC have been under-reported due to the inability of laboratories to identify and characterize these pathogens, and because there has been insufficient testing for non-O157 STEC (Bettelheim, 2007). However, recent improved detection methods have indicated the prevalence of non-O157 STEC to be similar to that of O157 STEC (Samadpour et al., 1994; Brooks et al., 2001; Bettelheim, 2003; Fratamico et al., 2011; Monaghn et al., 2011). An increasing concern over non-O157 STEC contamination of food in the United States—beef products in particular—has led to regulations for six non-O157 STEC in raw, nonintact beef. A study completed in large Midwestern beef-processing plants indicated that non-O157 STEC are prevalent in the processing-plant environment (Bettelheim, 2003). To the best of our knowledge, no studies have been conducted to reveal the presence of non-O157 STEC in small or very-small processing-plant environments. The current study utilized previously developed molecular detection methods to detect the presence of non-O157 STEC in small and very-small beef-processing plants in the state of Pennsylvania and one in New Jersey. In this study, all sample types (environmental, carcass, and ground beef) tested positive for STEC O-groups and in all plants surveyed. Of all sample types, environmental samples tested positive more frequently, which supports previous research in this area (Bettelheim, 2003; Ransom et al., 2002). The number of samples between sample types was not equal, with hide sample sizes considerably smaller than environmental, carcass, and ground beef samples. A more even sample size would be needed to directly compare contamination level and prevalence of O-groups among environmental and hide samples. Additionally, our study was not designed to look for seasonal variations in STEC prevalence (Zhao et al., 1995; Shere et al., 1998; Bettelheim, 2003). When considering all samples, O-groups O157, O45, O121, and O103 were most prevalent and detected at similar rates. While the target O-groups were prevalent in beef processing environments and resulting beef products, samples testing positive for a Shiga toxin gene were significantly lower, suggesting that Shiga toxin–negative E. coli of the O-groups studied here are common in small and very-small beef processing environments, while STEC strains are less so. This result may be problematic, considering the nature of rapid detection methods available to beef processors, which indicate the presence of serogroups but do not have the capabilities of detecting variances in the presence of STEC virulence genes, such as stx1/2 and eae (Medina et al., 2012).
Within individual small and very-small beef-processing plants surveyed, specific O-groups were more prevalent in some plants than in others (data not shown). This observation is consistent with a previous report (Small et al., 2002) that some processing plants may have specific pathogens within their environments. Additionally, O-groups most prevalent in some processing plants were non-O157 serogroups, indicating that O157:H7 may not be the only STEC prevalent in beef processing environments. Additional surveys of non-O157 STEC within small and very-small beef-processing plants that focus on more specific areas in the beef processing environment may result in a better understanding of the path that these pathogens take to reach the final product (Elder et al., 2000), and may help researchers determine effective methods of controlling these pathogens through interventions. Additionally, survey work looking more specifically at beef trim used to process ground beef, with a larger sample size, may indicate the prevalence of these STEC in raw ground beef products processed and sold from small and very-small beef-processing plants (Erickson and Doyle, 2007). Lastly, a similar survey of nonbeef products such as venison (Rounds et al., 2012) that are processed at these establishments may be of interest to researchers and public health personnel, as these products are often processed in the same environments of these small and very-small processing plants. Overall, results from this study could help researchers and regulatory personnel determine how best to regulate these small and very-small facilities. By having data from these plants, researchers and regulatory officials also have an established baseline for the presence of non-O157 STEC in small and very-small processing establishments and resulting beef products located in Pennsylvania. This information can be a starting point to help determine best practices or adequate interventions to prevent STEC contamination of the beef supply originating from them.
Footnotes
Acknowledgments
Funding for this project was provided by the USDA-NIFA grant 2009-03611 issued to the Pennsylvania State University.
Disclosure Statement
No competing financial interests exist.