
Abstract
Measures of disease burden such as quality-adjusted life years (QALYs) are increasingly important to risk-based food safety policy. They provide a means of comparing relative risk from diverse health outcomes. We present detailed disease-outcome trees and EQ-5D scoring for 14 major foodborne pathogens representing over 95% of foodborne illnesses, hospitalizations, and deaths due to specified agents in the United States (Campylobacter spp., Clostridium perfringens, Cryptosporidium parvum, Cyclospora cayetanensis, Escherichia coli O157:H7, Shiga toxin–producing E. coli non-O157, Listeria monocytogenes, nontyphoidal Salmonella enterica, Shigella, Toxoplasma gondii, Vibrio vulnificus, Vibrio parahaemolyticus and other noncholera Vibrio, and Yersinia enterocolitica). We estimate over 5800 QALYs lost per 1000 cases of L. monocytogenes and V. vulnificus, compared to 125 QALYs lost per 1000 cases of T. gondii, 26 for E. coli O157:H7, 16 for Salmonella and Campylobacter, and 14 for Y. enterocolitica. The remaining 7 pathogens are estimated to cause less than 5 QALYs lost per 1000 cases. In total, these 14 pathogens cause over 61,000 in QALY loss annually, with more than 90% due solely to acute infection being responsible for 65% of total QALY loss, with premature mortality and morbidity due to chronic and congenital illness responsible for another 28%. These estimates of the burden of chronic sequelae are likely conservative; additional epidemiological research is needed to support more accurate burden estimates. This study shows the value of using integrated metrics for comparing disease burden, and the need to consider chronic and congenital illness when prioritizing foodborne pathogens.
Introduction
I
This article presents estimates of QALY losses for 14 major pathogens in the United States. These pathogens (Campylobacter spp., Clostridium perfringens, Cryptosporidium parvum, Cyclospora cayetanensis, Escherichia coli O157:H7, Shiga toxin–producing E. coli non-O157, Listeria monocytogenes, nontyphoidal Salmonella enterica, Shigella, Toxoplasma gondii, Vibrio vulnificus, Vibrio parahaemolyticus and other noncholera Vibrio, and Yersinia enterocolitica) cause over 95% of annual foodborne illnesses, hospitalizations, and deaths attributable to U.S. foodborne disease of specified etiology (Scallan et al., 2011; Hoffmann et al., 2012). This article presents detailed, quantitative disease-outcome trees characterizing disease severities and outcomes, and reports EuroQoL 5D (EQ-5D) domain scores, associated population-based health-related quality of life (HRQL) preference weights, and QALY losses for each health state in each tree. This work is part of a larger research effort that attributes illnesses to food sources and estimates costs of illness for these pathogens (Batz et al., 2012; Hoffmann et al., 2012).
This study adds to a growing body of international research using integrated health metrics, such as QALYs, disability-adjusted life years (DALYs), or cost of illness, to estimate the annual burden of foodborne illnesses (Buzby et al., 1996; Frenzen et al., 2005; Kuchenmüller, 2009; Lake et al., 2010; Ruzante et al., 2010; Shin et al., 2010; Van Lier et al., 2007; Havelaar et al., 2012; Hoffmann et al., 2012; Scharff, 2012). Our analysis is most similar to Scharff (2012) and Food and Drug Administration (FDA) (2013), but also includes pathogens not covered by FDA, captures more disease health states, estimates QALY loss due to mortality, and per case and total annual QALY loss by pathogen. We also present more detailed methodology and data sources than described in these prior studies, information critical to further development and application of this approach.
Like other U.S. analyses, we use the EQ-5D QALY instrument (Scharff, 2012; FDA, 2013). This follows guidance from the Office of Management and Budget and the National Academy of Sciences (OMB, 2003; IOM, 2006). DALY and other QALY instruments have also been used to measure and compare disease burden, primarily outside U.S. regulatory analysis, and are discussed below.
We find a wide range in QALY losses per case of foodborne illness by pathogen, as well as in total annual disease burden. Ninety percent of total QALY loss from these 14 pathogens is due to 5 pathogens. About 65% of total QALY loss is due to premature mortality; around 25% is due to congenital disease and chronic sequelae of acute infection. We find the EQ-5D straightforward to apply, but insensitive to subtle differences in severity of morbidity. Given the relative importance of death to both disease burden and pathogen ranking, this insensitivity appears not to be of practical importance.
Materials and Methods
Disease incidence and per-case QALY loss are used to estimate total annual QALY loss (Gold et al., 1996). Estimation of per-case QALY loss involved three basic steps: creation of pathogen-specific disease-outcome trees with accompanying health state descriptions; characterization of health states using EQ-5D scores; and calculation of QALY losses based on EQ-5D HRQL weights and health-state duration. Disease-outcome trees, health-state descriptions, and EQ-5D scores were reviewed by clinicians with appropriate specialties and by a nine-person advisory panel of nationally recognized experts in foodborne and enteric disease (see Acknowledgments). Illness incidence, hospitalization rates, and mortality rates are from Scallan et al. (2011).
Supplementary materials (Supplementary Data are available online at
Disease-outcome trees
Pathogen disease-outcome trees partition illnesses by severity, with branches describing disease progression resulting in recovery, death, or long-term sequelae (Fig. 1). Our trees have three primary branches: severe (hospitalized), moderate (visit a physician), and mild (do not seek care) cases. The duration and likelihood of every health state in each tree, along with detailed symptom descriptions, are used to estimate QALY losses.
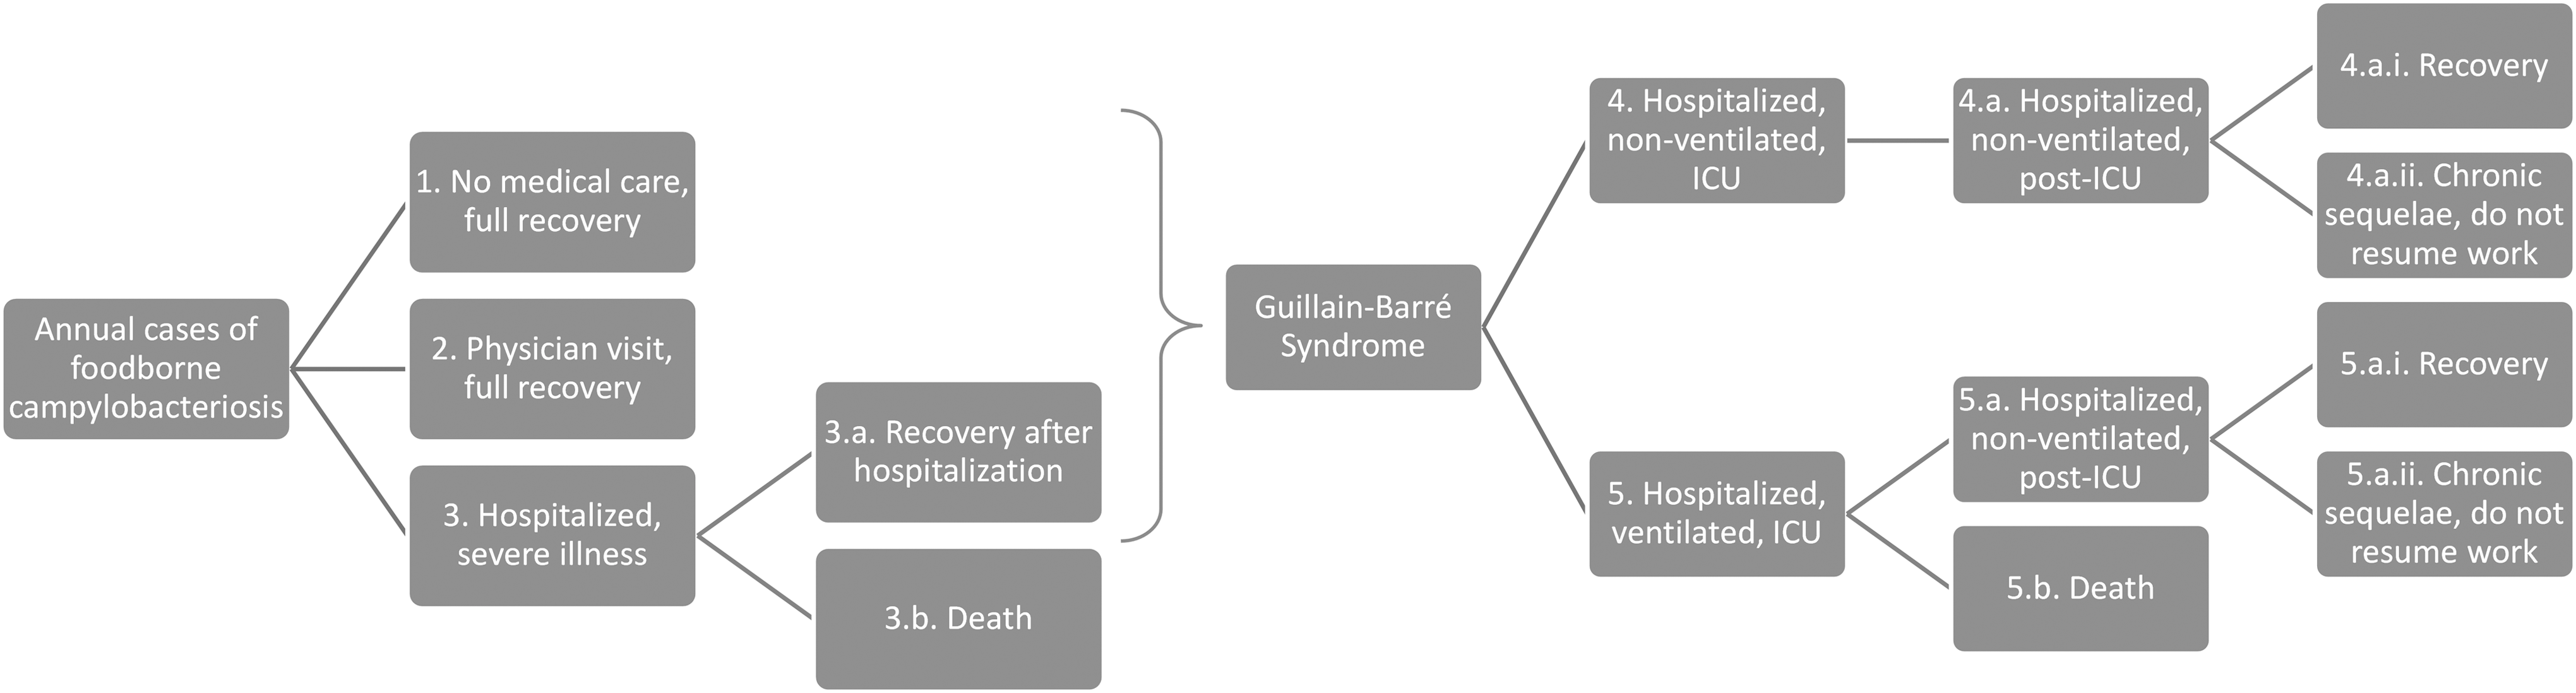
Example of a disease-outcome tree: Campylobacter spp. Bracket indicates that Guillain-Barré syndrome may occur after recovery from mild, moderate, or severe campylobacteriosis. ICU, intensive care unit.
One objective of this research was to maintain consistency with disease outcome trees previously developed for U.S. Department of Agriculture (USDA) estimates of the costs of foodborne illness (Buzby et al., 1996; Frenzen et al., 2005; Frenzen, 2008; ERS, 2011). USDA trees for foodborne Campylobacter, E. coli O157:H7, L. monocytogenes, and Salmonella were updated to reflect current disease incidence estimates (Scallan et al., 2011). Extensive literature reviews were used both to confirm that structural changes were not needed in these USDA trees and to determine the structure of trees for other pathogens. For these other pathogens, values for likelihoods and durations of health states were drawn from U.S. Centers for Disease Control and Prevention (CDC) surveillance data, Nationwide Inpatient Sample (NIS) hospitalization utilization data (HCUP, 2006), and the peer-reviewed literature.
Several criteria guided our choice of data and literature in building disease-outcome trees. Consistency across pathogens was critical for reliable comparison of burden across pathogens.
Where available, we used nationally representative, U.S. data with coverage across all or most pathogens. Where this was not available, we relied on peer-reviewed research. Given the breadth of this project and resource limitations, conducting formal systematic reviews was not feasible, but our choice of studies was guided by criteria on quality of epidemiological evidence similar to that recommended for systematic reviews (EFSA, 2010). Studies based on nationally representative samples or active surveillance were preferred over national studies based on passive surveillance data. Case–control studies were preferred over cohort studies. Study sample size, recency of the study, and representativeness relative to the U.S. national population were all considered. Where high-quality systematic reviews or meta-analyses were available, they were used. U.S. studies were preferred to non-U.S. studies of equal quality due to differences across countries in demographics, exposure patterns, and health care utilization.
For all pathogens, the rates of hospitalization and death following acute illness are from Scallan et al. (2011). For most pathogens, the physician visit rates are based on differing rates of care-seeking for those with bloody and nonbloody diarrhea (Voetsch et al., 2004), weighted by pathogen-specific rates of bloody and nonbloody diarrhea. The number of mild cases is the difference between total cases and the sum of moderate and severe cases.
Durations of hospitalization are based on U.S. Department of Agriculture, Economic Research Service (ERS) studies and on primary analysis of NIS data from 2001 to 2003 using International Statistical Classification of Diseases (ICD-9) codes for primary diagnosis (Buzby et al., 1996, 1997; Frenzen et al., 2005; HCUP, 2006; ERS, 2011). Hospital duration for remaining pathogens, as well as durations of moderate and mild symptoms, are midpoints of ranges drawn from medical textbooks, reviews of clinical characteristics, surveillance summaries, outbreak reports, and prior disease burden estimates.
We include a number of long-term sequelae: Campylobacter-associated Guillain-Barré syndrome, chronic vision problems from acquired toxoplasmosis, hemolytic uremic syndrome, and end-stage renal disease from infection with E. coli O157:H7 and non-O157
EQ-5D scoring
HRQL metrics were originally developed to inform clinical care decisions (Gold, 1996). In 2006, the National Academies of Sciences, Institute of Medicine (IOM) evaluated the strengths and limitations of HRQL metrics for use in U.S. regulatory analysis (IOM, 2006). The IOM review recommended use of QALYs as a class and gave detailed attention to four QALY indices: Quality of Well Being, Health Utility Index, EQ-5D, and SF-6D. The IOM stressed the importance of basing regulatory analysis on the preferences of the population being affected by the regulation. The IOM recommended use of the EQ-5D in U.S. regulatory analysis because it provided (and continues to provide) the only HRQL weights based on a nationally representative U.S. survey and because the index is open-access, reasonably sensitive, and easy to apply to health outcomes targeted by regulation (Shaw et al., 2005; IOM, 2006; Fryback, 2010).
The research team scored each health state in each tree on each of the five EQ-5D functional domains (Table 1) (Rabin and de Charro, 2001). For example, mild salmonellosis not requiring professional care received an EQ-5D score of 11121 for impact on mobility, self-care, usual activities, pain, and anxiety. Statistical models based on U.S. survey results were used to map EQ-5D scores to HRQL preference weights, which range from 1 (perfect health) to 0 (death) and include some negative values for health states considered worse than death (Shaw et al., 2005). We multiply age- and gender-specific average HRQL weights based on the same U.S. survey (Hanmer et al., 2006) by U.S. population tables (U.S. Census, 2009) to estimate an average population HRQL of 0.8810.
QALY calculation
QALY loss associated with an adverse health state is defined as the difference between the HRQL weight for that health state and the HRQL weight for baseline health (health prior to illness), multiplied by duration in years. For acute morbidity, we assume that baseline health is the U.S. population average, with a HRQL of 0.8810.
By definition, death has an HRQL preference weight of 0, so the QALY loss associated with premature mortality is calculated as the loss of average population HRQL in all years between the deceased's age and average U.S. life expectancy (76.4 years). The number of life years lost differs by age, so we calculate QALY losses per death for individuals in 11 age categories, based on age midpoints. Because population average HRQL declines with increased age (Hanmer et al., 2006), we cannot simply multiply HRQL for these age midpoints by years of lost life. This would overestimate QALY loss. Rather, we tabulate the QALY loss for each future year of forgone life based on how old the individual would have been in that year and the average population HRQL of that age. QALY loss by age category is then multiplied by the proportion of all deaths caused by a pathogen that are of people in this age category. The sum of these values is pathogen-specific QALY loss per death (Table 2).
Different age categories used for children under 10 years of age, by pathogen, based on available data.
For each age category, QALY loss for life years lost is computed as loss of population baseline health-related quality of life (HRQL) between that category's midpoint age and U.S. life expectancy. Because population baseline HRQL declines with increased age (Hanmer et al., 2006), these estimates reflect both the baseline HRQL at the time of death as well as future baseline HRQL pathways for individuals in that age category.
C. cayetanensis age distribution reported, though we estimate zero deaths based on Scallan et al. (2011).
Premature deaths following end-stage renal disease (ESRD) due to non-O157 Shiga toxin–producing Escherichia coli follow the age distribution for ESRD after E. coli O157:H7.
For toxoplasmosis, the age distribution used for deaths is also used as the age distribution for chronic vision problems.
For each pathogen, QALY loss per death is calculated as the average QALY loss per death, by age category, multiplied by the fraction of deaths due to the pathogen occurring in that age category, and then summed across age categories.
Age distributions for deaths are assumed to be the pathogen-specific age distribution for hospitalizations in NIS data (2001–2003), or the age distribution of FoodNet laboratory confirmed cases (2001–2004). We had intended to use age distributions of deaths from FoodNet surveillance, but these data were not made available, and have yet to be published. While our literature review identified age distributions of deaths for some pathogens, we found considerable variability and were very concerned that differences in study quality and design would result in inconsistent assumptions across pathogens.
We use a similar age-based approach for lifelong sequelae as for premature mortality; age-varying baseline HRQL weights are used to calculate QALY losses for all future years between age of disease onset and average U.S. life expectancy. QALY loss for each pathogen is the likelihood-weighted average of QALY losses for each of the pathogen's health states (Table 3). These values are multiplied by the number of estimated annual domestically acquired foodborne illnesses caused by that pathogen to obtain estimates of total annual QALY losses.
Centers for Disease Control and Prevention estimated annual domestically acquired foodborne illnesses (Scallan et al., 2011).
Estimates of cost of illness from Hoffmann et al. (2012).
Vibrio, other refers to V. parahaemolyticus and other noncholera Vibrio spp. STEC non-O157 refers to Shiga toxin–producing Escherichia coli other than E. coli O157:H7.
Results
EQ-5D scores and HRQL weights are consistent within and across pathogens. That is, HRQL weights decline with increasing severity within each pathogen, and health states with similar severities but associated with different pathogens have similar EQ-5D scores and HRQL weights (see Supplementary Materials S1).
Figure 2 shows average QALY loss per 1000 cases and estimated annual QALY losses for each pathogen. The range of per-case disease burden is wide, spanning over three orders of magnitude: V. vulnificus and L. monocytogenes have per-case impacts of nearly 6000 QALYs lost per 1000 cases, while six pathogens cause less than 5 QALYs lost per 1000 cases. Likewise, there is a wide range of total QALY losses; four pathogens have annual disease burden greater than 9000 QALYs lost per year and seven pathogens cause less than 900 QALYs lost per year. The 5 pathogens ranking highest in total QALY loss also have a wide range of per-case QALY loss, from less than 1 (Norovirus) to nearly 6000 (L. monocytogenes) per 1000 cases. Figure 3 shows annual QALY loss for all 14 pathogens, broken out into morbidity and mortality caused by acute versus congenital and chronic disease. The figure shows the dominance of mortality valuation in disease burden estimates, as well as the importance of including congenital impacts and long-term health outcomes. Only 0.01% of illnesses from these 14 pathogens result in death, yet these cases cause most of the QALY loss. Mortality from acute infection alone causes 65% of total QALY losses. Mortality and morbidity from long-term sequelae and congenital illnesses cause 28% of total QALY losses. Exclusion of chronic sequelae and congenital illness would affect pathogen rankings; Campylobacter would drop below Norovirus and T. gondii in estimated annual QALY losses.
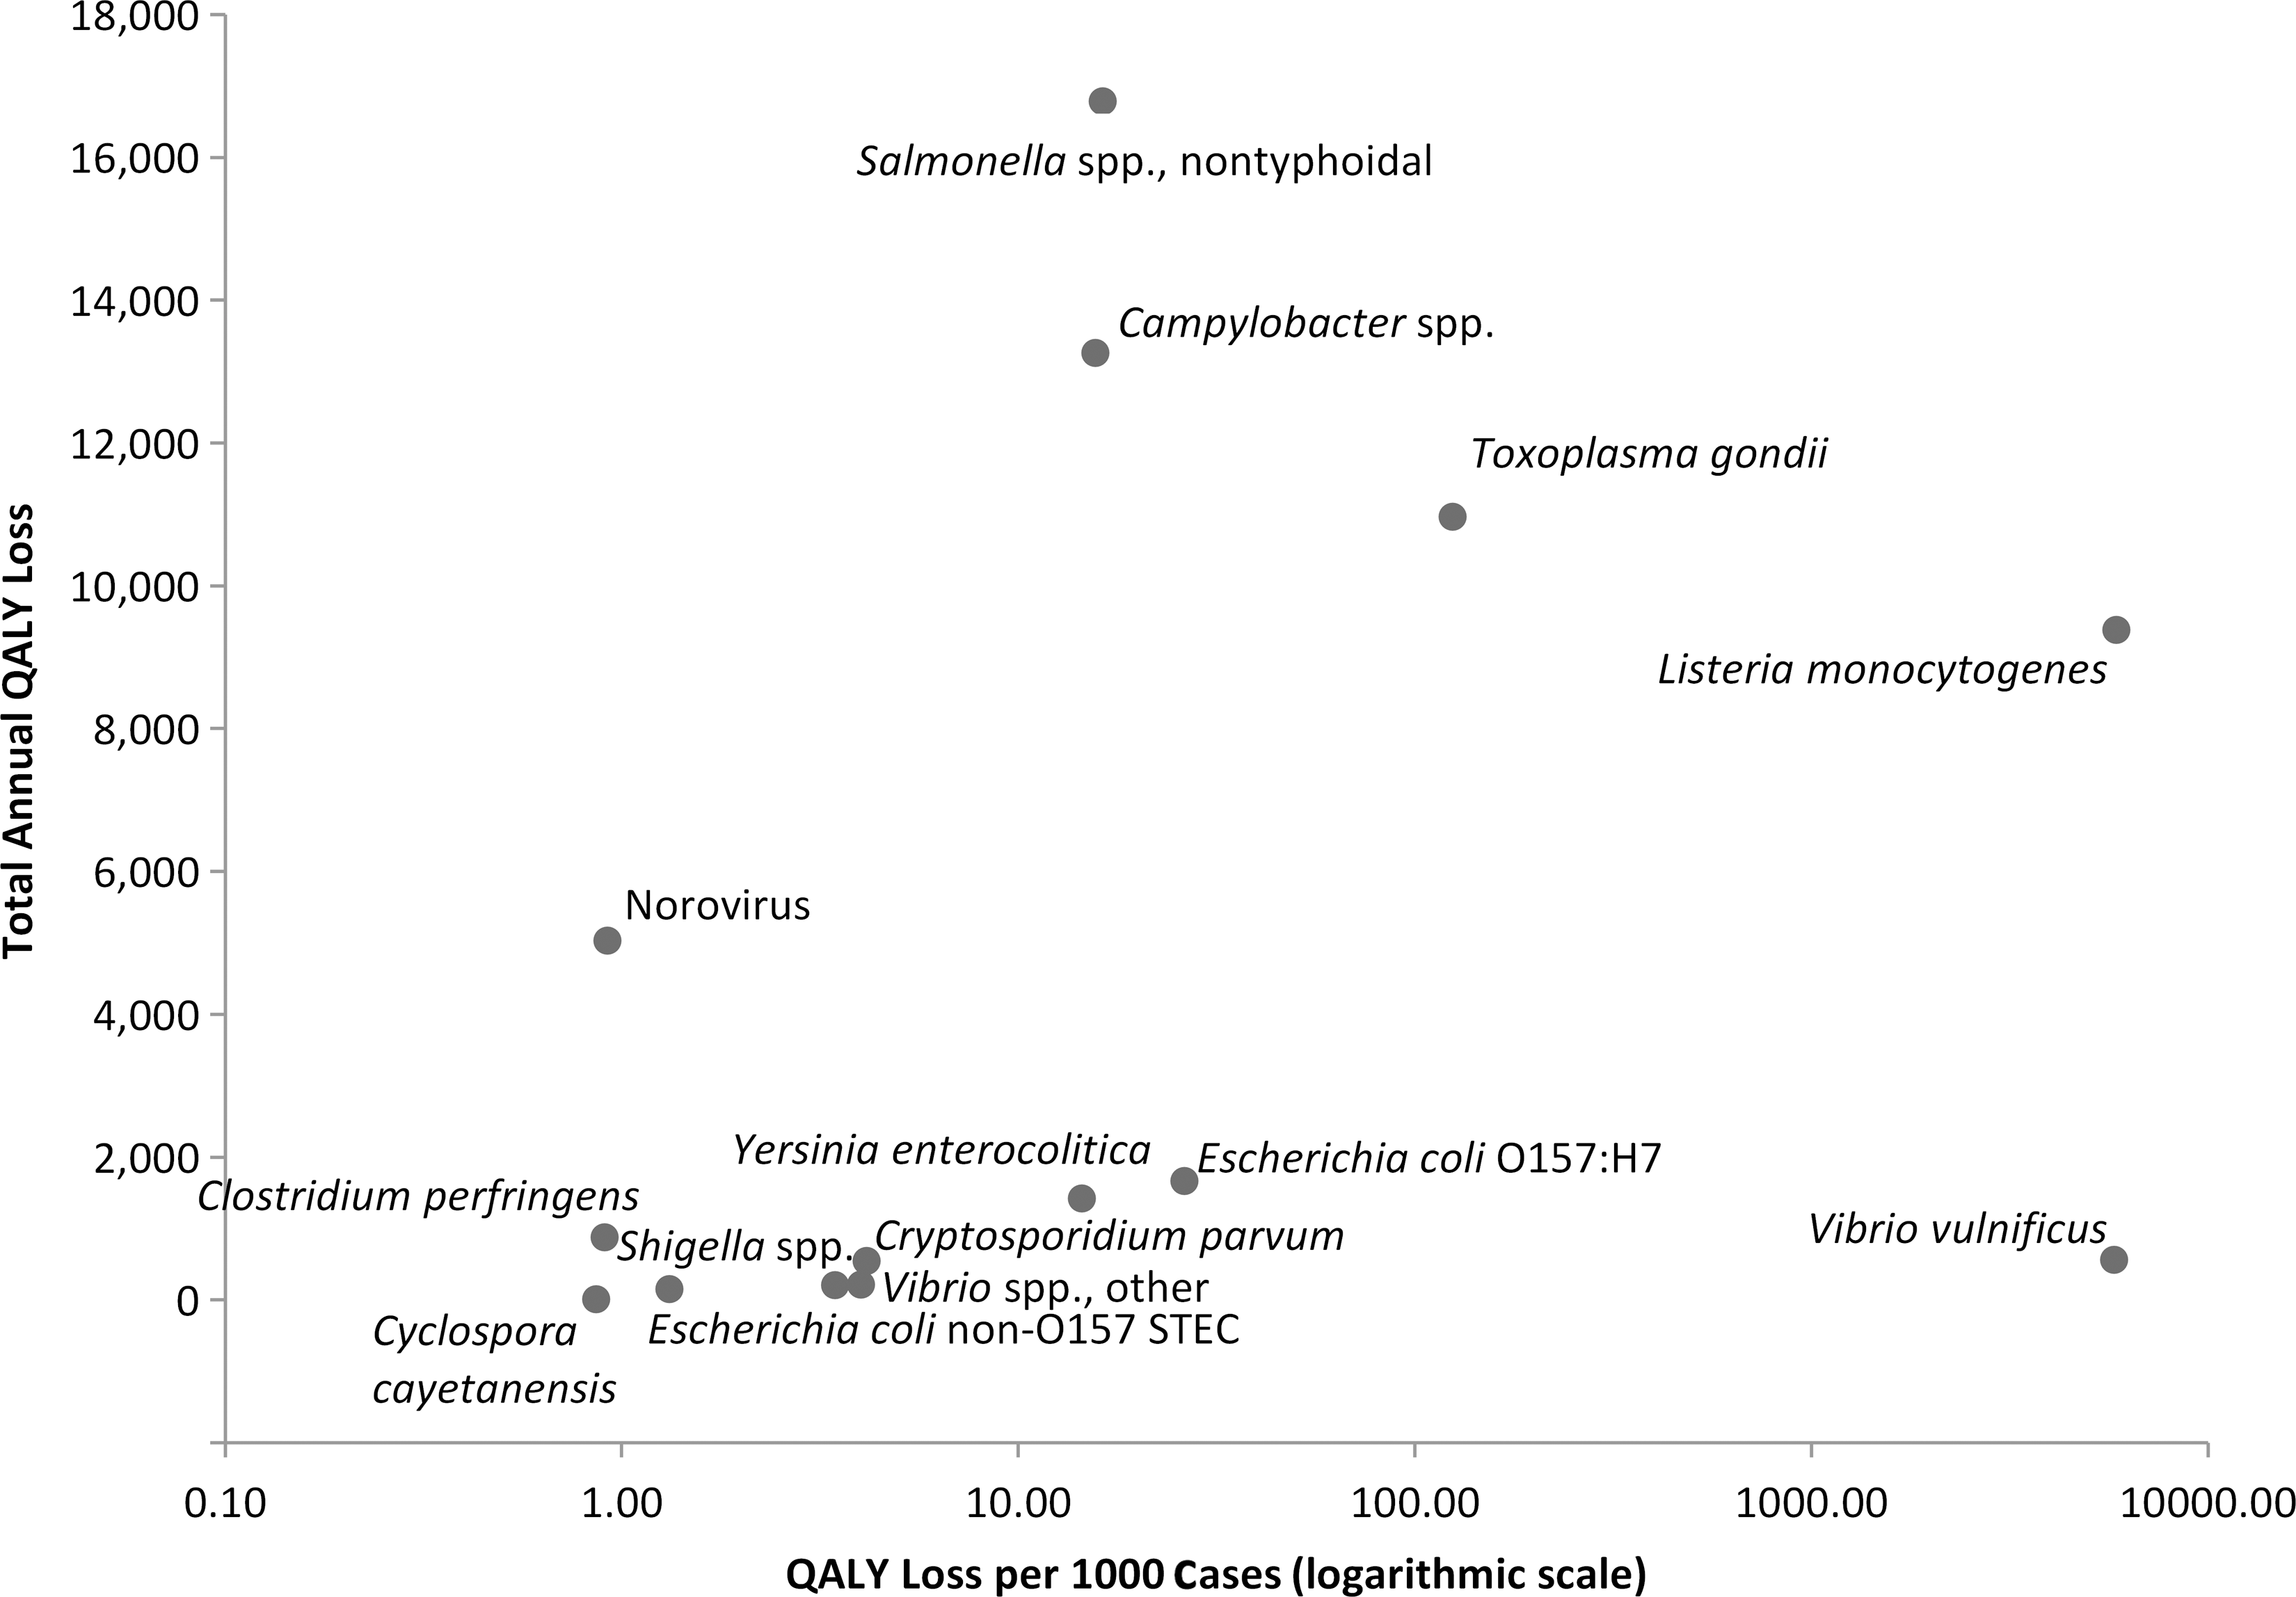
Estimates of quality-adjusted life year (QALY) loss per case of illness and total annual QALY loss for 14 foodborne pathogens. STEC non-O157 refers to Shiga toxin–producing Escherichia coli other than E. coli O157:H7, and Vibrio spp, other refers to Vibrio parahaemolyticus and other noncholera Vibrio spp.
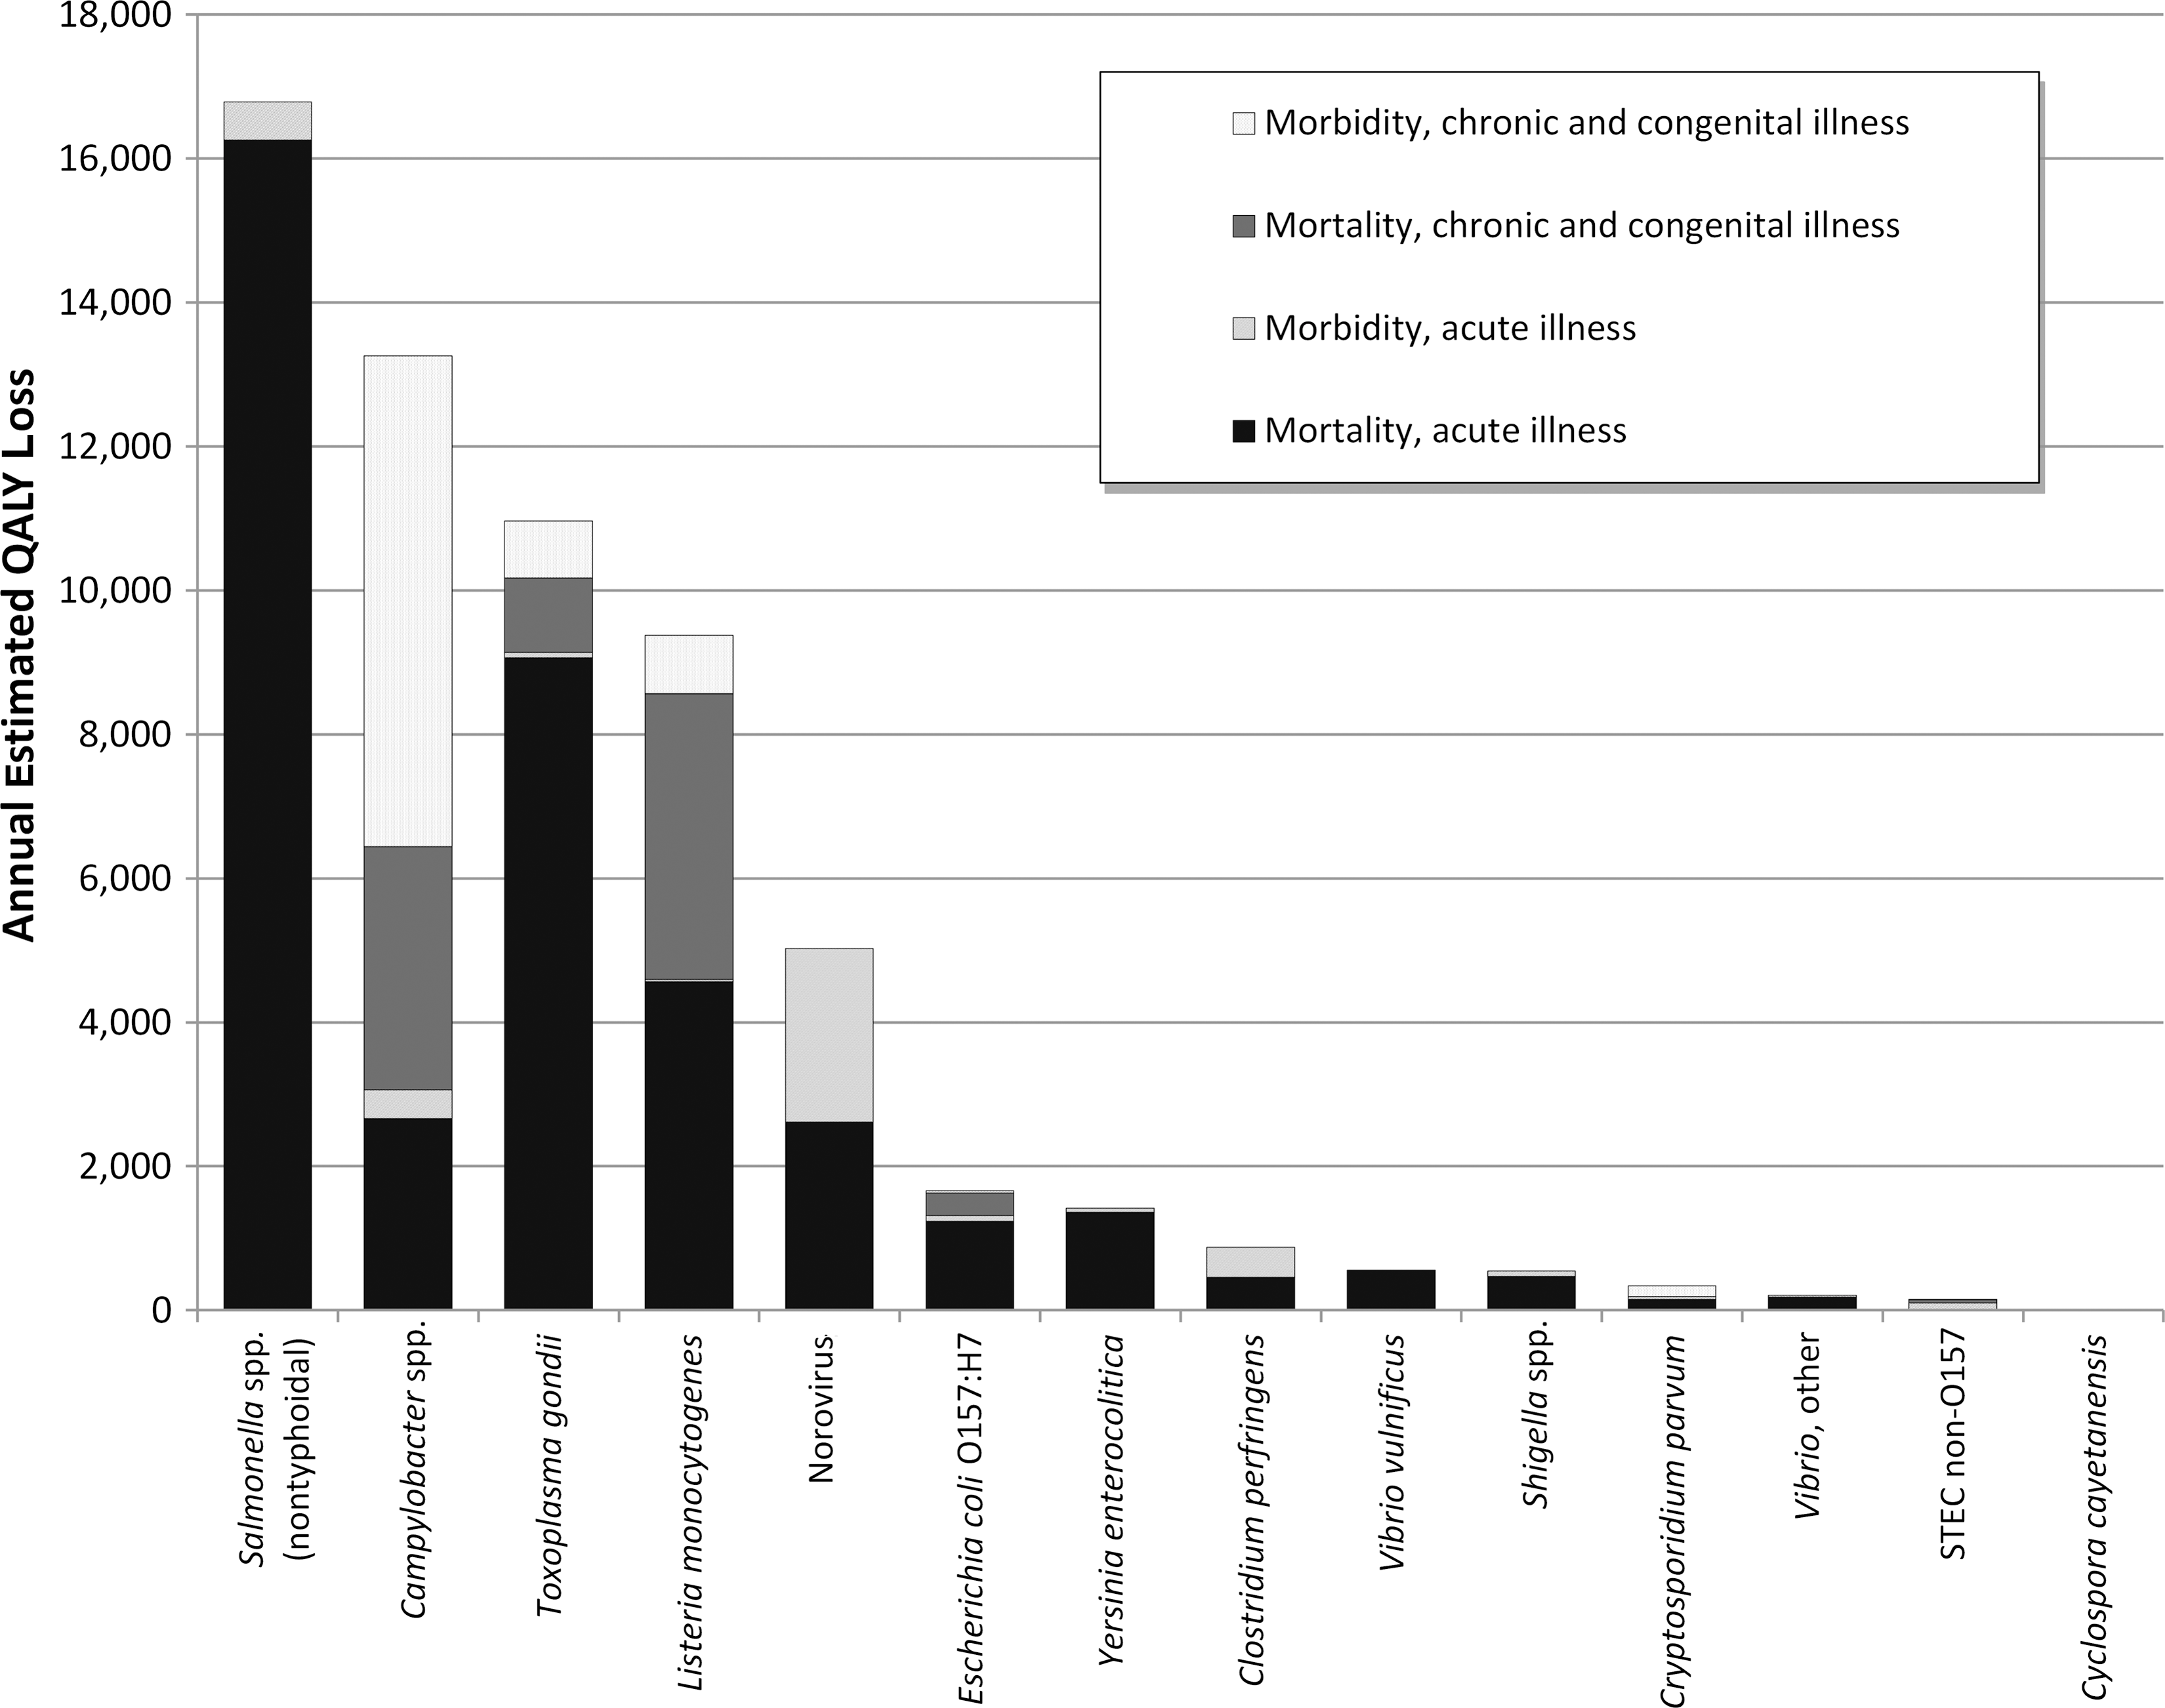
Ranked annual estimates of quality-adjusted life year (QALY) loss from 14 foodborne pathogens: Morbidity and mortality due to acute, congenital, and chronic illness. STEC non-O157 refers to Shiga toxin–producing Escherichia coli other than E. coli O157:H7, and Vibrio, other refers to V. parahaemolyticus and other noncholera Vibrio spp.
Discussion
There are important implications from these results. The concentration of overall disease burden in a few pathogens suggests these should be a focus for policy makers. For example, fully eliminating foodborne disease from the seven lowest-ranked pathogens would have about the same public health impact as reducing the rate of salmonellosis by 15%. Focusing on pathogens with high per-case impacts is also warranted due to disproportionate individual burden. Preventing a single case of V. vulnificus infection reduces public health burden as much as preventing about 370 cases of campylobacteriosis. Of course, technical feasibility and cost must also be considered.
Our research shows the importance of continued research on chronic sequelae of foodborne infection. We conservatively estimate that chronic sequelae cause more than a quarter of the total burden from 14 pathogens. Congenital and chronic health states are largely uncounted in national incidence estimates (Scallan et al., 2011). There is a need for research to better quantify known relationships (e.g., the likelihood of reactive arthritis and irritable bowel syndrome following salmonellosis or campylobacteriosis), and to better understand possible causality (e.g., between STEC and increased latent risk of hypertension, diabetes, and heart disease) (Batz et al., 2013).
HRQL measures are highly sensitive to duration; short-term health states receive less weight than long-term health states, and elderly deaths receive less weight than adult or youth deaths. Empirically, our results reflect these assumptions. Though some health states involving intensive care unit treatment had negative HRQL weights, they were of very short duration relative to lost life expectancy and therefore added little to total burden estimates. Only 1% of total QALY losses were from hospitalization and 6% were from nonhospitalized cases.
In economic analyses, reducing mortality also dominates health benefits from government policy (EPA, 2011). As part of our research, we also estimated economic burden of illness from these 14 pathogens (Hoffmann et al., 2012). Mortality following acute infection accounted for 78% of this burden; the same 5 pathogens dominate pathogen rankings in dollars as in QALYs.
Our study has a number of limitations. We used data on age of hospitalizations or of lab-confirmed cases as proxies for age distribution of fatalities, probably biasing our distributions away from the elderly. This bias is consistent across pathogens, so while estimates of QALY losses would likely decrease with improved age data, the relative ranking of pathogens is unlikely to change substantially. Our study would be significantly improved with better data or synthesized knowledge on age distributions of deaths, as well as on age distribution of onset of long-term sequelae. Our models are deterministic. We explored Monte Carlo approaches, but had difficulty specifying some models due to large differences in quality of available data across pathogens.
We follow IOM recommendations and U.S. regulatory agencies in developing QALYs based on the EQ-5D. The World Health Organization uses DALYs for international comparisons, while others have used them to estimate country-level disease burden for foodborne pathogens. Our choice limits the ability to directly compare our disease burden estimates to those of other countries, though we find that our per-case QALY losses are comparable to per-case DALY estimates in the Netherlands (Havelaar et al., 2012). The EQ-5D is currently the only instrument with U.S. norms based on a large nationally representative population survey and thus remains the preferred instrument for U.S. policy analysis (Shaw et al., 2005; Fryback, 2010; Herdman et al., 2011).
We found the EQ-5D straightforward to apply but relatively insensitive to disease subtleties. A more sensitive instrument such as the EQ-5D-5L or SF-6D might better reflect differences in disease states. However, given the structural dominance of mortality in QALY loss estimates, the EQ-5D's insensitivity across non-fatal health outcomes may be of little practical importance.
Conclusion
Measuring the disease burden of foodborne pathogens is important for food safety prioritization. These prioritization efforts depend on the ability to estimate disease burden using integrated metrics, such as QALYs, that allow for directly comparing the relative risk of diverse health outcomes. This study provides a template for measuring and comparing the public health burden of foodborne pathogens, both on a per-case and annual basis. It also identifies important data gaps and research needs in conducting such analyses, and provides generalized insights into factors that drive estimates of QALY loss caused by major U.S. foodborne pathogens.
Footnotes
Acknowledgments
We thank Alan J. Krupnick, Paul S. Fischbeck, Heather Green, Michael McWilliams, and Michael R. Taylor for their contributions to this research. We also thank Douglas Archer, Paul Frenzen, Susan V. Grooters, Craig Hedberg, Lee-Ann Jaykus, Morris Potter, Elaine Scallan, Caroline Smith DeWaal, and Richard Williams for serving on our project advisory panel. This research was supported by the Robert Wood Johnson Foundation, the Cooperative State Research, Education, and Extension Service of the U.S. Department of Agriculture, and the Milbank Memorial Fund.
Disclosure Statement
No competing financial interests exist.
References
Supplementary Material
Please find the following supplemental material available below.
For Open Access articles published under a Creative Commons License, all supplemental material carries the same license as the article it is associated with.
For non-Open Access articles published, all supplemental material carries a non-exclusive license, and permission requests for re-use of supplemental material or any part of supplemental material shall be sent directly to the copyright owner as specified in the copyright notice associated with the article.